4.1 Credit markets have, historically, played a crucial role in sustaining growth in almost all countries, including advanced countries, which now have fully developed capital markets. Credit markets perform the critical function of intermediation of funds between savers and investors and improve the allocative efficiency of resources. Banks, which are major players in the credit market, play an important role in providing various financial services and products, including hedging of risks. Credit markets also play a key role in the monetary transmission mechanism.
4.2 Extension of credit, however, also poses some risks, which range from pure credit risk to the risk of over-lending. While pure credit risk is the risk of loss due to non-payment by the borrower, even though adequate precautions are taken at the time of loan origination, the risk of over-lending arises when banks extend loans without appropriate credit appraisal and due diligence on account of excessive optimism about future prospects. While pure credit risk may not be widespread and may normally not create systemic problems, over-lending is unsustainable and potentially destabilising for the system. Regulators in all countries, therefore, while seeking to maintain adequate growth, guard against its adverse impact by instituting appropriate regulatory and supervisory policies and strengthening of prudential norms.
4.3 The credit market in India has traditionally played a predominant role in meeting the financing needs of various segments of the economy. Credit institutions range from well developed and large sized commercial banks to development finance institutions (DFIs) to localised tiny co-operatives. They provide a variety of credit facilities such as short-term working loans to corporates, medium and long-term loans for financing large infrastructure projects and retail loans for various purposes. Unlike other segments of the financial market, the credit market is well spread throughout the country and it touches the lives of all segments of the population.
4.4 Prior to initiation of financial sector reforms in the early 1990s, the credit market in India was tightly regulated. Bank credit was the principal focus of monetary policy under the credit planning approach adopted in 1967-68. In the absence of a formal intermediate target, bank credit – aggregate as well as sectoral – came to serve as a proximate target of monetary policy. Monetary policy up to the mid-1980s was predominantly conducted through direct instruments with credit budgets for banks being framed in sync with monetary budgeting (Mohan, 2006a). The credit market was characterised by credit controls and directed lending. Various credit controls existed in the form of sectoral limits on lending, limits on borrowings by individuals, stipulation of margin requirements, need for prior approval from the Reserve Bank, if borrowing exceeded a specified limit (under the Credit Authorisation Scheme), and selective credit controls in the case of sensitive commodities. Lending interest rates by all types of credit institutions were administered. Credit markets were also strictly segmented. While commercial banks catered largely to the short-term working capital requirements of industry, development finance institutions focused mainly on long-term finance. Competition in the credit market was also limited. This led to several inefficiencies in the credit market.
4.5 A wide range of regulator y reforms, therefore, were introduced as part of financial sector reforms in the early 1990s to improve the efficiency of the credit market. As a result, the credit market in India has undergone structural transformation. The credit market has become highly competitive even though the number of credit institutions has reduced due to merger/conversion of two DFIs into banks, weeding out of unsound NBFCs and restructuring of urban co-operative banks and RRBs. Credit institutions now offer a wide range of products. They are also free to price them depending on their risk perception.
4.6 In the above backdrop, this chapter analyses trends in the credit market in India, with a special focus on various aspects of rapid credit growth in recent years. The chapter is pided into six sections. Section I briefly explains the significance of the credit market in economic growth. The structure of the credit market in India is delineated in Section II. Policy developments relating to the credit market since the early 1990s have been set out in Section III. Trends in credit growth in India in the post-reform period are analysed in Section IV. Recent trends in bank credit growth and their implications are also
REPORT ON CURRENCY AND FINANCE
analysed in this section. Section V suggests some measures with a view to further strengthening the role of the credit market in India. Concluding observations are presented in Section VI.
I. SIGNIFICANCE OF THE CREDIT MARKET
4.7 There is a broad consensus, among both academics and policy makers, that a developed financial system spurs economic growth through a number of channels: (i) acquisition of information on firms; (ii) intensity with which creditors exert corporate control; (iii) provision of risk-reducing arrangements; (iv) pooling of capital; and (v) ease of making transactions (Levine, 2004). There are two mechanisms for mobilising savings and channeling them into investments, viz., bank-based and market-based, as alluded to in Chapter I. Empirical evidence reveals that while a more developed financial sector is associated with higher income levels, there is no clear pattern with regard to financial structure.
4.8 In most countries, both the systems exist even as one system may be more dominant than the other. However, of the two systems, credit institutions have the distinct advantage in information gathering and processing to monitor the efficiency and productivity of projects. In fact, in recent years the existence of banks, which are the major players in the credit market, is attributed more to their information gathering capacity arising out of the existence of asymmetric information and moral hazard problems, than to the classic explanation relating to their ability to mobilise savings and channeling them into investment. Savers usually have incomplete information on the affairs of companies, which makes it more difficult for companies to obtain direct financing from the market. Intermediation by banks mitigates such agency problems. When the cost of acquiring information on a company by the providers of financial resources is high, the process of financing companies can be done more efficiently if the prospective investors are able to delegate the collection of such information to a specialised organisation (Diamond, 1984). Thus, financial intermediation is justified on the grounds of information gathering and company-monitoring functions performed by banks. By reducing the costs of acquiring and processing information, financial institutions encourage mobilisation of savings and improve resource allocation. Banks can also persify risk among a number of companies.
4.9 Firms in developing countries generally tend to rely more on debt finance, including bank credit. The emphasis on credit rather than equity arises due to various reasons. The cost of equity in developing economies is often much higher than the cost of debt due to the existence of higher perceived risk premia than in developed countries. The existence of artificially repressed interest rates contributes further to the problem. The other reasons for the heavy reliance on debt in developing countries include the fragility of their equity markets, lack of suitable accounting practices and the absence of adequate corporate governance practices. Given the high dependence on bank credit and lack of substitutes for external finance, firms in developing economies are generally highly sensitive to changes in the cost and flow of credit.
4.10 Credit markets in developing countries, in particular, play an important role, where apart from industry, agriculture is also an important segment of the economy. Besides, there are also a large number of small and medium enterprises in the industrial and service sectors, which are not able to access the capital market and have to depend on the credit market for their funding requirements. Thus, the importance of banks and other lending institutions in developing countries can hardly be overemphasised.
4.11 Commercial banks, given their preeminent position in the regulated financial sector, dominate the credit market. The quantity of loans created by the banking system is generally a function of both the willingness and ability of banks to lend. In an economy with ceilings on lending rates, banks face a higher credit demand than they can effectively supply, thus, necessitating reliance on a credit rationing mechanism. In a non-repressed financial system, on the other hand, the borrowers are, in principle, differentiated along the lines of risk characteristics and riskier borrowers are charged higher interest rates to account for default probabilities. This, however, may create the problem of adverse selection. Though riskier projects bring higher returns, banks, out of sustainability consideration, need to optimise the risk of their portfolio.
4.12 Another important factor influencing the supply of credit is the amount of reserves available from the central bank to the banking system. A large pre-emption of central bank money by the Government may constrain reserve supply to the banking system, thus, affecting their capacity for credit creation. Moreover, credit expansion could also be an endogenous process, i.e., it is the demand for credit that may drive the banking system’s ability to create credit in the economy.
4.13 Development of the credit market plays an important role in the monetary transmission mechanism. The traditional interest rate channel, represented by the ‘money view’, mainly focuses on the liability side as banks create money through chequable deposits. The asset side is not emphasised as firms’ financial structure is believed to be neutral to borrowings through loans from banks or through issuance of securities. This is based on the assumption that different financial assets such as bonds and bank loans are perfect substitutes. However, in terms of ‘credit view’, bonds and bank loans are not seen as perfect substitudes primarily because of information asymmetries. Firms facing informational problems find it more expensive to borrow through bonds than availing loans from banks.
4.14 According to the ‘credit view’, the direct effect of monetary policy is amplified by changes in the external finance premium (EFP) in the same direction. An EFP is the difference in cost of funds raised externally (by way of issuing equity or debt) and funds generated internally (retained earnings). Thus, monetary tightening increases EFP, while easing of monetary policy reduces EFP. As a result, the impact of a given change in short-term policy interest rates on demand and output is magnified, which reinforces the effects of variation in interest rates (Bernanke and Gertler, 1995). In this context, the most representative theoretical model of the credit view is that of Bernanke and Blinder (1988). It is a modification of the IS/LM framework and contains all the elements that allow for the theoretical definition of imperfect substitution between credit on the one hand, and bonds and securities on the other (Box IV.1). As a policy guide, Bernanke and Blinder conclude that if money demand shocks are more important than credit demand shocks, then a policy of targeting credit is probably better than a policy of targeting money.
4.15 Given that a developed financial intermediation system facilitates growth, policy makers tend to liberalise the system to facilitate financial development. The literature, however, suggests that authorities should take adequate caution in adopting a liberalised policy frameworks intended to develop the financial sector (IMF, 2006). Lax supervision and rudimentary regulation of newly liberalised financial institutions, often combined with a volatile macroeconomic environment, have led to systemic crises (Lindgren, et al, 1996 and Caprio and Klingebiel, 2003). Similarly, there is econometric evidence that shows that banking crises are more likely to occur in countries associated with liberalised credit markets operating in weak institutional environments. The East Asian crisis underlined the risks to economic stability and growth that a weak or vulnerable financial sector could pose.
II. INSTITUTIONAL STRUCTURE OF THE CREDIT MARKET IN INDIA
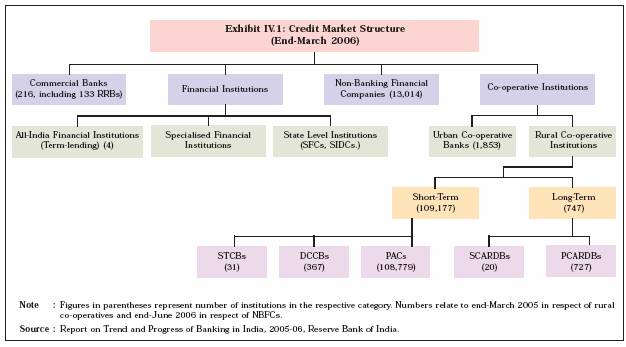
4.16 The credit market structure in India has evolved over the years. A wide range of financial institutions exist in the country to provide credit to various sectors of the economy. These include commercial banks, regional rural banks (RRBs), cooperatives [comprising urban cooperative banks (UCBs), State co-operative banks (STCBs), district central co-operative banks (DCCBs), primary agricultural credit societies (PACS), state co-operative and agricultural rural development banks (SCARDBs) and primary co-operative and agricultural rural development banks (PCARDBs)], financial institutions (FI) (term-lending institutions, both at the Centre and State level, and refinance institutions) and non-banking financial companies (NBFCs) (Exhibit IV.1).
4.17 Scheduled commercial banks constitute the predominant segment of the credit market in India. In all, 83 scheduled commercial banks were in operation at end-March 2006. The commercial banking sector is undergoing a phase of consolidation. There have been 12 mergers/amalgamations since 1999. The RRBs, which were set up in the 1970s to provide agricultural and rural credit, are being restructured at the initiative of the Government of India. Till October 31, 2006, 137 RRBs were amalgamated to form 43 new RRBs, bringing down the total number of RRBs in the country to 102 from 196 at end-March 2005.
4.18 The co-operative banking system, with two broad segments of urban and rural co-operatives, forms an integral part of the Indian financial system. Urban cooperative banks, also referred to as primary cooperative banks, play an important role in meeting the growing credit needs of urban and semi-urban areas of the country. The UCBs, which grew rapidly in the early 1990s, showed certain weaknesses arising out of lack of sound corporate governance, unethical lending, comparatively high levels of non-performing loans and their inability to operate in a liberalised environment. Accordingly, some of the weak UCBs have been either liquidated or merged with other banks. As a result, the number of UCBs declined from 1,942 at end-March 2001 to 1,853 by end-March 2006.
4.19 Historically, rural co-operative credit institutions have played an important role in providing institutional credit to the agricultural and rural sectors. These credit institutions, based on the nature of their lending operations, have typically been pided into two distinct segments, commonly known as the short-term cooperative credit structure (STCCS) and the long-term co-operative credit structure (LTCCS). The STCCS, comprising PACS at the village level, DCCBs at the intermediate level, and the STCBs at the apex level, provide crop and other working capital loans to farmers and rural artisans primarily for short-term purposes. The LTCCS, comprising SCARDBs at the State level and PCARDBs at the district or block level, provide typically medium and long-term loans for making investments in agriculture, rural industries and, in the recent period, housing. However, the structure of rural co-operative banks is not uniform across all the States of the country. Some States have a unitary structure with the State level banks operating through their own branches, while others have a mixed structure incorporating both unitary and federal systems.
4.20 Financial institutions owed their origin to the objective of state driven planned economic development, when the capital markets were relatively underdeveloped and judged to be incapable of meeting adequately the long-term requirements of the economy. Over the years, a wide range of FIs, mostly Government owned, came into existence to cater to the medium to long-term financing requirements of different sectors of the economy. FIs played a key role in extending development finance in India and for this purpose they were given access to concessional finance in the form of Government guaranteed bonds and Long-Term Operations (LTO) Fund of the Reserve Bank. However, the government’s fiscal imperatives and market dynamics forced a reappraisal of the policies and strategy with regard to the role of FIs in the economy and the concessional finance was phased out by the mid-1990s. A major restructuring in the financial sector occurred when two major FIs, viz., ICICI and IDBI converted into banks. Thus, this particular segment of the credit market has shrunk significantly in recent years.
4.21 NBFCs encompass a heterogeneous group of intermediaries and provide a whole range of financial services. Though heterogeneous, NBFCs can be broadly classified into three categories, viz., asset finance companies (such as equipment leasing and hire purchase), loan companies and investment companies. A separate category of NBFCs, called the residuary non-banking companies (RNBCs), also exists as it has not been categorised into any one of the above referred three categories. Besides, there are miscellaneous non-banking companies (Chit Fund), mutual benefit financial companies (Nidhis and unnotified Nidhis) and housing finance companies. The number of NBFCs operating in the country was 51,929 in 1996. Following the amendments to the provisions contained in Chapter III-B and Chapter III-C of the Reserve Bank of India Act, NBFCs both, deposit taking and non-deposit taking, are required to compulsorily register with the Reserve Bank. One of the conditions for registration for NBFCs was a minimum net owned fund (NOF) of Rs.25 lakh at the entry point. This limit was subsequently enhanced to Rs.2 crore for new NBFCs seeking grant of Certificate of Registration on or after April 21, 1999. The Reserve Bank received 38,244 applications for grant of certificate of registration (CoR) as NBFCs till end-March 2006. Of these, the Reserve Bank approved 13,141 applications, including 423 applications of companies authorised to accept/hold public deposits. Due to consolidation in the sector, the number of NBFCs declined to 13,014 by end-June 2006.
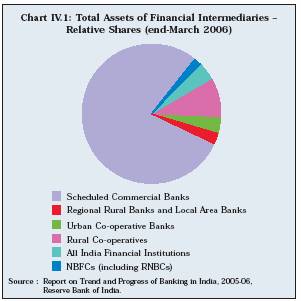
4.22 Of all institutions, in terms of assets, commercial banks constitute the largest category, followed by rural co-operatives (Chart IV.1).
Box IV.1
The Credit Channel of Monetary Policy
The impact of monetary policy on the real economy operates through various channels. Under the conventional approach, referred to as the ‘money view’, monetary policy influences the economy via the interest rate. The alternate channel, that emphasises credit conditions as the route of monetary transmission, is of relatively recent origin and is referred to as the ‘credit view’. Genesis of the credit view could be traced to the celebrated work of Bernanke and Blinder (1988), which presented the IS-LM framework augmented with bank-intermediated loans. It argued that since loans and bonds are not perfect substitutes, monetary policy operates not only through the conventional money channel but also through the credit channel. According to the ‘credit view’, a change in monetary policy that raises or lowers open market interest rates tends to change the external finance premium in the same direction. External finance premium is the difference between the cost of funds raised externally and the funds raised internally. Because of this additional effect of policy on the external finance premium, the impact of monetary policy on the cost of borrowing and consequently on real spending and real activity is magnified (Bernanke and Gertler, 1995). There are three reasons for which the credit channel is important. First, evidence suggests that credit market imperfections of the type crucial to the credit channel do indeed affect firms’ employment and spending decisions. Second, evidence suggests that small firms, which are more likely to be credit constrained, are hurt more by tight monetary policy than their larger counterparts. Third, asymmetric information - the core of credit channel analysis - proves to be highly useful in explaining some other important phenomena: e.g., why do financial intermediaries exist; structure of the financial sector; and why do financial crises occur (Mishkin, 1996).
There are two channels through which credit conditions are expected to affect monetary transmission. First, the ‘bank lending’ channel, that operates through modulation of bank reserves, is affected by monetary policy. Contractionary/ expansionary policy limits or enhances the ability of banks to lend and thereby reduces/increases investment and output. The second, the ‘balance sheet’ channel works through net worth of the borrowers. Contractionary policy would raise interest rates and thereby reduce the value of the collateral and net worth of the borrowers. This, accordingly, limits the ability of borrowers to borrow and invest. Further, the literature also points out a direct connection between the balance sheet channel and housing demand by features such as down-payment requirements, up-front transaction costs and minimum income to interest payment ratios. However, empirical evidence suggests that effectiveness of the credit channel depends upon conditions such as existence of bank-dependent borrowers, for instance, small and low net worth firms (Gertler and Gilchrist, 1993 and 1994), substitution between retail and bulk deposits and ability of the central bank to constrain banks’ potential to lend.
Empirical work to draw inferences on the existence of the credit channel in India is rather limited. A recent study examining the impact of financial liberalisation shows that banks in general are constrained in their lending operations by the availability of insured deposits and these constraints are more severe for those banks that lend predominantly against collateral. In India more than eighty five per cent of bank lending is against collateral. This implies a potentially important influence of the bank lending channel. A very recent attempt in estimating the bank lending channel has brought out a number of facets of the transmission mechanism - by employing structural VAR methodology on monthly data for all the Indian scheduled commercial banks spanning from April 1993 to April 2002 (Pandit, et al, 2006). First, the study validates the existence of a bank lending channel in the Indian context. This implies that the central bank, while formulating monetary policy, is likely to encounter independent shifts in the loan supply. Second, evidence seems to point to the fact that large banks with a wider resource base can more successfully insulate their loan supply from contractionary policy shocks vis-à-vis small banks. Third, the quantitative instruments such as the cash reserve ratio (CRR) continue to be important along with the price instruments such as the Bank Rate. Finally, prudential regulations have an important role to play in influencing lending decisions of banks. In particular, the introduction of capital adequacy ratios has made banks more concerned with the risk-return profile of loans, since additional lending warrants augmenting of capital base in order to adhere to the regulatory capital standards.
References:
Bernanke, Ben, and A. Blinder. 1988. “Credit, Money and Aggregate Demand.” American Economic Review 135-139, May.
Bernanke, Ben, and M. Gertler. 1995. “Inside the Black Box: The Credit Channel of Monetary Policy Transmission.”
Journal of Economic Perspectives, Vol.9: 27-48.
Pandit, B.L., Ajit Mittal, Mohua Roy and Saibal Ghosh. 2006. “Transmission of Monetary Policy, and the Bank Lending Channel: Analysis and Evidence for India.” DRG Study No.
25 , Reserve Bank of India.
III. POLICY DEVELOPMENTS IN THE CREDIT MARKET IN INDIA
4.23 The credit market, with commercial banks as its predominant segment, has been the major source for meeting the finance requirements in the economy, both for the private sector and the Central and State Government enterprises. In addition to sharing of resources between the private and the public sectors, a significant proportion of credit by commercial banks is earmarked for the priority sector1 . For a few decades preceding the onset of banking and financial sector reforms in India, credit institutions operated in an environment that was heavily regulated and characterised by barriers to entry, which protected them against competition. The issue of allocation of bank resources among various sectors was addressed through mechanisms such as SLR, credit authorisation scheme (CAS), fixation of maximum permissible bank finance (MPBF) and selective credit controls. This regulated environment set in complacency in the manner in which credit institutions operated and responded to the customer needs. The interest rate played a very limited role as the equilibrating mechanism between demand and supply of resources. The resource allocation process was deficient, which manifested itself in poor asset quality. They also lacked operational flexibility and functional autonomy.
1 Priority sector comprises agriculture (both direct and indirect), small scale industries, small roads and water transport operators, small business, retail trade, professional and self-employed persons, state sponsored organisations for Scheduled Castes/Scheduled Tribes, education, housing (both direct and indirect), consumption loans, micro-credit, loans to software, and food and agro-processing sector.
2 Under Section 18 of the Banking Regulation Act, 1949, all scheduled banks are required to maintain SLR, i.e., a certain proportion of their demand and time liabilities (DTL) as on the last Friday of the second preceeding fortnight as liquid assets (cash, gold valued at a price not exceeding the current market price or unencumbered approved securities valued at a price as specified by the Reserve Bank from time to time). Following the amendment of the Act in January 2007, the floor rate of 25 per cent for SLR was removed.
4.24 As part of financial sector reforms in the early 1990s, wide ranging reforms were introduced in the credit market with a view to making the credit institutions more efficient and healthy. The reform process initially focused on commercial banks. After significant progress was made to transform commercial banks into sound institutions, the reform process was extended to encompass other segments of the credit market. As part of the reform process, the strategy shifted from micro-management to macro level management of the credit market. These measures created a conducive environment for banks and other credit institutions to provide adequate and timely finance to different sectors of the economy by appropriately pricing their loan products on the basis of the risk profile of the borrowers.
4.25 Lending interest rates were deregulated with a view to achieving better price discovery and efficient resource allocation. This resulted in growing sensitivity of credit to interest rates and enabled the Reserve Bank to employ market based instruments of monetary control. The Statutory Liquidity Ratio (SLR2) has been gradually reduced to 25 per cent. The Cash Reserve Ratio (CRR) was reduced from its peak level of 15.0 per cent maintained during 1989 to 1992 to 4.5 per cent of Net Demand and Time Liabilities (NDTL) in June 2003. The reduction in statutory preemptions has significantly augmented the lendable resources of banks. Although the Reserve Bank continues to pursue its medium-term objective of reducing the CRR, in recent years, on a review of macroeconomic and monetary conditions, the CRR has been revised upwards in phases to 6.5 per cent.
4.26 While the stipulation for lending to the priority sector has been retained, its scope and definition have been fine-tuned by including new items. Further, restrictions on banks’ lending for project finance activity and for personal loans were gradually removed in order to enable banks to operate in a flexible manner in the credit market. As part of the financial sector reforms, the regulatory norms with respect to capital adequacy, income recognition, asset classification and provisioning have been progressively aligned with international best practices. These measures have enhanced transparency of the balance sheets of banks and infused accountability in their functioning. Accounting standards and disclosure norms were also strengthened with a view to improving governance and bringing them in alignment with international norms. As part of the reform programme, due consideration has been given to persification of ownership of banking institutions for greater market accountability and improved efficiency. Accordingly, several public sector banks expanded their capital base by accessing the capital market, which diluted Government ownership. To provide banks with additional options for raising capital funds with a view to enabling smooth transition to Basel II, the Reserve Bank, in January 2006, allowed banks to augment their capital funds by issue of additional instruments.
4.27 With a view to enhancing efficiency and productivity through competition, guidelines were laid down for establishment of new banks in the private sector. Since 1993, 12 new private sector banks have been set up. Foreign banks have also been allowed more liberal entry. Considering the special nature of banks, guidelines on ownership and governance in private sector banks were also issued in February 2005 (Box IV.2). As a major step towards enhancing competition in the banking sector, foreign direct investment in the private sector banks is now allowed up to 74 per cent (including investment by FIIs), subject to conformity with the guidelines issued from time to time. A roadmap for foreign banks, articulating a liberalised policy consistent with the WTO commitments was released in March 2005. For new and existing foreign banks, it was proposed to go beyond the existing WTO commitment of 12 branches in a year.
4.28 A large magnitude of resources of credit institutions had become locked up in unproductive assets in the form of non-performing loans (NPLs). Apart from limiting the ability of credit institutions to recycle their funds, this also weakened them by adversely affecting their profitability. The Reserve Bank and the Central Government, therefore, initiated several institutional measures to recover the past dues to banks and FIs and reduce the NPAs. These were Debt Recovery Tribunals (DRTs), Lok Adalats (people’s courts), Asset Reconstruction Companies (ARCs) and the Corporate Debt Restructuring (CDR) mechanism. Settlement Advisory Committees have also been formed at regional and head office levels of commercial banks. Furthermore, banks can also issue notices under the Securitisation and Reconstruction of Financial Assets and Enforcement of Security Interest (SARFAESI) Act, 2002 for enforcement of security interest without intervention of courts. Further, banks, Fls and NBFCs (excluding securitisation companies/ reconstruction companies) have been permitted to undertake sale/purchase of NPAs. Thus, banks and other credit institutions have been given a menu of options to resolve their NPA problems.
4.29 persification of credit risk is essential for expanding the flow of credit. Excessive concentration of lending to certain sectors leads to a higher risk burden. There are various options available for sharing of risk. Asset securitisation allows banks to conserve regulatory capital, persify asset risks and structure products to reflect investors’ preferences (IMF, 2006). There are various instruments for sharing and transferring credit risk. One such instrument is asset securitisation (Box IV.3).
4.30 With a view to ensuring healthy development of the securitisation market, the Reserve Bank issued guidelines on securitisation of standard assets on February 1, 2006 to banks, financial institutions and non-banking financial companies.
4.31 Comprehensive credit information, which provides details pertaining to credit facilities already availed of by a borrower as well as his repayment track record, is critical for the smooth operations of the credit market. Lack of credit history is an important factor affecting the credit flow to relatively less creditworthy borrowers. In the absence of credit history, pricing of credit can be arbitrary, the perceived credit risk can be higher and there can be adverse selection and moral hazard. Accordingly, a scheme for disclosure of information regarding defaulting borrowers of banks and financial institutions was introduced. In order to facilitate sharing of information relating to credit matters, a Credit Information Bureau (India) Limited (CIBIL) was set up in 2000 (Box IV.4).
4.32 Most of the reform measures initiated for commercial banks such as deregulation of lending interest rates, prudential norms relating to capital adequacy/asset classification provisioning, and NPAs management were also extended to other credit institutions as well with some modifications as appropriate.
Box IV.2
Credit Market Reforms
Lending Interest Rates
• Lending interest rates of commercial banks were deregulated in October 1994 and banks were required to announce their prime lending rates (PLRs).
• The Reserve Bank mooted the concept of benchmark prime lending rate (BPLR) on April 29, 2003 to address the need for transparency in banks’ lending rates as also to reduce the complexity involved in pricing of loans.
• Banks now are free to prescribe respective BPLRs, as also lend at sub-BPLR rates.
• Banks are also permitted to offer floating rate loan products linked to a market benchmark in a transparent manner.
Term-lending by Banks
• Various restrictions on term loans by banks were gradually phased out by 1997. In terms of the guidelines prevailing before the initiation of economic reforms in 1991, banks were expected to extend term loans for small projects in participation with the State level institutions, though it was not mandatory.
• For large projects, however, they were allowed to participate compulsorily in participation with all-India FIs, subject to the condition that the share of the banking system would be restricted to 25 per cent of term loan assistance from banks and FIs and the aggregate term finance from the banking system could not exceed Rs.75 crore.
Asset Classification and Provisioning, and Capital Adequacy
• In terms of asset classification and provisioning norms prescribed in 1994, banks are required to classify assets into four categories, viz., standard assets, substandard assets, doubtful assets and loss assets, with appropriate provisioning requirements for each category of assets.
• The concept of ‘past due’ in the identification of non-performing assets (NPAs) was dispensed with effective from March 2001, and the 90-day delinquency norm was adopted for the classification of NPAs with effect from March 2004.
• As a major step towards tightening of prudential norms from the year ended March 2005, an asset is required to be classified as doubtful if it remains in the sub-standard category for 12 months as against the earlier norm of 18 months. Banks are now required to make provisioning against standard assets to the tune of 0.40 per cent except for certain specified sectors. These include direct advances to agriculture and SME sectors (0.25 per cent), residential housing loan beyond Rs.20 lakh (1.0 per cent) and personal loans (2.0 per cent). (In case of specified sectors, the general provisioning requirement increased from 0.4 per cent to 1.0 per cent in May 2006 and further to 2.0 per cent in January 2007).
• Banks were advised to adopt graded higher provisioning in respect of: (a) secured portion of NPAs included in 'doubtful' for more than three years category; and (b) NPAs which have remained in 'doubtful' category for more than three years as on March 31, 2004. Provisioning ranging from 60 per cent to 100 pre cent over a period of three years in a phased manner, from the year ended March 31, 2005 has been prescribed. However, in respect of all advances classified as 'doubtful for more than three years' on or after April 1, 2004, the provisioning requirement has been stipulated at 100 per cent. The provisioning requirement for unsecured portion of NPAs under the above category was retained at 100 per cent.
• Banks were subject to capital adequacy norms in 1994, according to which, banks were required to maintain capital to risk weighted asset ratio of 8 per cent. Subsequently, the ratio was raised to 9 per cent in 1999.
Exposure Limits
• Regulatory limits on banks’ exposure to individual and group borrowers in India were prescribed to avoid concentration of credit
• The applicable limit is 15 per cent of capital funds in the case of a single borrower and 40 per cent in the case of a group of borrowers. Credit exposure to borrowers belonging to a group may exceed the exposure norm of 40 per cent of bank’s capital funds by an additional 10 per cent (i.e., up to 50 per cent), provided the additional credit exposure is on account of extension of credit to infrastructure projects. Credit exposure to a single borrower may exceed the exposure norm of 15 per cent of bank’s capital funds by an additional 5 per cent (i.e., up to 20 per cent). In addition, banks may, in exceptional circumstances, with the approval of their boards, consider enhancement of the exposure to a borrower up to a further 5 per cent of capital funds.
Competition Enhancing Measures
• Public sector banks were allowed to raise capital from the equity market up to 49 per cent of the paid-up capital.
• A comprehensive policy framework was laid down on February 28, 2005 for ownership and governance in private sector banks. The broad principles underlying the framework ensure that : (i) ultimate ownership and control is well persified; (ii) important shareholders are ‘fit and proper’; (iii) directors and CEO are ‘fit and proper’ and observe sound corporate governance principles; (iv) private sector banks maintain minimum capital (initially Rs.200 crore, with a commitment to increase to Rs.300 crore within three years)/net worth (Rs.300 crore at all times) for optimal operations and for systemic stability; and (v) policy and processes are transparent and fair.
Box IV.3
Asset Securitisation
Securitisation is a process through which illiquid assets are transformed into a more liquid form of assets and distributed to a broad range of investors through capital markets. The lending institution’s assets are removed from its balance sheet and are instead funded by investors through a negotiable financial instrument. The security is backed by the expected cash flows from the assets.
Securitisation as a technique gained popularity in the advanced countries in the 1970s. Favourable tax treatment, legislative enactments, establishment of Government-backed institutions that extend guarantees, and a pragmatic regulatory environment appear to have contributed to the successful development of this market. Securitisation involves pooling similar assets together in a separate legal entity or special purpose vehicle (SPV) and redirecting the cash flows from the asset pool to the new securities issued by the SPV. The SPV is a device to ensure that the underlying assets are insulated from the risks of default by the originator of the assets. In general, there are two main advantages of securitisation. First, it can turn ordinary illiquid assets into reasonably liquid instruments. Second, it can create instruments of high credit quality out of debt of low credit quality.
Securitisation is designed to offer a number of advantages to the seller, investor and the debt market. For the seller or originator, securitisation mainly results in receivables being replaced by cash, thereby improving the liquidity position. It removes the assets from the balance sheet of the originator, thus, freeing capital for other uses, and enabling restructuring of the balance sheet by reducing large exposures or sectoral concentration. It facilitates better asset liability management (ALM) by reducing market risks resulting from interest rate mismatches. The process also enables the issuer to recycle assets more frequently and thereby improves earnings. For investors, securitisation essentially provides an avenue for relatively lower risk investment. Credit enhancement provides an opportunity to investors to acquire good quality assets and to persify their portfolios. From the point of view of the financial system as a whole, securitisation increases the number of debt instruments in the market, and provides additional liquidity in the market. It also facilitates unbundling, better allocation and management of project risks. It widens the market by attracting new players due to availability of superior quality assets.
Securitisation, however, if not carried out prudently can leave risks with the originating bank without allocating capital to back them. The main risk for a bank arises if a true sale has not been achieved and the selling bank is forced to recognise some or all of the losses if the assets subsequently cease to perform. Also, funding risks and constraints on liquidity may arise if assets designed to be securitised have been originated, but because of disturbances in the market, the securities cannot be placed. There is also a view that there is at least a potential conflict of interest if bank originates, sells, services and underwrites the same issue of securities.
Reference:
BIS. 2006a. Quarterly Review, June.
4.33 The credit derivatives are gaining increasing popularity in many countries. Since the early 1990s, there has been proliferation of different types of credit derivatives in several countries (Box IV.5).
Box IV.4
Credit Information Bureaus
Credit bureaus (or credit reference agencies) are useful as they help lenders to assess credit worthiness of individual borrowers and their ability to pay back a loan. As credit bureaus collect and collate personal financial data on individuals from financial institutions, a form of price discrimination can be modelled taking into account credit rating and past behaviour of borrowers. The information is generally aggregated and made available on request to contributing companies for the purposes of credit assessment and credit scoring. Establishment of credit information bureaus can facilitate in obtaining the credit history of the borrowers and, thus, help the banks in correctly assessing the creditworthiness.
The CIBIL provides a vital service, which allows its members to make informed, objective and faster credit decisions. CIBIL’s aim is to fulfill the need of credit granting institutions for comprehensive credit information by collecting, collating and disseminating credit information pertaining to both commercial and consumer borrowers, to a closed user group of members. Banks, financial institutions, non-banking financial companies, housing finance companies and credit card companies use CIBIL’s services. Data sharing is based on the principle of reciprocity, which means that only members who have submitted all their credit data, may access Credit Information Reports from CIBIL.
With a view to strengthening the legal mechanism and facilitating credit information companies to collect, process and share credit information on borrowers of banks/FIs, a draft Credit Information Companies (Regulation) Bill was passed in May 2005 and notified in June 2005. The Government and the Reserve Bank have framed rules and regulations for implementation of the Act, with specific provisions for protecting individual borrower’s rights and obligations. The rules and regulations were notified on December 14, 2006. In terms of the provisions of the Act, after obtaining the certificate of registration from the Reserve Bank to commence/carry on business of credit information companies will be able to collect all types of credit information (positive as well as negative) from their member credit institutions and disseminate the same in the form of credit reports to the specified users/individuals.
4.34 The risk management architecture of banks in India has strengthened and they are on the way to becoming Basel II compliant, providing adequate comfort level for the introduction of credit derivatives. Accordingly, the Reserve Bank, as part of the gradual process of financial sector liberalisation in India, permitted banks and primary dealers to begin transacting in single-entity credit default swaps (CDS) in its Annual Policy Statement for 2007-08 released on April 24, 2007.
Box IV.5
Credit Derivatives
A credit derivative is a contract (derivative) to transfer the risk of the total return on a credit asset falling below an agreed level, without transfer of the underlying asset. This is usually achieved by transferring risk on a credit reference asset. Early forms of credit derivatives were financial guarantees. Three common forms of credit derivatives are credit default swap (CDS), total return swap (TRS) and credit linked note (CLN). Credit derivatives are designed to allow independent trading/hedging of credit risk. It is also possible to transfer and/or transform credit risk through securitisation. Credit derivative is a logical extension of two of the most significant developments in the financial markets, viz., securitisation and derivatives.
A CDS consists of swapping, usually on an ongoing basis, the risk premium inherent in an interest rate on a bond or a loan in return for a cash payment that is made in the event of default by the debtor. The CDS has become the main driver of the credit derivatives market, offering liquid price discovery and trading on which the rest of the market is based. It is an agreement between a protection buyer and a protection seller, whereby the buyer pays a periodic fee in return for a contingent payment by the seller upon a credit event happening in the reference entity. The contingent payment usually replicates the loss incurred by creditor of the reference entity in the event of its default. It covers only the credit risk embedded in the asset, risks arising from other factors, such as interest rate movements, remain with the buyer.
A TRS – also known as total rate of return swap – is a contract between two counterparties, whereby they swap periodic payments for the period of the contract. Typically, one party receives the total return (interest payments plus any capital gains or losses for the payment period) from a specified reference asset, while the other receives a specified fixed or floating cash flow that is not related to the creditworthiness of the reference asset, as with a vanilla interest rate swap. The payments are based upon the same notional amount. The reference asset may be any asset, index or basket of assets. The TRS is simply a mechanism that allows one party to derive the economic benefit of owning an asset without use of the balance sheet, and which allows the other to effectively 'buy protection' against loss in value due to ownership of a credit assets.
While the CDS provides protection against specific credit events, the total return swap protects against the loss of value irrespective of cause, whether default and widening of credit spreads, among others.
A CLN is an instrument whose cash flow depends upon a credit event, which can be a default, credit spread, or rating change. The definition of the relevant credit events must be negotiated by the parties to the note. A CLN, in effect, combines a credit-default swap with a regular note (with coupon, maturity, redemption). Given its regular-note features, a CLN is an on-balance sheet asset, unlike a CDS.
Banks and the financial institutions derive at least three main benefits from credit derivatives. One, credit derivatives allow banks to transfer credit risk and hence free up capital, which can be used for other productive purposes. Two, banks can conduct business on existing client relationships in excess of exposure norms and transfer away the risks. For instance, a bank which has hit its exposure limits with a client group may have to turn down a lucrative guarantee deal. However, with credit derivatives, the bank can take up the guarantee and maintain its exposure limits by transferring the credit risk on the guarantee or previous exposures. This allows bank to maintain client relationships. Three, banks can construct and manage a credit risk portfolio of their own choice and risk appetite unconstrained by funds, distribution and sales effort.
However, the use of credit derivatives also raises some concerns. One, some of the credit derivatives, which are being used, are at their infancy and need to mature. Introduction of such products, therefore, may be potentially destabilising. Two, the measurement and management of credit risk is much more complicated than market risk. Third, documentation risk is an important aspect of credit derivatives. Fourth, certain incentive issues arise with the use of credit derivatives. This is because such instruments typically change the underlying borrower-lender relationship and establish new relationships between lenders that become risk shedders and the new risk takers. This new relationship has the potential for market failure due, for instance, to asymmetric information.
Reference:
The Reserve Bank of India. 2003. Report of Working Group on Introduction of Credit Derivatives in India (Convenor: B. Mahapatra). Mumbai, March.
IMF. 2002. Monetary and Financial Statistics Manual.
Ueda Kazuo. 2003. ‘On Credit Risk Transfer Instruments and Central Banks’. 18th Annual General Meeting, Tokyo, April.
IV. TRENDS IN CREDIT – THE 1990s AND ONWARDS
Credit Trends – All Institutions
4.35 Total loans outstanding by all credit institutions (commercial banks, DFIs and cooperatives) combined together increased at a compound annual rate of 15.7 per cent during the 1990s and by 17.7 per cent per annum during the current decade so far (up to 2005-06). As percentage of GDP, loans outstanding increased from 34.2 per cent at end-March 1991 to 54.1 per cent at end-March 2006, suggesting increased credit penetration in the country (Table 4.1).
4.36 During the 1990s, the credit growth of commercial banks was lower than that of credit institutions in the co-operative sector. However, the trend has reversed during the current decade (up to 2005-06) with credit growth of commercial banks being significantly higher than the credit growth of the co-operative institutions. Credit growth of NBFCs during the first five years of the current decade was significantly lower than the growth of total credit by all institutions. Loans and advances by DFIs declined during the period from 2000-01 to 2005-06, essentially due to the conversions of two large DFIs into banks (Table 4.2).
4.37 Reflecting movements in growth rates, the share of commercial banks’ credit in total outstanding credit by all institutions increased significantly from 59.7 per cent at end-March 1991 to 78.2 per cent at end-March 2006. During the same period, the share of RRBs and SCARDBs also increased marginally. The share of all other credit institutions declined. Apart from aggressive retail lending strategies adopted by commercial banks, which captured some of the businesses of NBFCs, increased and persified lending into rural areas contributed to the rise in the share of commercial banks. Conversion of two DFIs into commercial banks also contributed to the increase in the share of commercial banks in the current decade and a sharp decline in the share of FIs (Table 4.3). In the case of co-operative institutions, which are financially weak and inadequately capitalised, reforms have been initiated very recently, which may help in reversing the declining share of co-operative institutions.
4.38 Since commercial banks account for more than three-fourths of total credit outstanding and detailed data on credit by other institutions are not readily available, analysis in the remaining part of the chapter is based largely on credit extended by scheduled commercial banks.
Table 4.1: Total Outstanding Credit by |
all Credit Institutions |
End-March |
Total Credit |
Annual |
Credit-GDP |
Outstanding |
Growth |
Ratio |
(Rs. crore) |
(Per cent) |
(Per cent) |
1 |
2 |
3 |
4 |
1991 |
1,94,654 |
– |
34.2 |
1995 |
3,47,125 |
22.7 |
34.3 |
2000 |
7,25,074 |
17.1 |
37.1 |
2001 |
7,94,125 |
9.5 |
37.8 |
2002 |
8,93,384 |
12.5 |
39.2 |
2003 |
10,77,409 |
20.6 |
43.8 |
2004 |
11,99,607 |
11.3 |
43.4 |
2005 |
14,81,587 |
23.5 |
47.4 |
2006 |
19,28,336 |
30.2 |
54.1 |
Compound Annual Growth Rate (Per cent) |
1991 to 2000 |
|
15.7 |
|
2000 to 2006 |
|
17.7 |
|
Note: 1. Data are provisional.
2. Data include commercial banks, RRBs, LABs, DFIs, UCBs, STCBs, CCBs,
PACSs, SCARDBs and PCARDBs.
3. In case of non-availability of data for select co-operatives, data for the previous year have been repeated.
Source : Report on Trend and Progress of Banking in India, various issues, Reserve Bank of India. |
Table 4.2: Institution-wise Growth of |
Outstanding Credit |
(Compound Annual Growth Rate) |
(Per cent) |
Category |
1991-92 to |
2000-01 to |
1999-2000 |
2005-06 |
1 |
|
2 |
3 |
1. |
Commercial Banks |
15.8 |
23.0 |
2. |
RRBs (and LABs) |
15.4 |
21.1 |
3. |
Financial Institutions |
14.2 |
-5.9 |
4. |
Urban Cooperative Banks |
21.4 |
7.3 |
5. |
State Cooperative Banks |
16.3 |
7.6 |
6. |
District Central Cooperative Banks |
16.0 |
10.3 |
7. |
Primary Agricultural Credit Societies |
17.9 |
9.3 |
8. |
SCARDBs |
27.0 |
7.5 |
9. |
PCARDBs |
15.9 |
9.1 |
All Institutions |
15.7 |
17.7 |
Note : Data are provisional.
Source : Report on Trend and Progress of Banking in India, variousissues, Reserve Bank of India. |
Table 4.3: Distribution of Credit – |
Category-wise Share |
(Per cent) |
Category |
End-March |
|
|
1991 |
2006 |
1 |
|
2 |
3 |
1. |
Commercial Banks |
59.7 |
78.2 |
2. |
RRBs (and LABs) |
1.8 |
2.1 |
3. |
All-India Financial Institutions |
24.9 |
5.8 |
4. |
Urban Co-operative Banks |
4.1 |
3.6 |
5. |
State Co-operative Banks |
3.4 |
2.1 |
6. |
District Central Co-operative Banks |
6.0 |
4.2 |
7. |
Primary Agricultural Credit Societies |
3.3 |
2.5 |
8. |
SCARDBs |
0.7 |
0.9 |
9. |
PCARDBs |
1.0 |
0.7 |
All Institutions |
100.0 |
100.0 |
Note : Data are provisional.
Source : Report on Trend and Progress of Banking in India, various issues, Reserve Bank of India. |
Trends in Scheduled Commercial Bank Credit
4.39 Bank credit, after witnessing an erratic pattern in the first half of the 1990s, showed a deceleration from 1996-97 to 2001-02, growing at an average annual rate of 15.1 per cent as compared with 19.5 per cent in the preceding four years (Chart IV.2). Several factors, both on the demand and the supply sides, contributed to the contraction of credit. On the supply side, introduction of prudential norms relating to income recognition, asset classification and provisioning in the mid-1990s made banks cautious. Application of norms revealed large gross NPAs with banks (15.7 per cent of their gross advances at end-March 1997). Banks, therefore, became wary of enlarging their loan portfolio. The relatively high level of NPAs, in particular, had a severe impact on weak banks. Banks’ capacity to extend credit was also impaired due to little headroom available in the capital adequacy ratio (8.7 per cent at end-March 1996). Banks found risk-adjusted returns on government securities more attractive. Hence, despite lowering of statutory preemption in the form of SLR, banks continued to invest in government securities, far in excess of the requirements. Banks’ investment in SLR securities at end-March 1996 was 36.9 per cent of net demand and time liabilities (NDTL) as against the statutory requirement of 31.5 per cent. Banks’ investments in SLR securities remained more or less at that level (36.7 per cent) by end-March 2002, even as the SLR was brought down significantly to 25 per cent.
4.40 On the demand side also, several factors contributed to the decline in demand for credit by the corporate sector. The industrial sector witnessed massive expansion in capacity in certain sectors, especially cement and steel, in the initial phase of reforms. However, as the quantitative restrictions were removed and import tariffs reduced, the corporate sector faced intense competition during the latter part of the 1990s. The focus of the corporate sector, thus, shifted from expanding capacity to restructuring and the industrial sector slowed down significantly. The average annual growth rate of industrial production was 5.2 per cent during 1996-97 to 2001-02 as compared with 9.4 per cent in the preceding three years. This affected the demand for credit by the corporate sector. Increased competition also forced corporates to restructure their balance sheets, whereby they increased their reliance on retained earnings and reduced their borrowings. This was evident from the debt-equity ratio, which declined from an average of 85.5 per cent during 1990-91 to 1994-95 to 65.2 per cent during 1995-96 to 1999-2000 (see Table 7.5 of Chapter VII).
4.41 Although the Reserve Bank pursued accommodative monetary policy during this period (1996-97 to 2001-02) by reducing the CRR and the policy rates, viz., the Bank Rate and the reverse repo rate (the then repo rate), credit offtake did not pick up. Downward stickiness of nominal interest rates on the one hand, and falling inflation rate on the other, led to a significant rise in real interest rates. The average real lending rates of banks increased to 12.5 per cent during 1996-97 to 2001-02 as against 6.5 per cent during 1990-91 to 1995-96 (Mohan, 2003). This also appeared to have contributed to slackness in credit expansion.
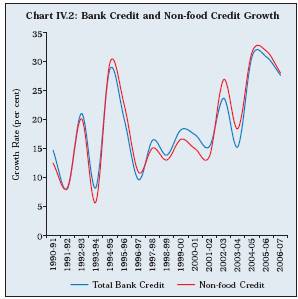
4.42 Credit growth accelerated in 2002-03 only to decelerate sharply in 2003-04 even when the industrial sector was buoyant due mainly to contraction in food credit and increased recourse by corporates to internal sources of financing and increased external commercial borrowings. During 2004-05 to 2006-07, bank credit expanded at a robust pace of around 30 per cent. Major factors that contributed to the acceleration in credit growth were pick-up in economic growth, improvement in asset quality of the credit institutions, moderation in inflation and inflation expectations, decline in real interest rates, rising income of households and increased competition with the entry of new private sector banks (as detailed in the subsequent sections). The removal of restrictions on retail credit and project finance by banks also created new sources of credit demand.
Sectoral Deployment of Credit
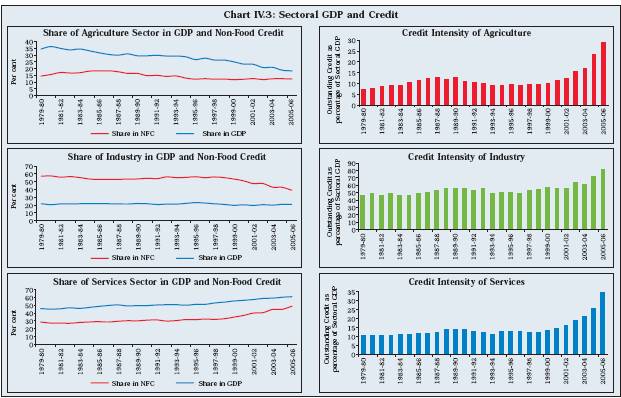
4.43 Reforms and the evolving economic structure had a profound impact on the flow of bank credit to various sectors of the economy during the 1990s and the current decade. Credit growth to agriculture during the 1990s slowed down to almost one-half as compared with the 1980s (Table 4.4). However, the trend was reversed beginning from 2002-03 as a result of concerted efforts made by the Reserve Bank and the Government to increase the flow of credit to agriculture. Credit to the industrial sector slowed down, albeit marginally, in the 1990s and the current decade as compared with the 1980s. A significant development during the current decade, however, has been the rapid credit expansion to the household sector (personal loans) in the form of housing and other retail loans.
Table 4.4: Sector-Wise Credit of Commercial Banks – Compound Annual Growth Rate |
(Per cent) |
Period |
Agriculture |
Industry |
Transport
Operators |
Professional
Services |
Personal
Loans |
Trade |
Finance |
Total Bank
Credit |
1 |
2 |
3 |
4 |
5 |
6 |
7 |
8 |
9 |
1980-81 to 1989-90 |
18.1 |
17.4 |
13.6 |
20.7 |
25.3 |
11.8 |
29.2 |
17.2 |
1990-91 to 1999-00 |
10.6 |
15.4 |
9.4 |
16.8 |
22.7 |
17.3 |
25.6 |
16.0 |
2000-01 to 2004-05 |
22.2 |
15.9 |
11.2 |
30.4 |
37.7 |
12.6 |
27.4 |
20.2 |
Memo: |
|
|
|
|
|
|
|
|
End-March |
|
|
|
|
|
|
|
|
2001 |
13.3 |
10.6 |
7.7 |
31.3 |
27.7 |
25.0 |
21.0 |
17.0 |
2002 |
23.7 |
14.9 |
7.1 |
44.0 |
25.1 |
12.7 |
42.2 |
21.8 |
2003 |
18.6 |
14.1 |
0.9 |
22.4 |
38.1 |
3.2 |
34.6 |
15.2 |
2004 |
26.7 |
8.1 |
18.7 |
29.5 |
57.2 |
-2.5 |
16.4 |
16.4 |
2005 |
29.2 |
33.5 |
22.8 |
25.8 |
42.9 |
27.8 |
24.3 |
30.9 |
Source: Basic Statistical Returns of Scheduled Commercial Banks, various issues, Reserve Bank of India. |
|
|
4.44 The share of agriculture and industrial sectors in total bank credit declined between end-March 1990 and end-March 2005, while that of personal loans and professional services increased sharply.
Agriculture
4.45 As a result of the sharp deceleration in the growth of credit to agriculture, the share of agriculture in total bank credit declined sharply from 15.9 per cent at end-March 1990 to 9.6 per cent by end-March 2001 (Table 4.5). During this period, however, the share of agriculture in GDP also declined significantly. As a result, credit intensity of the agriculture sector (credit to agriculture sector as percentage of sectoral GDP) remained broadly at the same level. In the early part of the current decade, the Government and the Reserve Bank took a series of measures to facilitate the flow of credit to the agriculture sector. These, inter alia, included: (i) rescheduling of short-term loans to medium and long-term loans, following agricultural distress in several parts of the country; (ii) higher targets fixed under the Special Agricultural Credit Plans of public sector banks and making it applicable to private sector banks also; and (iii) advising banks to double the flow of credit within three years starting from 2004-05. Credit growth to agriculture picked up significantly from 2003-04 onwards. The share of agricultural credit in total bank credit also increased to 10.8 per cent by end-March 2005. The gap between the share of agriculture credit in total bank credit and its share in GDP narrowed down to less than 8 percentage points at end-March 2006 from 17.4 per cent at end-March 1995. Furthermore, credit intensity of the agriculture sector increased sharply from 11.1 per cent in 2001-02 to 27.0 per cent by 2005-06 (Chart IV.3). The number of borrowal accounts in the agriculture sector also increased to 26.66 millions in 2004-05 from 19.84 millions in 2000-01.
Table 4.5: Distribution of Outstanding Credit of Scheduled Commercial Banks |
(Per cent to total credit) |
|
End-March |
Sector |
Mar-90 |
Mar-95 |
Mar-00 |
Mar-01 |
Mar-02 |
Mar-03 |
Mar-04 |
Mar-05 |
1 |
2 |
3 |
4 |
5 |
6 |
7 |
8 |
9 |
Agriculture |
15.9 |
11.8 |
9.9 |
9.6 |
9.8 |
10.0 |
10.9 |
10.8 |
Industry |
48.7 |
45.6 |
46.5 |
43.9 |
41.4 |
41.0 |
38.0 |
38.8 |
Transport |
3.2 |
1.9 |
1.8 |
1.6 |
1.4 |
1.2 |
1.3 |
1.2 |
Personal Loans and Professional Services |
9.4 |
11.3 |
14.4 |
15.8 |
16.8 |
19.6 |
25.3 |
27.0 |
of which: |
|
|
|
|
|
|
|
|
Loans for Purchase of Consumer Durables |
0.4 |
0.3 |
0.6 |
0.6 |
0.5 |
0.4 |
0.5 |
0.6 |
Loans for Housing |
2.4 |
2.8 |
4.0 |
4.7 |
5.0 |
6.5 |
9.7 |
11.0 |
Trade |
13.9 |
17.1 |
15.6 |
16.6 |
15.4 |
13.8 |
11.5 |
11.2 |
Financial Institutions |
2.1 |
3.8 |
4.8 |
4.9 |
5.7 |
6.7 |
6.7 |
6.4 |
Miscellaneous / All Others |
6.8 |
8.5 |
7.1 |
7.5 |
9.5 |
7.7 |
6.2 |
4.6 |
Total |
100.0 |
100.0 |
100.0 |
100.0 |
100.0 |
100.0 |
100.0 |
100.0 |
Source: Basic Statistical Returns of Scheduled Commercial Banks in India, various issues, Reserve Bank of India. |
Trends in Priority Sector Advances
4.46 Prior to the nationalisation of banks in 1969, banks’ lending was confined primarily to big business and trading in the metropolitan and urban centres. After the nationalisation of banks, the Government of India undertook corrective measures to rectify the lopsided lending by banks. Accordingly, in 1972, banks were advised to extend credit to certain activities, known as the priority sectors. With a view to aligning bank credit to the changing needs of society, the scope and definition of the priority sector have been continuously fined-tuned by including new items as also by enhancing credit limit of the constituent sub-sectors (Box IV.6).
Box IV.6
Policies Relating to the Priority Sector, Micro-finance and Credit Cards in Rural Areas
Priority Sector
• Domestic scheduled commercial banks and foreign banks are required to extend a minimum of 40 per cent and 32 per cent, respectively, of their net bank credit (NBC) to the priority sector with sub-targets set for lending to various sub-sectors.
• Major categories of priority sector credit include agriculture and allied activities, small scale industries, housing loans and education loans, among others.
• The scope of the priority sector has been expanded over the years to include export activity, education, housing, software industry, venture capital, leasing and hire purchase.
Micro-finance
• The SHG-bank linkage programme, launched in India in 1992 as a pilot project, envisages (i) rganizing the rural poor into Self-help Groups (SHGs); (ii) building their capacities to manage their own finances; and (iii) then negotiating bank credit on commercial terms.
• The target-group broadly comprises small and marginal farmers, landless agricultural and non-agricultural labourers, artisans and craftsmen, and other rural poor engaged in small businesses such as vending and hawking.
• There are two major models under micro-finance, namely, Self-Help Group-Bank Linkage (SHG-BL) and Micro-Finance Institutions (MFIs).
Kisan Credit Card
• The Kisan Credit Card (KCC) scheme, introduced in August 1998, enables farmers to purchase agricultural inputs and draw cash for their production needs.
• The Scheme was revised in November 2004 to cover term credit as well as working capital for agriculture and allied activities, in addition to short-term credit limits available separately for crop/s.
• Short-term credit/crop loans as well as working capital for agriculture and allied activities are repayable in 12 months, while term loans are repayable within a maximum period of 5 years, depending on the type of activity/investment.
• The Scheme is being implemented by all commercial banks, RRBs, state co-operative banks/DCCBs/PACS and scheduled primary co-operative banks.
General Credit Card
• The guidelines on general credit cards (GCC) were issued on December 27, 2005, with a view to providing easy credit to banks’ customers in rural areas.
• The objective of the GCC scheme is to provide hassle-free credit to the customers of banks based on the assessment of cash flow without insistence on security, purpose or end-use of the credit. This is in the nature of overdraft or cash-credit with no end-use stipulations.
• GCC may not necessarily be in the form of a card and can be issued in the form of a Pass Book, if the holder of GCC desires to operate cash withdrawals from bank branch.
• The credit facility extended under the scheme is in the nature of revolving credit. The GCC holder is entitled to draw cash up to the limit sanctioned from the specified branch of the bank.
• Banks have the flexibility to fix the limit on GCC based on the assessment of income and cash flow of the entire household. However, total credit facility under GCC for an individual should not exceed Rs.25,000 and interest rate on the facility may be charged, as considered appropriate and reasonable.
• Banks may utilise the services of local post offices, schools, primary health centers, local government functionaries, farmers’ association/club, well-established community-based agencies and civil society organisations for sourcing of borrowers for issuing GCC.
• To incentivise the banks to issue GCC, fifty per cent of credit outstanding under GCC, up to Rs.25,000, is eligible for being treated as indirect agricultural financing for the purpose of priority sector target.
4.47 Credit growth to the priority sector showed a distinct improvement in recent years growing at an average annual rate of 25.7 per cent during the period from 2000-01 to 2005-06 as compared with 13.1 per cent during the 1990s. This was mainly due to increased lending to cer tain sectors such as agriculture and housing. Despite this increase, priority sector advances declined from 40.1 per cent of non food gross bank credit (NFGBC) at end-March 1990 to 36.3 per cent by end-March 2006 (Table 4.6). With higher credit growth during 2004-05 and 2005-06 by both public and private sector banks, the priority sector credit target of 40.0 per cent of net bank credit (NBC) was achieved by end-March 2006.
4.48 Within the priority sector, credit to agriculture, which grew at an average annual rate of 11.2 per cent during the 1990s, accelerated to 25.7 per cent during the six-year period ended March 2006. Despite this increase, the share of agriculture in total priority sector advances declined from 40.9 per cent at end-March 1990 to 33.8 per cent at end-March 2006 (Table 4.6). The share of agricultural loans as per cent of NBC of public sector banks was at 15.3 per cent at end-March 2005 and 15.2 per cent at end-March 2006. The agriculture loans as per cent of NBC of private sector banks at 13.5 per cent each at end-March 2005 and 2006 were, much, lower than the stipulated target of 18 per cent. Some banks, especially new private sector banks and foreign banks, lack adequate branch network in rural areas as a result of which some of these banks find it difficult to achieve their priority sector credit targets. To address the problem, banks were asked to make deposits, to the extent of shortfall, in the Rural Infrastructure Development Fund (RIDF) of the National Bank for Agriculture and Rural Development (NABARD) for achieving the lending target. Foreign banks are required to make deposits in the Small Industries Development Bank of India (SIDBI).
4.49 For increasing the flow of credit to agriculture and other rural sectors of the economy, several innovative measures were initiated in the form of Self-Help Group (SHG) - Bank Linkage programme and Kisan Credit Card (KCC) schemes. Micro-finance is now increasingly being recognised as a cost effective and sustainable way of expanding outreach of the banking sector to the rural poor. The relative absence of interest subsidies, the high repayment performance and reduced transaction costs to lenders are some of the major advantages of micro-finance. There is now a growing realisation among the lending agencies that micro-finance programmes are bankable, creditworthy and profitable. Banks are now discovering that people at the bottom of the pyramid can be brought into their business models.
4.50 The SHG-Bank Linkage programme is one of the two models of micro-finance. The flow of credit to the rural sector is hampered for two reasons. One, credit is largely collateral based, and two, loan delinquencies are generally higher. Formation of joint liability groups in the form of SHGs helps in overcoming both these problems. The responsibility for repayment of the loan is borne jointly by all the members of SHGs, who are engaged in some economic activity that generates the income needed for the repayment. Experience of SHGs in countries such as Bangladesh also shows that loan delinquency is lower in the case of SHGs due to peer pressure. The main advantages of the program are on-time repayment of loans to banks; reduction in transaction costs for both, the poor and the banks; door-step savings and credit facilities available to the poor; and exploitation of the untapped business potential in rural India.
Table 4.6: Trends in Outstanding Priority Sector Advances |
(Amount in Rs. crore) |
|
Total Priority Sector Advances |
Agriculture Advances |
SSI Advances |
End-March |
Amount |
Annual
Growth
(Per cent) |
Per cent of
NFGBC |
Amount |
Annual Growth
(Per cent) |
Per cent of
NFGBC |
Amount |
Annual
Growth
(Per cent) |
Per cent of
NFGBC |
1 |
2 |
3 |
4 |
5 |
6 |
7 |
8 |
9 |
10 |
1990 |
40,383 |
18.0 |
40.1 |
16,526 |
18.5 |
16.4 |
15,543 |
18.3 |
15.4 |
1991 |
42,915 |
6.3 |
37.8 |
16,750 |
1.4 |
14.8 |
17,181 |
10.5 |
15.1 |
1992 |
45,425 |
5.8 |
37.4 |
18.157 |
8.4 |
15.0 |
18,150 |
5.6 |
15.0 |
1993 |
49,832 |
9.7 |
35.5 |
19,963 |
9.9 |
14.2 |
20,026 |
10.3 |
14.3 |
1994 |
53,880 |
8.1 |
36.9 |
21,208 |
6.2 |
14.5 |
22,617 |
12.9 |
15.5 |
1995 |
64,161 |
19.1 |
34.7 |
23,983 |
13.1 |
13.0 |
27,638 |
22.2 |
15.0 |
1996 |
73,329 |
14.3 |
33.0 |
27,044 |
12.8 |
12.2 |
31,884 |
15.4 |
14.4 |
1997 |
84,880 |
15.8 |
33.8 |
31,442 |
16.3 |
12.5 |
35,944 |
12.7 |
14.3 |
1998 |
99,507 |
17.2 |
34.6 |
34,869 |
10.9 |
12.1 |
43,508 |
21.0 |
15.1 |
1999 |
1,14,611 |
15.2 |
35.2 |
39,634 |
13.7 |
12.2 |
48,483 |
11.4 |
14.9 |
2000 |
1,31,827 |
15.0 |
35.1 |
44,381 |
12.0 |
11.8 |
52,814 |
8.9 |
14.1 |
2001 |
1,54,414 |
17.1 |
36.0 |
51,922 |
17.0 |
12.1 |
56,002 |
6.0 |
13.0 |
2002 |
1,75,259 |
13.5 |
36.3 |
60,761 |
17.0 |
12.6 |
57,199 |
2.1 |
11.8 |
2003 |
2,11,609 |
20.7 |
34.1 |
73,518 |
21.0 |
11.9 |
60,394 |
5.6 |
9.7 |
2004 |
2,63,834 |
24.7 |
36.2 |
90,541 |
23.2 |
12.4 |
65,855 |
9.0 |
9.0 |
2005 |
3,81,476 |
44.6 |
38.2 |
1,25,250 |
38.3 |
12.5 |
74,588 |
13.3 |
7.5 |
2006 |
5,09,910 |
33.7 |
36.3 |
1,72,292 |
37.6 |
12.3 |
90,239 |
21.0 |
6.4 |
Average Annual Growth (Per cent) |
1990 to 2000 |
|
13.1 |
|
|
11.2 |
|
|
13.6 |
|
2001 to 2006 |
|
25.7 |
|
|
25.7 |
|
|
9.5 |
|
NFGBC: Non Food Gross Bank Credit.
Source: Handbook of Statistics on the Indian Economy, 2005-06, Reserve Bank of India. |
4.51 The Self-Help Group (SHG)-Bank Linkage programme has emerged as an important model of micro-finance activity in the country (see Box IV.5). As at end-March 2006, 2.2 million SHGs were linked to banks with cumulative bank loans amounting to Rs.11,398 crore (Table 4.7). The share of commercial banks in financing SHGs has increased over the years. The number of families assisted has increased by about five-fold from 5 million in 2001 to 24 million in 2005. Further, the average bank loan per SHG increased from Rs.18,227 in 2001 to Rs.32,012 in 2005.
4.52 The SHG-Bank Linkage programme, which till now has been concentrated largely in the Southern States, is expected to gain further ground with the NABARD taking up a programme for intensification of these activities in 13 identified States, accounting for 70.0 per cent of the rural poor population.
4.53 Although various types of products were available for providing credit to farmers, they lacked flexibility in terms of amount needed for day to day requirements and its timely availability. In order to meet the liquidity requirement of farmers in a flexible manner, the Kisan Credit Card (KCC) scheme was introduced in August 1998 to enable the farmers to purchase agricultural inputs and draw cash for their production needs. At the inception of the scheme, it was envisaged that investment credit requirements of farmers, viz, allied and non-farm activities would also be covered under the scheme. Since these activities were outside the ambit of the KCC scheme as announced in 1998, farmers had to approach the banks separately for their additional requirements, entailing additional time and cost, and observing banks’ procedural formalities, including documentation. Therefore, revised KCC guidelines were issued in November 2004. The revised scheme aims at providing adequate and timely credit for the comprehensive credit requirements of farmers under a single window, with flexible and simplified procedures, adopting whole farm approach, including the short-term credit needs and a reasonable component for consumption needs (see Box IV.5).
Table 4.7: Progress of SHG-Bank |
Linkage Programme |
Year |
Total SHGs financed |
Bank Loans |
by banks (Nos. 000) |
(Rs. crore) |
During the Year |
Cumula- tive |
During the Year |
Cumula- tive |
Cumulative as Per Cent of
Total Bank Credit |
1 |
2 |
3 |
4 |
5 |
6 |
1992-99 |
33 |
33 |
57 |
57 |
0.02 |
1999-00 |
82 |
115 |
136 |
193 |
0.04 |
2000-01 |
149 |
264 |
288 |
481 |
0.09 |
2001-02 |
198 |
461 |
545 |
1,026 |
0.17 |
2002-03 |
256 |
717 |
1,022 |
2,049 |
0.28 |
2003-04 |
362 |
1,079 |
1,856 |
3,904 |
0.46 |
2004-05 |
539 |
1,618 |
2,994 |
6,898 |
0.63 |
2005-06 |
620 |
2,239 |
4,499 |
11,398 |
0.76 |
Source: NABARD and RBI. |
Table 4.8: Progress of Kisan Credit Cards Scheme |
(Numbers in Million; Amount in Rupees Crore) |
Year |
Co-operative Banks |
RRBs |
Commercial Banks |
Total |
|
No. |
Amount* |
Share in |
No. |
Amount* |
Share in |
No. |
Amount* |
Share in |
No. |
Amount* |
Share in |
|
|
|
Total Loans |
|
|
Total |
|
|
Loans |
|
|
Aggregate |
|
|
|
Outstanding
(Per cent) |
|
|
Loans Outstanding
(Per cent) |
|
|
Outstanding to Agriculture
(Per cent) |
|
|
Loans Outstanding#
(Per cent) |
1 |
2 |
3 |
4 |
5 |
6 |
7 |
8 |
9 |
10 |
11 |
12 |
13 |
1998-99 |
0.16 |
826 |
0.9 |
0.01 |
11 |
0.1 |
0.62 |
1,473 |
3.6 |
0.78 |
2,310 |
1.6 |
1999-00 |
3.60 |
3,606 |
3.1 |
0.17 |
405 |
3.2 |
1.37 |
3,537 |
7.2 |
5.13 |
7,548 |
4.2 |
2000-01 |
5.61 |
9,412 |
6.9 |
0.65 |
1,400 |
9.2 |
2.39 |
5,615 |
9.5 |
8.65 |
16,427 |
7.8 |
2001-02 |
5.44 |
15,952 |
10.4 |
0.83 |
2,382 |
13.2 |
3.07 |
7,524 |
11.6 |
9.34 |
25,858 |
10.9 |
2002-03 |
4.58 |
15,841 |
8.3 |
0.96 |
2,955 |
13.8 |
2.70 |
7,481 |
9.3 |
8.24 |
26,277 |
9.0 |
2003-04 |
4.88 |
9,855 |
4.1 |
1.27 |
2,599 |
10.2 |
3.09 |
9,331 |
9.4 |
9.25 |
21,785 |
5.9 |
2004-05 |
3.56 |
15,597 |
6.1 |
1.73 |
3,833 |
11.6 |
4.40 |
14,756 |
11.2 |
9.68 |
34,186 |
8.1 |
2005-06 |
2.60 |
20,339 |
7.5 |
1.25 |
8,483 |
21.3 |
4.16 |
18,779 |
9.8 |
8.01 |
47,601 |
9.5 |
Total @ |
30.41 |
91,428 |
– |
6.88 |
22,068 |
– |
21.80 |
68,496 |
– |
59.09 |
1,81,992 |
– |
*: Amount sanctioned.
@ : Total represents aggregate number of cards issued and amounts sanctioned since 1998-99.
# : Aggregate loans outstanding include total loans of co-operatives, RRBs and agricultural loans of commercial banks.
Source: NABARD and RBI. |
4.54 The KCC scheme has since stabilised. The cumulative number of KCCs issued by commercial banks, RRBs and co-operatives was at 59 million at end-March 2006 and the cumulative amount sanctioned was Rs.1,81,992 crore. While the number of KCCs issued by commercial banks increased in recent years, those issued by co-operative banks and RRBs declined. The share of co-operative banks in the cumulative number of KCCs issued was 51.5 per cent, followed by commercial banks (36.9 per cent) and RRBs (11.6 per cent). The amount sanctioned as per cent of total outstanding loans was at 21.3 per cent in case of RRBs and 7.5 per cent in case of cooperatives. Amount sanctioned by commercial banks as per cent of the total loans outstanding to agriculture was 9.8 per cent at end-March 2006 (Table 4.8). 4.55 Another important segment of the priority sector is the small scale industries (SSIs) sector. An analysis of credit flow to this sector is provided in the subsequent section.
Industry
4.56 The credit extended to the industrial sector decelerated marginally in the 1990s (16.4 per cent) and the current decade so far (15.8 per cent) in comparison with the 1980s (16.7 per cent) (see Table 4.4). The share of industry in total bank credit declined sharply from 48.0 per cent at end-June 1990 to 38.8 per cent at end-March 2005 (see Table 4.5).
4.57 Banks’ support to the industrial sector in the form of non-traditional instruments such as commercial paper, shares/bonds/ debentures issued by corporates, which increased sharply in the second half of the 1990s, also declined/decelerated beginning with 2001-02 (Table 4.9).
4.58 Deceleration in the financial support by banks to industry, despite the robust performance of the industrial sector during last few years, was mainly due to their increased reliance on retained earnings and increased access to the domestic and international capital markets. Creditworthy corporates also resor ted to large external commercial borrowings (Table 4.10).
4.59 As a result of reduced reliance of industry on bank credit, the gap between the share of the industrial sector in total non-food credit and its share in GDP narrowed down significantly. The industrial sector accounted for 54.3 per cent of bank credit as against its share of 22.0 per cent in GDP in 1990-91. By 2005-06, however, the share of the industrial sector in non-food credit declined sharply to 39.1 per cent, even as its share in GDP declined marginally to 20.8 per cent. This was reflected in increased credit intensity of industry, which was already significantly higher than the other sectors.
Table 4.9: Non-SLR Investments of Scheduled |
Commercial Banks |
End- |
Share in Total Non-SLR |
Total Non-SLR |
March |
Investments (Per cent) |
Investments |
|
CP |
Shares |
Bonds/ |
Amount |
Annual |
Share |
|
|
|
Deben- |
(Rs. |
Growth |
in Total |
|
|
|
tures |
crore) |
(Per |
Assets of |
|
|
|
|
|
cent) |
Banks |
|
|
|
|
|
|
(Per cent) |
1 |
2 |
3 |
4 |
5 |
6 |
7 |
1998 |
7.5 |
7.1 |
85.4 |
32,461 |
74.8 |
5.4 |
1999 |
8.3 |
8.1 |
83.7 |
48,376 |
49.0 |
6.9 |
2000 |
8.2 |
7.8 |
84.0 |
61,408 |
26.9 |
7.3 |
2001 |
10.6 |
7.5 |
81.9 |
75,844 |
22.9 |
7.6 |
2002 |
10.5 |
7.3 |
82.2 |
80,999 |
6.8 |
7.1 |
2003 |
4.3 |
9.7 |
86.0 |
92,854 |
14.6 |
6.6 |
2004 |
4.2 |
9.7 |
86.0 |
88,985 |
-4.2 |
5.4 |
2005 |
4.2 |
12.7 |
83.1 |
93,664 |
5.3 |
4.7 |
2006 |
6.1 |
16.1 |
77.9 |
79,464 |
-15.2 |
3.4 |
2007 |
11.0 |
22.0 |
67.0 |
83,466 |
5.0 |
2.9 |
Note : Data based on last reporting Friday of the financial year. Data exclude banks’ investments in instruments of financial institutions and mutual funds.
Source : Reserve Bank of India. |
Table 4.10: Non-Bank Sources of Funds for Industry |
(Rs. crore) |
Year |
Capital |
ADR/GDR |
External |
Issue of |
Financial |
Retained |
Depreciation |
|
Issues * |
Issues + |
Commercial |
CPs # |
Assistance |
Earnings ** |
Provision ** |
|
|
|
Borrowings $ |
|
by FIs (net) |
|
|
1 |
2 |
3 |
4 |
5 |
6 |
7 |
8 |
1997-98 |
2,171 |
– |
14,028 |
854 |
– |
6,873 |
11,312 |
1998-99 |
2,484 |
– |
-2,504 |
3,270 |
– |
4,517 |
12,944 |
1999-00 |
2,350 |
2,144 |
2,993 |
893 |
– |
4,678 |
14,710 |
2000-01 |
2,505 |
3,433 |
-3,182 |
183 |
9,084 |
5,186 |
15,759 |
2001-02 |
1,951 |
1,528 |
-11,308 |
1,378 |
-3,469 |
2,584 |
17,451 |
2002-03 |
642 |
3,426 |
-3,593 |
-1,475 |
-5,672 |
8,288 |
18,306 |
2003-04 |
2,422 |
3,098 |
16,098 |
3,382 |
2,723 |
15,645 |
20,408 |
2004-05 |
10,456 |
2,960 |
41,106 |
5,104 |
7,885 |
28,384 |
22,697 |
2005-06 |
13,781 |
7,262 |
45,078 |
-1,517 |
8,687 |
48,402@ |
28,883 |
*: Gross issuances excluding issues by banks and financial institutions. Figures are not adjusted for banks’
investments in capital issues.
+: Including Global Depository Receipts (GDRs)/American Depository Receipts (ADRs) and Foreign Currency
Convertible Bonds (FCCBs), excluding issuances by banks and financial institutions.
$: Including short-term credit and adjusted for redemption of RIBs and IMDs.
#: Excluding issuances by financial institutions and banks’ investments in CPs.
@: Estimate; taken as 71.7 per cent of profits after tax, the same proportion as was observed for select
companies in 2004-05.
**: Based on select non-government, non-financial public limited companies.
–: Not available.
Note : Data are provisional.
Source : Reserve Bank of India. |
Credit intensity of industry rose despite the slowdown of credit to the SSI sector as explained subsequently. In this context, two important developments need to be noted. One, during this period two major DFIs conver ted into banks which, at the time of conversion, had a huge portfolio of loans and advances. Although a portion of those loans might have been repaid, given the typical five to seven year maturity of their loans, it is believed that the converted entities might still be carrying a sizeable portion of those loans in their books. Two, banks now, apart from extending working capital finance, also extend medium and long-term finance, including for infrastructure projects. The share of medium and long-term credit to industry in total credit by banks to the industrial sector increased sharply from 17.5 per cent at end-March 1995 to 47.6 per cent by end-March 2005 (Table 4.11).
Table 4.11: Type of Credit to Industry By Banks |
(Rs. crore) |
End-
March |
Short-Term Loans* |
Medium-Term Loans |
Long-Term Loans |
Total
Credit |
Amount |
Share in Total
Credit (Per cent) |
Amount |
Share in Total
Credit(Per cent) |
Amount |
Share in Total
Credit (Per cent) |
1 |
2 |
3 |
4 |
5 |
6 |
7 |
8 |
1995 |
77,134 |
82.5 |
5,438 |
5.8 |
10,874 |
11.6 |
93,446 |
1996 |
97,809 |
81.7 |
6,620 |
5.5 |
15,273 |
12.8 |
1,19,702 |
1997 |
1,09,666 |
79.6 |
8,136 |
5.9 |
19,987 |
14.5 |
1,37,789 |
1998 |
1,23,408 |
78.0 |
10,578 |
6.7 |
24,261 |
15.3 |
1,58,247 |
1999 |
1,36,488 |
76.1 |
10,660 |
5.9 |
32,150 |
17.9 |
1,79,298 |
2000 |
1,52,369 |
74.3 |
13,928 |
6.8 |
38,777 |
18.9 |
2,05,074 |
2001 |
1,70,114 |
74.8 |
16,067 |
7.1 |
41,341 |
18.2 |
2,27,522 |
2002 |
1,65,828 |
63.0 |
22,313 |
8.5 |
74,910 |
28.5 |
2,63,051 |
2003 |
1,79,687 |
59.5 |
22,366 |
7.4 |
99,853 |
33.1 |
3,01,906 |
2004 |
1,89,918 |
57.9 |
32,187 |
9.8 |
1,06,084 |
32.3 |
3,28,189 |
2005 |
2,29,672 |
52.4 |
46,535 |
10.6 |
1,62,296 |
37.0 |
4,38,503 |
* : Short-term credit includes cash credit, overdraft, demand loans, packing credit, export trade bills purchased and discounted,
export trade bills advanced against, advances against export cash incentives and duty drawback claims, inland bills purchased and discounted (trade and others), advances against import bills, foreign currency cheques, TCs/DDs/TTs/MTs purchased.
Source: Basic Statistical Returns of Scheduled Commercial Banks in India, various issues, Reserve Bank of India. |
Table 4.12: Bank Credit to the Infrastructure Sector |
(Rs. crore) |
|
End-March |
Sector |
1998 |
1999 |
2000 |
2001 |
2002 |
2003 |
2004 |
2005 |
2006 |
1 |
2 |
3 |
4 |
5 |
6 |
7 |
8 |
9 |
10 |
Infrastructure |
3,163 |
5,941 |
7,243 |
11,349 |
14,809 |
26,297 |
37,224 |
79,009 |
1,08,787 |
|
|
(87.8) |
(21.9) |
(56.7) |
(30.5) |
(77.6) |
(41.6) |
(112.3) |
(37.7) |
of which: |
|
|
|
|
|
|
|
|
|
Power |
697 |
2,109 |
3,289 |
5,246 |
7,373 |
15,042 |
19,655 |
38,744 |
57,863 |
Telecommunication |
2,045 |
2,273 |
1,992 |
3,644 |
3,972 |
5,779 |
8,408 |
15,794 |
17,713 |
Roads and Ports |
421 |
1,559 |
1,962 |
2,459 |
3,464 |
5,476 |
9,161 |
14,472 |
18,975 |
Note: 1. Figures in parentheses are annual growth rates.
2. Data relate to select SCBs, which account for around 90 per cent of the bank credit extended by all scheduled commercial banks.
Source: Handbook of Statistics on the Indian Economy, 2005-06, Reserve Bank of India. |
4.60 A part of the increase in medium and long-term credit to industry in recent years emanated from increased credit to the infrastructure sector (Table 4.12). 4.61 Short-term credit intensity of the industrial sector, which had risen sharply between 1997-98 and 2000-01, declined significantly thereafter (Chart IV.4). This mainly reflected the impact of two factors, viz., increased access of the domestic and the international capital markets and increase in the retained earnings of the corporate sector resulting from increased profitability.
4.62 As a result of sharp increase in medium and long-term credit, the share of short-term credit in overall credit has declined. Within short-term credit, the share of cash credit has declined sharply (Chart IV.5).
Several factors appear to have contributed to this trend. One, corporates in recent years raised large resources through issuance of commercial paper (CP) and ECBs. Two, corporates have also become cash rich due to their improved profitability in recent years. Banks have traditionally extended credit to the industry largely in the form of cash credit limits and overdraft. This system, however, places the onus of cash management on banks rather than on the corporates. Hence, the shift in favour of demand loans in recent years is a healthy development. For working capital limit of Rs.10 crore and above, however, ‘loan system’ was introduced in April 1995. The percentage of loan component was gradually
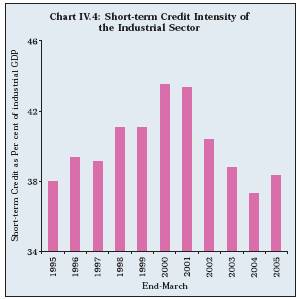
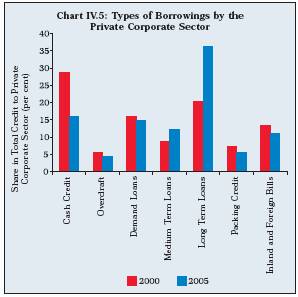
liberalised in October 2001 with banks having freedom to decide the cash credit and loan component for working capital.
Credit to the Small Scale Industries Sector
4.63 The small scale industries (SSI) sector is an important segment of the Indian economy. However, credit flow to the small scale industries sector decelerated in recent years as is evident from various indicators. First, the average annual growth of SSI advances decelerated to 9.5 per cent during 2001-2006 from 13.6 per cent during the 1990s. Second, the share of the SSI sector in total priority sector advances declined steadily from 44 per cent at end-March 1998 to 18 per cent at end-March 2006. Third, the share of credit to the SSI sector in NBC declined from 15.7 per cent at end-March 1990 to 8.6 per cent at end-March 2004. SSI advances by public sector banks were 8.1 per cent of net bank credit at end-March 2006 as compared with 9.5 per cent at end-March 2005. In the case of private sector banks, SSI advances accounted for 4.2 per cent of NBC at end-March 2006 as compared with 5.4 per cent at end-March 2005. Fourth, although credit growth to the SSI sector accelerated in 2004-05 and 2005-06, the share of SSI credit in total non-food gross bank credit and in total credit to the industrial sector continued to decline (Chart IV.6). Fifth, the number of loan accounts of the SSI sector in commercial banks declined from 219 million in 1992 to 93 million in 2005.
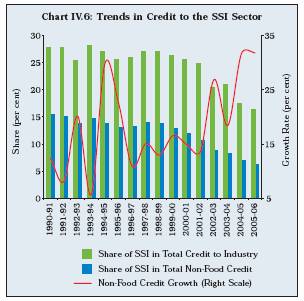
4.64 The main reason for slowdown of credit to the SSI sector was its poor performance and consequent risk aversion by banks (Table 4.13). The activity of the SSI sector slowed down significantly between 1997-98 and 2002-03 with the value of production growing at an average annual rate of 7.7 per cent as compared with 11.1 per cent in the 1980s.
4.65 The poor performance of the SSI sector was also reflected in the significantly higher level of NPAs in this sector (Table 4.14). Banks, therefore, became somewhat risk-averse and they reduced their exposure to the SSI sector.
4.66 In recent years (i.e., from 2003-04 to 2005-06), the performance of the SSI sector has improved. Accordingly, NPAs in the SSI sector have also declined significantly. This was reflected in the improved flow of credit to the SSI sector in 2004-05 and 2005-06 (see Table 4.6). As a result, the credit intensity of the SSI sector, after declining almost consistently between 1997-98 and 2004-05, increased somewhat in 2005-06 (Chart IV.7).
4.67 The credit to the SSI sector, to an extent, does not give a true picture as different banks appeared to have followed different definitions of the SSI sector. The definition of small and medium enterprises has now been clearly laid down in the Micro, Small and Medium Enterprises Act, 2006. Therefore, it is expected that there would be an improvement in the data reporting and the proper assessment of credit to the SME sector.
Given the significance of the small and medium enterprises, several measures have also been taken by the Reserve Bank to enhance the flow of credit to the SME sector (Box IV.7). These measures, together with decline in NPAs in recent years, are expected to have a significant impact on the flow of credit to the SMEs sector in the coming years.
Table 4.13: Performance of the SSI Sector – |
Major Parameters |
Item |
1990-91 |
2000-01 |
2005-06 |
1 |
2 |
3 |
4 |
1. |
No. of Units (‘000) |
6,790 |
10,110 |
12,340 |
2. |
Value of Production at |
|
|
|
|
1993-94 Prices (Rs. crore) |
84,728 |
1,84,401 |
2,75,581 |
3. |
Employment (‘000) |
15,830 |
23,870 |
29,490 |
4. |
Exports (Rs. crore) |
9,664 |
69,797 |
97,644 * |
5. |
Share of SSI exports |
|
|
|
|
in Total Exports (Per cent) |
29.7 |
34.3 |
33.3 * |
Memo: |
Average Annual Growth |
Rate (Per cent) |
1980-81 |
1990-91 |
2000-01 |
to |
to |
to |
1989-90 |
1999-00 |
2005-06 |
1. |
Value of Production at |
|
|
|
|
1993-94 Prices |
11.1 |
1.8 |
8.4 |
2. |
Employment |
6.0 |
7.0 |
4.3 |
3. |
Exports |
20.9 |
22.3 |
16.3 |
* : Relates to 2003-04.
Source: Handbook of Statistics on the Indian Economy, 2005-06, Reserve Bank of India. |
Table 4.14: Gross NPAs of Scheduled Commercial |
Banks in the SSI Sector |
End-March |
SSI Sector* |
All Sectors** |
1 |
2 |
3 |
2001 |
20.3 |
11.4 |
2002 |
20.7 |
10.4 |
2003 |
19.0 |
8.8 |
2004 |
14.9 |
7.2 |
2005 |
11.6 |
5.2 |
2006 |
8.4 |
3.3 |
* : Gross NPAs as percentage of gross advances to the SSI sector.
**: Gross NPAs as per cent of gross advances to all sectors.
Note: Data are provisional.
Source: Off-site Returns, Reserve Bank of India. |
Services
4.68 While credit extended by commercial banks to all the sub-sectors in the services sector accelerated in the current decade (up to 2005-06) as compared with the 1990s, the acceleration was more pronounced in the case of personal loans and professional services. The share of the services sector in total bank credit increased sharply from 30.9 per cent in 1990-91 to 48.7 per cent in 2005-06, essentially reflecting its growing share in total GDP; the services sector contributed 60.7 per cent of GDP in 2005-06 as against 46.7 per cent in 1990-91. Credit intensity of the services sector increased from 14.9 per cent in 1990 to 15.2 per cent in 2001 and further to 36.5 per cent in 2006 (see Chart IV.4). Faster credit growth to the services sector was mainly on account of a sharp rise in credit demand from the household sector, a trend which started in the 1990s and gathered further momentum in the current decade.

Box IV.7
Credit Flow to Small Scale and Medium Industries – Recent Measures
The SSI sector depends primarily on finance from banks and other financial institutions. Several measures have been initiated in recent years with a view to increasing the flow of credit to SSI units. These include refining the definition of small scale and tiny enterprises; broadening the scope for indirect finance to these industries; making investments in several avenues such as securitised assets, lines of credit, bills-discounting, leasing and hire purchase eligible for priority sector advances; and modification of targets for priority sector lending to SSIs. Besides, in pursuance of the recommendations made by several working groups and high powered committees appointed by the Central Government and the Reserve Bank, a set of comprehensive guidelines to be followed for advances to all categories of borrowers in the SSI sector has been evolved.
Based on the recommendations of the Working Group on Flow of Credit to the SSI Sector (Chairman: Dr. A.S. Ganguly), the Reserve Bank (2004) advised banks, inter alia, (i) to identify new clusters and adopt cluster-based approach for financing the small and medium enterprises (SME) sector; (ii) widely publicise the successful working models of NGOs; (iii) sanction higher working capital limits to SSIs in the North-Eastern region for maintaining higher levels of inventory; and (iv) explore new instruments for promoting rural industry.
The Reserve Bank advised all public sector banks on August 19, 2005 to align their flow of credit to small and medium enterprises in line with the package announced by the Hon’ble Finance Minister. These measures, inter alia, include : (i) units with investment in plant and machinery in excess of SSI limit and up to Rs.10 crore may be treated as medium enterprises (ME) (only SSI financing will be included in the priority sector); (ii) banks may fix self-targets for financing the SME sector so as to reflect a higher disbursement over the immediately preceding year, while the sub-targets for financing tiny units and smaller units to the extent of 40 per cent and 20 per cent, respectively, may continue; and (iii) banks may initiate necessary steps to rationalise the cost of loans to the SME sector by adopting a transparent rating system with cost of credit being linked to the credit rating of an enterprise.
Emergence of Household Credit
4.69 Until the early 1990s, there were several restrictions for granting of personal loans. For instance, in the case of housing loans, the restrictions were in the form of (i) limits on total amount of housing loan to be given by all the banks in a given year; (ii) limits on maximum loan amount to individuals; (iii) prescription of rate of interest according to loan size; (iv) prescription of margin requirement; and (v) prescription of maximum period of repayment. All these conditions/restrictions were gradually removed in the early 1990s and banks were given freedom to decide the quantum, rate of interest, margin requirement, repayment period and other related conditions. These relaxations had a positive impact on the growth of personal loans.
4.70 Household or personal loans, on an average, registered a rise of 38.2 per cent during the five-year period ended March 2005 as compared with 25.2 per cent in the 1990s; overall bank credit during this period increased by 20.3 per cent. Consequently, the share of personal loans in total bank credit increased from 9.4 per cent at end-March 1990 to 14.4 per cent in 2000 and further to 22.2 per cent at end-March 2005 (Table 4.15). Latest available data reveal that the share of personal loans increased further to 25.2 per cent of non-food gross bank credit at end-March 2006.
4.71 The number of personal loan accounts also increased sharply from 1995 (Chart IV.8).
4.72 Within personal loans, housing loans accounted for a little over one half of total loans, distantly followed by advances made against fixed deposits with a share of around 10.0 per cent (Table 4.16).
4.73 Housing loans grew at an average annual rate of 47.7 per cent during the five year period from 2000-01 to 2004-05. The average housing loan amount increased almost four times between end-March 2000 and end-March 2005. At end-March 2005, the average housing loan outstanding per account at Rs.3.45 lakh, which was more than two times the average amount in respect of all types of accounts of commercial banks (Table 4.17).
4.74 The share of housing loans increased steadily from 2.7 per cent of total loans of commercial banks at end-March 1991 to 11.0 per cent at end-March 2005 (Chart IV.9).
4.75 The share of personal loans in total credit extended by respective bank group at end-March 2000 was highest in respect of foreign banks and lowest in respect of private banks. In recent years, however, private sector banks became very aggressive in the retail loan segment. As a result, by end-March 2005, the share of personal loans in total credit extended by private banks and foreign banks reached almost at the same level (Chart IV.10).
Table 4.15: Growth and Share of Personal |
Loans in Total Bank Credit |
(Per cent) |
End- March |
Annual Growth of Total Bank Credit |
Annual Growth of Personal Loans |
Share of Personal Loans in Total Bank Credit |
1 |
2 |
3 |
4 |
2001 |
17.0 |
27.7 |
12.2 |
2002 |
21.8 |
25.1 |
12.6 |
2003 |
15.2 |
38.1 |
15.1 |
2004 |
16.4 |
57.2 |
20.3 |
2005 |
30.9 |
42.9 |
22.2 |
Average (2001 to 2005) |
20.3 |
38.2 |
16.5 |
Source: Basic Statistical Returns of Scheduled Commercial Banks
in India, various issues, Reserve Bank of India. |
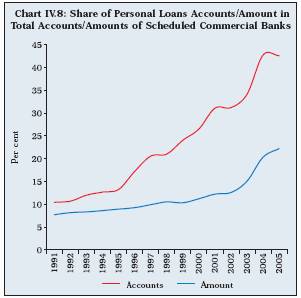
Table 4.16: Composition of Household Credit |
Provided by Commercial Banks |
(Per cent) |
Category |
Share in Total |
Annual Growth |
Personal Loans |
during 2005-06 |
end-March |
end-March |
|
2005 |
2006 |
|
1 |
2 |
3 |
4 |
i) |
Housing Loans |
52.5 |
52.7 |
44.8 |
ii) |
Advances Against |
|
|
|
|
Fixed Deposits |
12.2 |
9.9 |
16.9 |
iii) |
Credit Cards Outstanding |
2.4 |
2.6 |
59.3 |
iv) |
Education |
2.1 |
2.8 |
96.5 |
v) |
Loans for Purchase of |
|
|
|
|
Consumer Durables |
3.7 |
2.5 |
-3.3 |
vi) |
Others |
27.2 |
29.5 |
57.0 |
|
|
|
|
|
Total (i to vi) |
100.0 |
100.0 |
44.4 |
Source: Annual Report, 2005-06, Reserve Bank of India. |
Table 4.17: Trends in Housing Loans Provided |
by Commercial Banks |
(Per cent) |
Year |
Annual Growth of Housing Loans |
Share of Housing Loans in Total Personal Loans |
Average amount per Housing Loan Account
(Rs.)* |
Average amount of all Loan Accounts(Rs.)* |
1 |
2 |
3 |
4 |
5 |
2000-2001 |
37.2 |
38.5 |
1,02,354 |
1,02,825 |
2001-2002 |
29.2 |
39.8 |
1,80,728 |
1,16,336 |
2002-2003 |
49.5 |
43.1 |
2,00,594 |
1,27,073 |
2003-2004 |
73.9 |
47.7 |
2,81,205 |
1,32,597 |
2004-2005 |
48.6 |
49.5 |
3,45,830 |
1,49,378 |
Average |
47.7 |
43.7 |
2,22,142 |
1,25,642 |
(2000-01 to 2005-06) |
|
|
|
*: As at end of March.
Source : Basic Statistical Returns of Scheduled Commercial Banks
in India, various issues, Reserve Bank of India. |
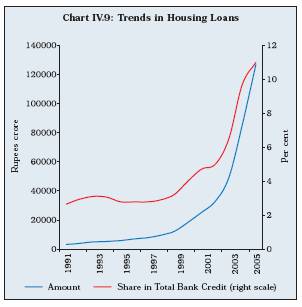
4.76 The sharp increase in bank credit to the household sector has been contributed by several factors. First, the demand for credit by the industrial sector slowed down, especially between 1996-97 and 2001-02, due to their focus on restructuring and consolidation, as alluded to earlier. This encouraged banks to focus on retail loans. High level of NPAs, in particular, might have encouraged banks to focus increasingly on retail portfolio. From the banks’
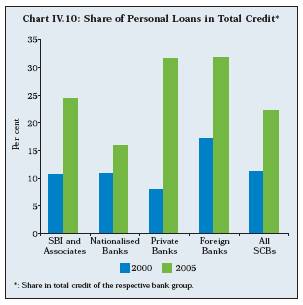
viewpoint, the retail and mortgage loans, being small, do not involve much exposure to a single borrower. As a result, the average risk associated with retail loans is lower as they are spread across persified customers provided banks do not dilute the credit appraisal standards in an enthusiasm to increase lending to this sector. Also, in the case of mortgage loans, there is adequate collateral structure, particularly for housing and auto loans. It is easier to determine the realistic sale value of housing, unlike commercial property in the case of corporate loans. Second, with high economic growth, job opportunities have expanded and income levels have risen. Tax rates have also moderated over the years. As a result, disposable incomes have risen sharply in recent years. This has increased the capacity of the borrowers to repay the loans. Third, with the decline in inflation and stable inflationary expectations, the inflation risk premium fell resulting in decline in both nominal and real interest rates. This encouraged the households to avail credit for various purposes such as purchase of houses, automobiles and consumer durable items. Fourth, increase in real estate prices as also the stock market might have also boosted the household demand for bank credit due to wealth effect, although exposure of Indian households to the equity market, at present, is limited.
4.77 The rapid growth in the housing market, in particular, has been supported, inter alia, by the emergence of a number of second tier cities as upcoming business centres and increase in IT and IT-related activities, which have had a positive impact on household’s demand for housing. Further, tax incentives offered to salary earners made housing loans more attractive by bringing down the effective rate of interest. Also, comfortable liquidity position with banks, which created easy credit conditions, encouraged them to look to new clients and emerged as another significant factor that drove the growth of the housing market in India in recent years.
4.78 The phenomenon of rapid credit expansion to the household sector, however, is not confined to India alone as household borrowing has grown sharply in many other countries, especially emerging market economies, since the 1980s, both in absolute terms and relative to household incomes (Box IV.8). 4.79 In view of rapid credit expansion, the Reserve Bank in April 2006 indicated that growth of non-food bank credit, including investments in bonds/ debentures/shares of public sector undertakings and private corporate sector and commercial paper, will be calibrated to decelerate to around 20 per cent during 2006-07 from a growth of above 30 per cent. Besides, the Reserve Bank initiated several prudential policy measures (Box IV.9).
4.80 As a result of the increased share of medium and long-term credit to industry and to the household sector for housing loans, the share of medium and long-term loans in total credit increased sharply in recent years (Chart IV.11).
Financing of Credit Growth
4.81 Banks in India have traditionally relied on deposits for funding their credit expansion. With rapid growth in credit in the recent period, incremental credit-deposit ratio exceeded 100 per cent in 2004-05, before sliding marginally below 100 per cent in 2005-06 (Chart IV.12).
4.82 In order to sustain large credit expansion since 2004-05, banks resorted to large non-deposit resources in the form of (i) capital and reserves; (ii) overseas foreign currency borrowings; and (iii) call/ term funding from financial institutions. During 2005-06, banks liquidated large excess investments to the tune of Rs.1,09,834 crore in SLR securities. Non-deposit sources and liquidation of securities together financed 34.7 per cent of incremental credit in 2004-05 and 45.7 per cent in 2005-06 (Table 4.18).
4.83 As a result of liquidation of securities for funding credit expansion in the recent years, the share of credit in total assets of scheduled commercial banks increased sharply, while that of investment declined (Chart IV.13).
4.84 A distinct feature of banks’ operations in the last 10 years has been flexible adjustment of the investment portfolio in line with the changing credit demand. As credit demand slowed down in the second half of the 1990s, banks remained invested in SLR securities, even when SLR was brought down significantly. However, as credit demand picked up, banks liquidated SLR investments (2004-05 and 2005-06). Liquidation of holdings on the one hand, and the expansion of net demand and time liabilities on the other, have brought down the holding of SLR securities very close to the statutory limit of 25 per cent (Chart IV.14).
Factors behind Rapid Credit Expansion
4.85 Apart from the specific factors alluded to earlier, several other factors, such as increased financial deepening, increased competition, improvement in asset quality of banks and rapid product innovations, have also contributed to the rapid credit expansion in recent years.
Box IV.8
Household Credit Market – International Experience
In the recent period, a significant development in credit markets all over the world has been the rapid growth of credit availed of by the households, often outstripping that of corporate credit. While banks have been expanding their retail business through increased mortgage and credit card lending, households have been eager to finance their consumption and residential investment through bank credit (Mohanty, et al, 2006). While the household credit market has already developed in the mature market economies (MME), it is only recently that the household credit market has started developing in emerging market economies (EME).
Lower inflation and interest rates, higher income levels, higher asset prices (particularly housing), financial liberalisation, reduced corporate demand for credit and increased presence of retail lending-oriented foreign banks, were the main factors that contributed to the growth of the household credit market in various countries (IMF, 2006). The demand for bank credit and also household credit is highly pro-cyclical. Boost to households’ current incomes, at the back of strong economic growth, coupled with expectations about future income has boosted the demand for household credit. With the decline in inflation and its stability over the medium term, inflation expectations as well as the inflation risk premium have fallen, thus, bringing down both nominal and real interest rates. This has attracted potential home owners to the mortgage market. Rapid increase in real estate prices, which increases expectations about future returns, has also been a key factor in boosting the demand for household credit. In developed countries, the increase in the value of residential property in recent years was even higher than the increase in the value of global shares. The removal of restrictions on bank lending to housing and consumer sectors has also facilitated higher credit flow as latent demand was eventually materialised. On the supply side, the changes in banks’ capacity and willingness to lend facilitated expansion in household credit. Improvement in creditors’ rights and improvement in information sharing among lenders eased the supply-led credit constraints (Mohanty, et al 2006).
A comparison of the nature of the household credit market in various regions in the world reveals some interesting trends. Despite sharp credit growth in recent years, the penetration rates for consumer credit, housing loans and use of credit cards, in emerging market economies, in general, are much lower than in mature market economies. Among the emerging economies, household credit as a percentage of GDP was highest in Asia, followed by emerging Europe and Latin America (Table A).
In emerging Europe, a significant share of household credit is denominated in foreign currency. However, in Asia it is almost entirely denominated in local currency. Banks, particularly foreign banks, are the largest providers of household credit, including housing loans in the emerging markets followed by Government sponsored lending institutions, non-bank financial companies and, to a lesser extent, the informal sector. There is a view that household borrowings can continue to grow at a fast rate in many emerging economies as they have a higher debt absorption capacity (Mohanty, et al, 2006). The level of indebtedness of households, as revealed by the ratio of household credit to personal disposable income, is substantially lower in emerging market countries than mature market economies (Table B).
International experience reveals that while sound development of the household credit market as such is beneficial for borrowers, lenders, the financial system and the economy as a whole, the pace of household credit expansion should be consistent with the underlying macroeconomic, prudential and institutional framework to avoid the likely adverse impact of bust of credit boom. Policy support required for the healthy development of this segment of the credit market should, inter alia, include: (i) prudential regulation like appropriate risk weighting, capital adequacy, classification and provisioning of loans; (ii) legal environment for enabling securitisation, effective enforcement of collateral, provision and sharing of credit information, promotion of rating agencies and credit bureaus and transparency in lending, consumer protection and consumer education; (iii) improvement in the availability of data to monitor and assess the build-up of credit, household debt and net worth and asset prices; (iv) maintenance of adequate reserves by the country as well as the lending institution, if households carry large interest and exchange rate exposures; and (v) formulation of adequate contingency plans in the event of large interest and exchange rate movements.
Table A: Cross-country Trends in Household Credit – 2005 |
(Per cent) |
Item |
Emerg- |
Emerg- |
Latin |
Mature |
All |
India* |
ing |
ing |
America |
Markets |
Count- |
|
Europe |
Asia |
|
|
ries |
|
1 |
2 |
3 |
4 |
5 |
6 |
7 |
i) |
Household credit as |
|
|
|
|
|
|
|
percentage to GDP |
12.1 |
27.5 |
9.2 |
58.0 |
29.2 |
9.9 |
ii) |
Share of household credit in |
|
|
|
|
|
|
total private sector credit |
38.9 |
31.4 |
35.7 |
41.5 |
37.5 |
24.5 |
iii) Share of housing loans in |
|
|
|
|
|
|
|
total household credit |
27.9 |
54.2 |
37.5 |
77.5 |
52.9 |
52.7 |
*: Data pertain to 2005-06.
Source : International Monetary Fund (2006) and Reserve Bank of India. |
Table B: Ratio of Household Credit to Personal Disposable Income |
(Per cent) |
Item |
2000 |
2001 |
2002 |
2003 |
2004 |
2005 |
1 |
2 |
3 |
4 |
5 |
6 |
7 |
Emerging Markets |
|
|
|
|
|
|
Hungary |
11.2 |
14.4 |
20.9 |
29.5 |
33.9 |
39.3 |
Poland |
10.1 |
10.3 |
10.9 |
12.6 |
14.5 |
18.2 |
Korea |
33.0 |
43.9 |
57.3 |
62.6 |
64.5 |
68.9 |
Philippines |
1.7 |
4.6 |
5.5 |
5.5 |
5.6 |
.. |
Thailand |
26.0 |
25.6 |
28.6 |
34.3 |
36.4 |
.. |
Mature Markets |
|
|
|
|
|
|
Australia |
83.3 |
86.7 |
95.6 |
109.0 |
119.0 |
124.6 |
France |
57.8 |
57.5 |
58.2 |
59.8 |
64.2 |
69.2 |
Germany |
70.4 |
70.1 |
69.1 |
70.3 |
70.5 |
70.0 |
Japan |
73.6 |
75.7 |
77.6 |
77.3 |
77.9 |
77.8 |
Spain |
65.2 |
70.4 |
76.9 |
86.4 |
98.8 |
112.7 |
United States |
104.0 |
105.1 |
110.8 |
118.2 |
126.0 |
132.7 |
Source: IMF (2006). |
References: IMF. 2006. Global Financial Stability Report, September.
Mohanty, M.S., Gert Schnabel, and Pablo Gracia-Luna. 2006.
“Banks and Aggregate Credit: What is New?” BIS Papers
No.28, BIS, August.
Box IV.9
Rapid Increase in Credit – Prudential Measures
The general provisioning requirement on standard advances in specific sectors, i.e., personal loans, loans and advances qualifying as capital market exposures, residential housing loans beyond Rs.20 lakh and commercial real estate loans were increased from 0.40 per cent to one per cent in April 2006 and further to two per cent on January 31, 2007. Further, the risk weight on exposures on commercial real estate was increased from 125 per cent to 150 per cent. Banks’ total exposure to venture capital funds was included as a part of their capital market exposure and they were required to assign a risk weight of 150 per cent to such exposures.
The Reserve Bank used prudential measures in combination with increase in the policy rates. Keeping in view the persistent growth of credit to the retail sector and also keeping in view the general inflationary conditions, the repo rate was increased by 175 basis points in stages to 7.75 per cent by April 14, 2007 from its lowest level of 6.0 per cent in September 2004. Further, the CRR was raised by 200 basis points in stages from 4.5 per cent in September 2004 to 6.5 per cent. The Reserve Bank increased the provisioning requirement for banks’ exposure in the standard asset category to systemically important NBFCs to two per cent from the earlier level of 0.4 per cent. Further, risk weight for banks’ exposure to such NBFCs was increased to 125 per cent from the existing level of 100 per cent. Banks were prohibited from granting fresh loans in excess of Rs.20 lakh against the NR(E)RA and FCNR(B) deposits, either to depositors or to third parties.
4.86 The rapid credit expansion, to an extent, reflects increased financial deepening as a result of deregulation. The credit-GDP ratio in India has been low in comparison with other advanced and emerging market economies and is now moving up with the increase in credit penetration (Chart IV.15).
4.87 With the entry of new private sector banks in the credit market, competition among banks has intensified, which is reflected in the increase in the share of new private sector banks (about 15 per cent in both total bank credit and assets at end-March 2006). Increased competition has led to narrowing of margins. In order to make up for squeeze in margins, banks have tended to increase credit volumes by aggressively marketing their products to upcoming services and the household sector.
4.88 One of the major reasons for slowdown in credit in the second half of the 1990s was large NPAs, which impaired banks ability to extend credit. However, as a result of various reform measures, there has been significant improvement in the asset quality over the years, partly as a result of expansion of loan volumes and partly on account of write-offs and recovery of past dues (Chart IV.16).
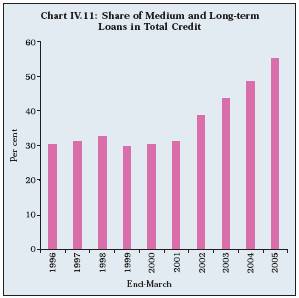
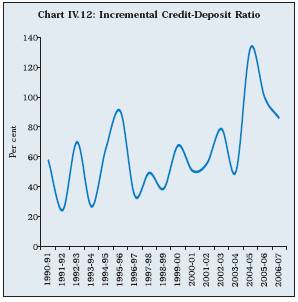
Table 4.18: Non-Deposit Sources of Funds |
(Amount in Rs. crore) |
|
Non-Deposit Sources of Funds |
Funds from Unwinding of Investments |
Year |
Overseas Foreign Currency Borrowings |
Accretion to Capital and Reserves |
Call/Term Funding from Financial Institutions |
Total Non- deposit sources of Funds |
Non- Deposit Resources as a proportion to incremental Bank Credit (per cent) |
Offloading of Excess SLR Investments |
Offloading of non- SLR Investments |
Total Offloading of SLR and non- SLR Investments |
Liquidation of Investments as a proportion to incremental Bank Credit
(per cent) |
1 |
2 |
3 |
4 |
5 (2 to 4) |
6 |
7 |
8 |
9 (7+8) |
10 |
2000-01 |
-369 |
6,878 |
-168 |
6,341 |
8.4 |
-21,129 |
-14,436 |
-35,565 |
-47.1 |
2001-02 |
-88 |
8,807 |
463 |
9,182 |
11.7 |
-33,557 |
-5,155 |
-38,712 |
-49.4 |
2002-03 |
5,963 |
15,511 |
9,609 |
31,083 |
22.3 |
-54,740 |
-11,855 |
-66,595 |
-47.7 |
2003-04 |
9,784 |
16,723 |
12,032 |
38,539 |
34.5 |
-72,868 |
3,869 |
-68,999 |
-61.8 |
2004-05 |
8,529 |
29,134 |
44,853 |
82,516 |
31.8 |
12,196 |
-4,679 |
7,517 |
2.9 |
2005-06 |
4,168 |
44,039 |
13,621 |
61,828 |
15.2 |
1,09,834 |
14,200 |
1,24,034 |
30.5 |
2006-07 |
2,543 |
22,431 |
3,007 |
27,981 |
6.7 |
59,569 |
-4,002 |
55,567 |
13.4 |
Note : (-) in columns 7-10 denotes net purchase of securities.
Source: Reserve Bank of India. |
4.89 Incremental NPAs during last five years remained in the range of Rs.20,000-26,000 crore. As credit has expanded rapidly, incremental NPAs as percentage of incremental bank credit, which were as high as 31.7 per cent in 2001-02, declined to 5.3 per cent in 2005-06 (Chart IV.17). A sharp decline in incremental NPAs also reflects significant improvement in credit appraisal, improved risk management and better resource allocation process. This has encouraged banks to enlarge their lending operations.
4.90 One of the major reasons for rapid credit expansion, especially to the agriculture and the household sectors has been innovative tailor-made products introduced by banks in recent years. Until the early 1990s, banks’ operations were subject to general restrictions and they were offering plain vanilla type of credit products such as short-term, medium-term and long-term loans to their customers. However, with increased freedom to decide interest rates and relaxations in deployment of funds, banks started introducing innovative products to suit the needs of the borrowers as well as to enable them to mitigate the risks faced by the corporates. The range of loan products offered by banks has widened considerably in recent years, especially in the case of personal loan segment.
4.91 Apart from introducing new loan products, banks have also added frills and features to the existing loan products to serve the needs of all segments of the economy, both in rural and in urban areas. Loan products have not only been customised to suit to the specific requirements of borrowers, but also their repayment capacity and convenience.
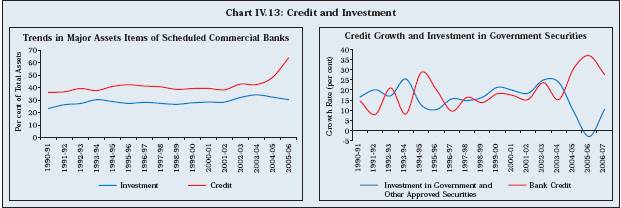

4.92 Banks are now also offering credit to agriculture with greater vigour for activities such as leased land cultivation, agri-clinics, land development and reclamation, irrigation projects, forestry, construction of cold storages and godowns, processing of agri-products, agri-input dealers, allied activities such as dairy, fisheries, poultry, sheep-goat, piggery, rearing of silk worms, among others. Likewise, in the industrial sector, besides extending working capital finance and overdraft facilities, banks are now increasingly also providing project finance in the form of term loans. For the small and medium enterprise sector, banks offer loan products such as open term loans, flexi loans and general purpose term loans. Banks have also been increasing their exposure to the infrastructure sectors such as road and urban infrastructure, power and utilities, oil and gas, other natural resources, ports and airports, telecommunications, among others.
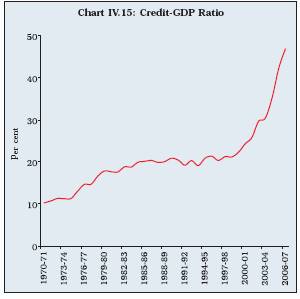
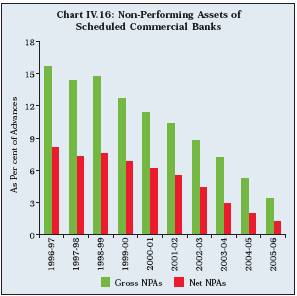
4.93 Product innovations have been the most significant in the personal loan segment. Housing loans are offered with several frills such as free personal accident insurance, eligibility for other personal loans, 100 per cent funding (in the case of select projects), fixed or floating interest rates or part fixed and part floating. Housing loans are now given for home improvement, home extension, land purchase, among others. Clean personal loans (some banks call it as express loans) are offered for any personal purposes such as renovation of house, marriage, holiday, children’s education, purchase of computers and for meeting medical expenses. Besides, loans are also given against gold collaterals. Special loans are offered to professionals such as doctors, engineers, teachers and nurses. Some banks have come out with specific loan products for education. Credit cards and education loans have emerged as other important categories of personal loan segment.
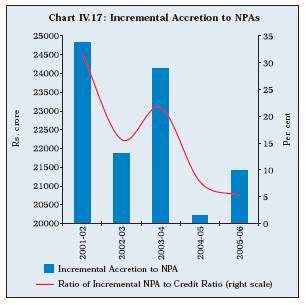
The Recent Phase of Rapid Credit Growth – Is there a Structural Break?
4.94 Non-food credit of scheduled commercial banks, after remaining subdued for several years, started accelerating from 2002-03 onwards. The average annual growth of non-food credit during the five-year period from 2002-03 to 2006-07 was 24.9 per cent as against the average growth of 15.4 per cent during the 1990s. Credit growth, in real terms, also witnessed a sharp expansion (Table 4.19).
4.95 The expansion in non-food credit during the recent years was significantly higher than the growth of the real economy. This was reflected in the sharp increase in total bank credit to GDP ratio, which increased from 25.9 per cent in 2001-02 to 42.2 per cent by 2005-06 (see Chart IV.15).
4.96 Analysis of data suggests that nature of credit growth from May 2002 has been structurally at variance from the historical trends3. There are alternative views focusing on demand or supply side factors to explain this phenomenon in emerging economies. To ascertain these aspects in the Indian context, empirical analysis was carried out for the pre and post-break period. It suggests that while lendable deposits, output gap and interest rate influenced credit
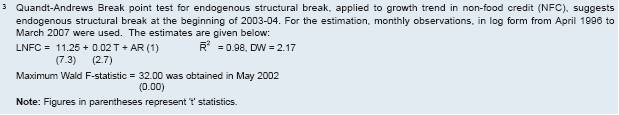
Table 4.19: Trends in Credit Growth |
(Per cent) |
Period/Year |
Non-Food Credit
(Nominal) |
Non-Food Credit
(Real) |
1 |
2 |
|
3 |
|
Average Annual Growth |
1970-71 to 1979-80 |
17.4 |
|
8.5 |
1980-81 to 1989-90 |
17.8 |
|
9.8 |
1990-91 to 1999-00 |
15.4 |
|
7.3 |
2000-01 to 2006-07 |
21.8 |
|
16.7 |
Memo: |
Annual Growth |
2000-01 |
14.9 |
|
7.7 |
2001-02 |
13.6 |
|
10.0 |
2002-03 |
18.6 |
|
15.2 |
2003-04 |
18.4 |
|
12.9 |
2004-05 |
27.5 |
|
21.0 |
2005-06 |
31.8 |
|
27.4 |
2006-07 |
28.0 |
|
22.6 |
Note: Data are adjusted for mergers and conversion during 2002-03
and 2004-05, respectively, while for the presence of 27 fortnights during 2005-06.
Real non-food credit has been obtained by deflating nominal non-food credit by annual
average growth of wholesale price index (WPI).
Source: Handbook of Statistics on the Indian Economy 2005-06, Reserve Bank of India. |
expansion in the pre-break period, lendable deposits and output gap together with asset prices emerged as the key determinants of rapid credit growth in the post-break period (Box IV.10).
4.97 As seen above, in addition to structural factors, credit expansion was also pro-cyclical in nature, which indicates that strong income growth recorded in recent years has also significantly contributed to credit growth. This characteristic of credit could also be inferred from comparison of the cyclical component in credit vis-à-vis that of GDP (Chart IV.18).
4.98 The cyclical nature of credit is a phenomenon which is common to several other emerging economies as bank credit to the private sector and output are closely related (Mohanty et al, 2006). Apart from the factors indicated above, acceleration in credit could also be reflective of ‘crowding in’ of private spending by the recent moderation in fiscal deficit of both the Central and State governments.
Box IV.10
Determinants of Bank Credit
Until the early 1990s, deposit rates, lending rates and allocation of resources to different sectors were largely regulated. The scenario changed thereafter with the implementation of prudential norms and freeing of interest rates and removal of other restrictions on banking operations. These developments enhanced the sensitivity of bank operations to asset quality and oriented them to operate on the basis of their commercial judgment.
In this backdrop and the cross country experience about the determinants of credit expansion, an empirical exercise estimating relationship between non-food credit (NFC), lendable deposits (LD), level of NPAs, output gap (OG), commercial paper yield (CPRATE) and asset prices (represented by BSE SENSEX), index of house rentals (HPI) was conducted for the period from April 1996 to March 2006. As there was a structural break in the relationship in April 2003, the separate estimations were also done for the period prior and subsequent to the break. Output gap has been estimated by de-trending the output series using HP-filter. HPI is drawn from consumer price index for industrial workers. Lendable deposits are aggregate deposits net of reserve requirement. CP yield in place of BPLR has been used as interest rate variable as predominant proportion of total bank credit is extended below BPLR. It could reasonably be assumed that effective lending rate would have proximity to the CP rate, which is market determined. Equations have been estimated in difference form. Estimated equation and plot of actual and estimated values (Chart A) are set out below:
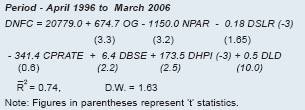
The results indicate that availability of lendable resources, followed by level of NPA and asset prices are the major determinants of credit expansion. Moreover, credit is positively related to the output gap, indicating the pro-cyclical nature of credit growth. In order to have a better insight into the dynamics of the relationship over the period, separate estimations were attempted for the period prior and subsequent to the structural break. Estimated equations and the plots of actual and estimated values (Chart B and C) are set out below:
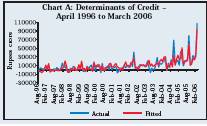
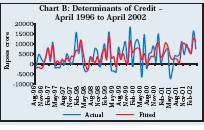
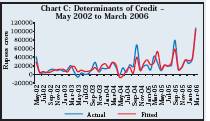
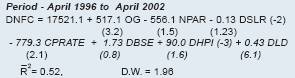
Regression estimates for the period April 1996 to March 2003 indicate that availability of lendable resources, interest rate and level of NPAs are important determinants of credit expansion. Apart from these, credit also responds positively to surplus output gap. Importantly, asset prices did not play any significant role till March 2003 in credit expansion.
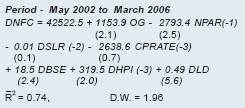
Lag structure of the explanatory variables was determined through general to specific procedure beginning with 6 lags for all the variables. Insignificant lags were omitted in stages.
Empirical results for the subsequent period, i.e., May 2002 to March 2006 show that besides lendable resources and level of NPAs, asset prices emerged as the major determinant of credit expansion. During this period, output gap continued to be significant but lost its explanatory power. Interest rate was not significant determinant of credit growth, suggesting that asset prices and consequent wealth effect overshadowed the cost as the determinants of credit demand.
Gain in the significance of NPA level during the period allays the apprehensions that with booming asset prices and consequent rise in net worth of individuals might have impaired the sensitivity of banks towards asset quality. Though the SLR holding of the banks had the expected sign in both the periods, it was not statistically significant, implying that banks hold government securities on their on volition and it is not a constraint for credit expansion.
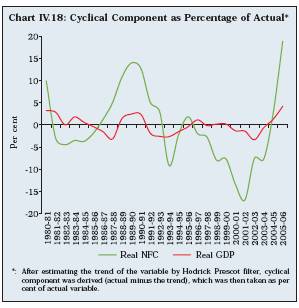 Determinants as observed above are also indicative of the credit channels of monetary policy. Significance of the NPA level suggests the growing sensitivity of banks to asset quality and this probably indicates the significance of the balance sheet route of credit channel. Similarly, significance of lendable deposits suggests that the monetary authority could affect lending capacity of the banks. This, in turn, suggests that the bank lending route of credit channel is also possibly operative in the Indian economy.
Rapid Credit Growth – Implications
4.99 Rapid credit expansion could be indicative of financial deepening as well as cyclical upturn caused by business cycle representing improvement in investment opportunity. However, excessive cyclical fluctuations caused by over-optimism about future earnings could be potentially destabilising. International experience indicates that an excessive credit expansion may be unsustainable. Over-optimism about future earnings could boost asset valuations, which artificially enhance the net worth of firms and their capacity to borrow and spend. Since performance cannot match the over-optimistic expectation, the process becomes unsustainable beyond a point. Lending booms can lead to vulnerability of the banking system (Box IV.11).
Monetary Policy Response to Rapid Credit Expansion – International Experiences
4.100 While there is no consensus with regard to what the policy response should be to the rapid credit expansion, the dominant view seems to indicate that generalised policy tightening could be counter-productive and the appropriate response should be to strengthen the financial system by adopting suitable prudential and supervisory norms (Box IV.12). A menu of policy options are available including prudential and supervisory measures to manage key risks arising out of rapid credit growth (Annex I and Annex II).
The Indian scenario
4.101 Although credit in India has expanded rapidly, a detailed sector-wise analysis shows that its spread is quite broad-based across all the sectors. In fact, credit to agriculture has picked-up, which is a healthy development and the result of conscious policy efforts. Credit to small scale industry has also picked up during last two years, which is again a welcome sign. Credit to industry, on the whole, has decelerated somewhat.
4.102 However, credit to the household sector has grown rather rapidly. In this context, it needs to be noted that credit to the private sector, on the whole, in India is low in comparison with many other countries (Table 4.20). Besides, credit penetration in India is also low in comparison with several emerging market economies. In terms of number of loan accounts per 100 persons, India was placed lower than several other emerging market economies (Table 4.21). The number of credit accounts of scheduled commercial banks in 2005 as per cent of adult population was only 9.5 per cent in rural areas and 14.2 per cent in urban areas. Further, only around one-third of the rural households and one-half of the urban households had credit accounts with commercial banks in 2005. While the overall credit penetration was higher in urban areas, small loan accounts (with credit limit of less than Rs.25,000) are concentrated largely in rural areas (61.6 per cent in 2005) (Table 4.22).
4.103 Credit penetration in India has not only been low, it is also unevenly spread across different regions (Table 4.23). Thus, large credit expansion, to an extent, reflects increasing financial deepening.
4.104 Furthermore, according to the latest National Sample Survey Organisation (NSSO) survey, the household indebtedness in 2002 was only 26.5 per cent in rural areas and still lower at 17.8 per cent in urban areas (Table 4.24).
4.105 Moreover, the extent of financial leverage of the households, as revealed by the debt-asset ratio, in India was very low at 2.84 per cent in rural areas and 2.82 per cent in urban areas in 2002 (Table 4.25). Though this ratio might have gone up in the subsequent years, as personal loans have increased significantly, it is still expected to be much lower than many other emerging countries, especially when income levels in India have also risen sharply in recent years.
Box IV.11
Credit Boom: Analytical Issues
Analytically, credit can grow rapidly for three reasons, viz., (i) financial deepening (trend); (ii) normal cyclical upturns (credit expansion); and (iii) excessive cyclical movements (credit booms) (IMF, 2004). When an economy develops, credit generally grows faster than GDP - a process known as financial deepening, reflecting the growing importance of financial intermediation. Temporarily, credit can also expand more rapidly than GDP because firms’ investment and working capital needs fluctuate with the business cycle. Rapid lending may, thus, represent a permanent deepening of the financial system and an improvement of investment opportunities that are beneficial to the economy. Credit growth associated with these two factors is desirable, which can broadly be considered as a case of credit expansion. If the credit expansion is accompanied by an excessive cyclical movement (over-optimism about future earnings), it can be a case of credit boom. In practice, it is difficult to distinguish among three factors, viz., financial deepening, financial accelerator and over-optimism about future earnings, driving credit growth and to determine a ‘neutral’ level or rate of growth for credit (Hilbers, et al, 2005). International experience indicates that an excessive credit expansion (boom) is unsustainable and potentially destabilising.
Financial accelerator is one of the important and familiar mechanisms that can lead to a credit boom, where shocks to asset prices get amplified through balance sheet effects (Bernanke and Gilchrist, 1999). During a boom, asset prices increase which, in turn, lead to increases in borrowers’ net worth. This facilitates new lending, thereby fueling higher asset demand and, in turn, higher asset prices (Gourinchas, et al, 2000). The financial accelerator results from financial market imperfections due to information asymmetry, institutional shortcomings, or perverse incentives facing borrowers and lenders. Over-optimism about future earnings could boost asset valuations, which artificially enhance the net-worth of firms and, in turn, their capacity to borrow and spend. Since performance cannot match the over-optimistic expectation, the process becomes unsustainable beyond a point. Though lending booms are associated with output gains, they can lead to vulnerability of the banking system.
On the basis of cross-country experiences, several methods could be used to ascertain whether there is a credit expansion phase or a credit boom phase or a mere continuation of the trend. IMF (2004) defined the episodes of rapid and sustained credit growth, if the average real credit growth exceeded 17.0 per cent (median rate of real credit growth in credit booms in 28 EMEs during 1970-2002.) over a three-year period. A credit boom can be defined as a situation where credit/GDP ratio is four percentage points above its trend. Ottens, Lambregts and Poelhekke (2005) defined a lending boom episode as two consecutive periods in which the ratio of nominal private credit to nominal GDP deviates from trend by a certain threshold. This threshold varies from 2.0 to 10.0 percentage points of GDP (credit gap).
Although various methods can be used, it may be possible that an identified phase may actually be not a boom period as credit expansion, above the threshold, could be due to financial deepening and business cycles. It is difficult to identify the booms when they are happening. Only when the boom has fully blown up, it may be possible to distinguish it. Hence, policy makers need to look at other macroeconomic developments such as investment boom, consumption boom, current account deficits and increase in the relative price of non-tradables, etc., to have a clear perspective.
References:
Bernanke, Ben, and Simon Gilchrist. 1999. “The Financial Accelerator in a Quantitative Business Cycle Framework.” in Handbook of Macroeconomics, (ed.) John Taylor and Michael Woodford Vol.1C, Amsterdam: North-Holland.
Gourinchas, Pierre-Oliver, Valdes Rodrigo, and Landerreche, Oscar. 2000. “Lending Booms: Some Stylized Facts.” MIT, February.
Hilbers, Paul, Inci Otker-Robe, Ceyla Pazarbasioglu, and Gudrun Johnsen. 2005. “Assessing and Managing Rapid Credit Growth and the Role of Supervisory and Prudential policies.” IMF Working Paper, WP/05/151, July.
IMF. 2004. World Economic Outlook, April.
Ottens, Daniel, Edwin Lambregts, and Steven Poelhekke, 2005. “Credit Boom in Emerging Market Economies: A Requipe for Banking Crisis?.” DNB Working Papers, Natherlands Central Bank.
4.106 To assess the possible vulnerability of India’s banking sector following rapid growth in credit, the IMF (2006) conducted stress test under three alternative scenarios, viz., (i) an increase in provisioning to the levels consistent with international best practices; (ii) an increase in NPAs by 25 per cent; and (iii) an increase in NPAs due to a portion of the “new” loans becoming non-performing. The results reveal that the banking system as a whole is resilient to the tightening of provisioning requirements and to the deterioration in asset quality that may accompany during periods of rapid credit growth (Table 4.26). The analysis suggests that though the recent rapid credit growth does pose some risks, at the moment these risks do not appear to be significant as the aggregate ratio of credit to GDP is still moderate, capital adequacy ratios are sufficiently high and the NPA ratios are low.
Box IV.12
Credit Boom and Monetary Policy
There is no consensus among policy makers and academics about central bank reaction to a situation of credit boom. One strand of view asserts that monetary policy should be used to target the economy and not the asset markets. To the extent a stock market boom causes or simply forecasts sharply higher spending on consumer goods, policy tightening might be employed to contain incipient inflation and not the asset price boom. This view doubts the ability of monetary authority to address the asset price bubble. It is often difficult to adjudge ex-ante as to whether asset price movements are bubbles or not. Second, even if the bubble is identified, the typical monetary tightening measures such as increase in interest rates may not be effective in deflating an asset price bubble (Mohan, 2005). Again, if a central bank believes that a bubble does exist, it would be substituting its judgment for that of the market and it implies that it is better equipped than financial professionals.
On the other hand, there are experts who believe that existence of bubble could be diagnosed on the basis of indicators such as rapid growth of credit, returns on stocks, price-earning ratio, etc. However, the issue remains, whether these rates/ratios are reliable indicators. Moreover, monetary policy is often considered to be too blunt an instrument to achieve financial stability by selectively targeting a sector of the economy. A generalised approach towards bubble popping may succeed only at the risk of strangulating a genuine economic boom.
There is another view which states that credit booms and consequent asset bubbles are essentially the result of inadequate regulation. Financial liberalisation in the face of poorly regulated and supervised banks and inappropriate incentive structure have led to increased boom and bust credit cycles in emerging economies (Hernandez et al, 2002 and Barth et al, 2002). Thus, monetary authority should ideally use its regulatory and supervisory powers to prepare the financial system for the contingency of a large shock to asset prices (Bernanke, 2002).
References:
Barth, James R., Gerard Caprio Jr., and Ross Levin. 2002. “Financial Regulation and Performance: Cross-country Evidence.” in Banking, Financial Integration and International Crisis. (eds.) Lenardo Hernandez and Klaus Schmidt-Hebbel. 113-41. Central Bank of Chile, Santiago.
Bernanke, Ben S. 2002. “Asset Price Bubbles and Monetary Policy.” BIS Review, No.59, BIS.
Hernandez, L., and O. Landerretche. 2002. “Capital Inflows, Credit Booms and Macroeconomic Vulnerability: The Cross-Country Experience.” in Banking Financial Integration and International Crises, Central Bank of Chile, Santiago.
Mohan, Rakesh. 2005. “Some Apparent Puzzles for Contemporary Monetary Policy.” RBI Bulletin, December.
Pricing of Credit
4.107 In April 2003, the system of PLRs was replaced by a system of benchmark prime lending rate (BPLR) as indicated in Section III. Bulk of the bank lending, however, has been taking place at sub-BPLR rates. The share of sub-BPLR lending increased steadily to 82.0 per cent by March 2007 (Table 4.27).
4.108 An analysis of the trends in BPLR vis-à-vis policy rates suggests some downward stickiness in BPLR. In response to decline in the policy rates, banks tended to alter the margin below BPLR in line with the market condition, while leaving the BPLR unchanged. On the other hand, hike in policy rates were promptly followed by upward revisions in BPLR. As a result, the spread between the BPLR and the policy rate tended to widen over the years (Chart IV.19).
Table 4.20: Credit to the Private Sector |
(Per cent to GDP) |
Country |
1980 |
1985 |
1990 |
1995 |
2000 |
2001 |
2002 |
2003 |
2004 |
2005 |
1 |
2 |
3 |
4 |
5 |
6 |
7 |
8 |
9 |
10 |
11 |
Mexico |
19 |
13 |
17 |
29 |
18 |
16 |
19 |
17 |
17 |
18 |
Indonesia |
9 |
19 |
47 |
54 |
20 |
18 |
19 |
21 |
24 |
25 |
Russian Federation |
.. |
.. |
.. |
9 |
13 |
16 |
18 |
21 |
24 |
26 |
Poland |
.. |
4 |
21 |
17 |
27 |
27 |
27 |
28 |
27 |
28 |
Sri Lanka |
17 |
21 |
20 |
31 |
29 |
28 |
29 |
30 |
32 |
.. |
Philippines |
42 |
27 |
22 |
45 |
44 |
40 |
37 |
35 |
34 |
31 |
Brazil |
42 |
42 |
39 |
37 |
36 |
35 |
36 |
35 |
35 |
41 |
India |
25 |
30 |
30 |
29 |
32 |
33 |
37 |
37 |
41 |
47 |
Chile |
47 |
69 |
47 |
54 |
63 |
63 |
65 |
62 |
63 |
66 |
Canada |
67 |
65 |
76 |
77 |
77 |
80 |
81 |
81 |
86 |
88 |
France |
101 |
74 |
94 |
86 |
85 |
88 |
86 |
89 |
91 |
94 |
Thailand |
41 |
58 |
83 |
140 |
108 |
97 |
103 |
103 |
97 |
96 |
Japan |
132 |
151 |
196 |
203 |
193 |
187 |
176 |
103 |
99 |
99 |
Singapore |
81 |
106 |
97 |
106 |
111 |
130 |
114 |
115 |
106 |
102 |
Australia |
26 |
35 |
62 |
69 |
87 |
88 |
91 |
98 |
102 |
109 |
Germany |
77 |
84 |
89 |
100 |
119 |
118 |
117 |
115 |
112 |
112 |
Malaysia |
49 |
87 |
69 |
124 |
140 |
149 |
146 |
141 |
130 |
127 |
New Zealand |
21 |
25 |
76 |
92 |
113 |
112 |
114 |
118 |
121 |
133 |
Spain |
74 |
67 |
78 |
72 |
98 |
101 |
106 |
114 |
125 |
146 |
Hong Kong, China |
.. |
.. |
161 |
150 |
153 |
152 |
148 |
149 |
148 |
146 |
United Kingdom |
28 |
47 |
116 |
115 |
133 |
138 |
142 |
148 |
156 |
166 |
United States |
112 |
128 |
144 |
173 |
231 |
225 |
212 |
236 |
249 |
260 |
.. : Not available.
Source: World Development Indicators, Online Database, World Bank and Reserve Bank of India. |
Table 4.21: Number of Loan Accounts – |
Select Countries |
(Per 100 persons) |
Country |
As at |
Loan Account |
1 |
2 |
3 |
1. |
Argentina |
December 2003 |
15.4 |
2. |
Bangladesh |
December 2003 |
5.5 |
3. |
Belgium |
December 2002 |
5.9 |
4. |
Brazil |
June 2002 |
5.0 |
5. |
Chile |
December 2003 |
41.8 |
6. |
Denmark |
December 2002 |
45.1 |
7. |
Greece |
December 2003 |
77.6 |
8. |
India |
March 2006 |
15.8 |
9. |
Italy |
December 2002 |
32.8 |
10. |
Malaysia |
December 2003 |
32.9 |
11. |
Pakistan |
December 2004 |
2.2 |
12. |
Russia |
December 2003 |
5.4 |
13. |
Singapore |
January 2005 |
51.3 |
14. |
Spain |
December 2003 |
55.6 |
15. |
Thailand |
December 2004 |
24.8 |
16. |
Turkey |
December 2003 |
26.5 |
Source : Beck, Kunt and Peria (2005) and Reserve Bank of India. |
Table 4.22: Commercial Bank Credit Penetration |
in India |
Item |
1981 |
1991 |
2001 |
2005 |
1 |
2 |
3 |
4 |
5 |
1. Number of Credit Accounts |
|
|
|
|
as per cent of Adult Population |
|
|
|
|
a) Rural |
4.9 |
7.7 |
7.9 |
9.5 |
b) Urban |
4.5 |
12.8 |
8.0 |
14.2 |
2. Number of Credit Accounts as |
|
|
|
|
per cent of Number of Households |
|
|
|
|
a) Rural |
18.0 |
44.3 |
26.5 |
32.2 |
b) Urban |
15.1 |
29.9 |
28.4 |
50.2 |
3. Amount of Credit as per cent of GDP |
|
|
|
|
a) Rural |
13.0 |
17.3 |
15.8 |
22.3 |
b) Urban |
20.0 |
24.8 |
31.1 |
45.0 |
4. Small Borrrowal Accounts as |
|
|
|
|
per cent of all Credit Accounts |
|
|
|
|
a) Rural |
– |
– |
80.0 |
61.6 |
b) Urban |
– |
– |
50.7 |
32.2 |
5. Share of Small Borrowal Accounts |
|
|
|
|
in Total Credit Accounts |
|
|
|
|
a) Rural |
– |
– |
25.4 |
14.4 |
b) Urban |
– |
– |
2.0 |
0.9 |
– : Not available.
Source : Basic Statistical Returns of Scheduled Commercial Banks,
in India, various issues, Reserve Bank of India. |
Table 4.23: Region-Wise Number of Credit |
Accounts per 100 Persons – Scheduled |
Commercial Banks in India |
|
|
|
|
|
|
|
|
1991 |
2005 |
1991 |
2005 |
1991 |
2005 |
Region |
|
Rural |
Urban |
Total |
1 |
2 |
3 |
4 |
5 |
6 |
7 |
Northern |
6.6 |
5.1 |
5.9 |
6.7 |
6.4 |
5.7 |
North-East |
4.4 |
3.2 |
4.4 |
3.9 |
4.4 |
3.3 |
Eastern |
7.2 |
4.2 |
4.3 |
4.3 |
6.6 |
4.2 |
Central |
5.8 |
4.2 |
4.4 |
4.5 |
5.5 |
4.3 |
Western |
6.2 |
4.2 |
4.8 |
12.2 |
5.7 |
7.5 |
Southern |
13.6 |
12.7 |
7.6 |
17.4 |
11.8 |
14.2 |
All-India |
7.9 |
6.0 |
5.5 |
9.8 |
7.3 |
7.0 |
Source : Mohan (2006b). |
|
|
|
|
Table 4.24: Incidence of Indebtedness of |
Households in India* |
(Per cent) |
Year |
Rural |
Urban |
1 |
2 |
3 |
1971 |
42.8 |
– |
1981 |
20.0 |
17.4 |
1991 |
23.4 |
19.3 |
2002 |
26.5 |
17.8 |
* : Incidence of Indebtedness defined as percentage of house holds indebted in total num ber of households debted among those surveyed.
– : Not Available.
Source : NSSO (2006a). |
4.109 The policy rate was revised downwards 10 times between October 13, 2000 and October 25, 2005. During this period, however, the BPLR by one representative large bank was revised only 6 times and the lag varied between 6 to 13 months. However, on occasions when the policy rate was revised upwards, the bank was quick to respond with the time lag as low as 20 days (Table 4.28).
4.110 While the BPLR exhibited stickiness, effective lending rates appeared to be sensitive to market conditions. Since bulk of the lending has been taking place at sub-BPLR rates, the rate of discount on commercial paper (CP rate) could be taken as a good proxy for effective bank lending rates in the country. The CP rate was found to be moving in tandem with the weighted average yield on government securities (Chart IV.20).
Table 4.25: Debt-Asset Ratio of Households |
(Per cent) |
Year |
Rural |
Urban |
1 |
2 |
3 |
1971 |
4.42 |
– |
1981 |
1.83 |
2.54 |
1991 |
1.78 |
2.51 |
2002 |
2.84 |
2.82 |
– : Not available.
Source: NSSO (2006a). |
Table 4.26: Stress Tests: Capital Adequacy Ratio |
under various Scenarios |
(Per cent) |
|
All Banks |
Pubic Sector Banks |
Old Private Banks |
New Private Sector Banks |
Foreign Banks |
Ten Largest Banks |
1 |
2 |
3 |
4 |
5 |
6 |
7 |
Actual at end- |
|
|
|
|
|
|
March 2005 |
12.8 |
12.8 |
12.5 |
12.1 |
14.1 |
12.7 |
Stress Test Scenarios |
|
|
|
|
|
|
i) |
Increased |
|
|
|
|
|
|
|
Provisioning |
12.0 |
11.9 |
10.7 |
11.7 |
13.8 |
11.8 |
ii) |
NPAs increased |
|
|
|
|
|
|
|
by 25 Per cent |
10.4 |
10.0 |
7.5 |
11.1 |
13.2 |
10.1 |
iii) |
New Loans |
|
|
|
|
|
|
|
become NPAs |
|
|
|
|
|
|
|
at the same |
|
|
|
|
|
|
|
rate as Old |
|
|
|
|
|
|
|
Loans |
9.4 |
8.8 |
6.0 |
10.7 |
12.8 |
9.0 |
Source : Rozhkov (2006). |
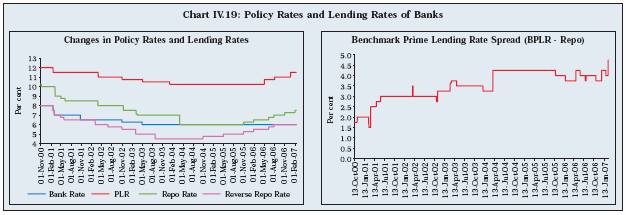
Table 4.27: Share of Loans Extended at Sub- |
BPLR Rates by Scheduled Commercial Banks* |
(Per cent) |
Period |
Public |
Private |
Foreign |
All Banks |
|
Sector |
Sector |
Banks |
|
|
Banks |
Banks |
|
|
1 |
2 |
3 |
4 |
5 |
September 2004 |
33.2 |
50.4 |
64.5 |
38.9 |
December 2004 |
62.0 |
75.3 |
80.9 |
65.1 |
March 2005 |
50.6 |
78.1 |
88.6 |
58.9 |
June 2005 |
57.3 |
80.5 |
89.7 |
64.2 |
September 2005 |
60.9 |
80.9 |
85.5 |
66.8 |
December 2005 |
59.4 |
83.0 |
84.9 |
68.4 |
March 2006 |
63.6 |
85.1 |
85.1 |
69.2 |
June 2006 |
66.5 |
88.0 |
80.0 |
74.8 |
September 2006 |
70.6 |
87.5 |
80.1 |
75.3 |
December 2006 |
72.5 |
88.2 |
78.6 |
77.3 |
March 2007 |
76.3 |
91.8 |
72.4 |
82.0 |
– : Not available.
* : As per cent of total lending.
Source: Reserve Bank of India. |
Table 4.28: Changes in the Repo Rate and |
Advance Rate of Scheduled Commercial Banks |
Repo Rate |
Advance Rate of Commercial Banks* |
Effective |
Rate |
Effective |
Rate |
Date |
(Per cent) |
Date |
(Per cent) |
1 |
2 |
3 |
4 |
13.10.2000 |
10.25 |
01.03.1999 |
12.00 |
06.11.2000 |
10.00 |
01.04.2000 |
11.25 |
09.03.2001 |
9.00 |
12.08.2000 |
12.00 |
30.04.2001 |
8.75 |
19.02.2001 |
11.50 |
07.06.2001 |
8.50 |
|
|
28.03.2002 |
8.00 |
01.04.2002 |
11.00 |
12.11.2002 |
7.50 |
01.11.2002 |
10.75 |
07.03.2003 |
7.10 |
|
|
19.03.2003 |
7.00 |
05.05.2003 |
10.50 |
31.03.2004 |
6.00 |
01.01.2004 |
10.25 |
26.10.2005 |
6.25 |
|
|
24.01.2006 |
6.50 |
|
|
09.06.2006 |
6.75 |
01.05.2006 |
10.75 |
25.07.2006 |
7.00 |
|
|
31.10.2006 |
7.25 |
02.08.2006 |
11.00 |
31.01.2007 |
7.50 |
22.12.2006 |
11.50 |
31.03.2007 |
7.75 |
20.02.2007 |
12.25 |
* : Data pertain to one representative large bank. |
Cost of Intermediation
4.111 The calibrated deregulation of the banking system and the entry of several private and foreign banks gradually induced greater competition, prompting banks to alter their business strategy and management practices which, along with technological developments, led to overall improvement in efficiency. This was reflected in the intermediation cost (operating expenses as percentage to total assets), which decelerated from 2.77 per cent in 1996 to 2.11 in 2006. Notwithstanding this improvement, intermediation cost of banks in India is still high in comparison with other countries (Table 4.29). There is, thus, scope to bring it down to the level of intermediation cost of banks in other Asian countries.
Transformation of the Credit Market
4.112 The analysis in the preceding sections reveals that there has been a profound transformation of the credit market since the early 1990s. Prior to initiation of financial sector reforms, credit institutions borrowed and lent funds at fixed interest rates and faced little competition. Banks operated under regulatory constraints, whereby bulk of their resources were preempted in the form of CRR and SLR. Banks also lacked operational flexibility and functional autonomy. Credit institutions intermediated funds inefficiently, which was reflected in their high NPAs, high intermediation cost and low profitability.
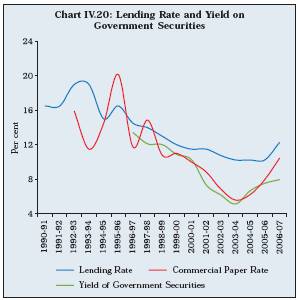
Table 4.29: Intermediation Cost of Banks of Major |
Asian Countries* |
(Per cent) |
Year |
China |
Korea |
Malaysia |
Thailand |
India |
1 |
2 |
3 |
4 |
5 |
6 |
1996 |
1.23 |
2.24 |
1.42 |
1.50 |
2.94 |
1997 |
1.24 |
2.55 |
1.49 |
2.05 |
2.85 |
1998 |
1.40 |
2.53 |
1.68 |
2.54 |
2.63 |
1999 |
1.18 |
1.53 |
1.50 |
2.20 |
2.67 |
2000 |
1.12 |
1.46 |
1.70 |
1.98 |
2.50 |
2001 |
1.10 |
1.42 |
1.80 |
2.01 |
2.64 |
2002 |
1.05 |
1.39 |
1.73 |
1.78 |
2.19 |
2003 |
1.01 |
1.38 |
1.61 |
1.71 |
2.24 |
2004 |
– |
– |
– |
– |
2.21 |
2005 |
– |
– |
– |
– |
2.13 |
2006 |
– |
– |
– |
– |
2.11 |
– : Not Available
* Intermediation cost represents operating expenses as percentage to total assets.
Source :1.Mohan (2006c).
2. Report on Trend and Progress of Banking in India, various issues, Reserve Bank of India. |
4.113 The initiation of financial sector reforms facilitated a gradual move away from a financially repressed regime to a liberalised regime. Banks now operate in an environment in which they have the freedom to innovate and expand their business. With deregulation of interest rates, banks price their products freely both on the liability and the asset sides. The competition has intensified on account of entry of new private sector banks and enhanced presence of foreign banks. Several other significant changes have also occurred both on the supply and demand sides of the credit market.
4.114 On the supply side, reduction in statutory preemptions boosted the supply side of the credit. Accommodative monetary policy followed by the Reserve Bank between April 1998 and October 2004 also provided ample liquidity to the system, which had a positive impact on the supply of credit. The introduction of asset classification norms have made banks very sensitive to their asset quality, whereby banks restrict the supply of credit when faced with large NPLs and increase the supply when NPLs are at reasonable levels. The cleansing of balance sheets by banks have enabled them to recycle the resources locked up in unproductive assets and improve their profitability. With the introduction of capital adequacy norms, banks are able to expand the credit volumes only after expanding the capital base. Raising of capital by banks from the market has, therefore, become critical in their lending operations. It has also subjected them to market discipline and encouraged them to improve corporate governance practices. With the increased competition, spreads of banks have come under pressure. In order to maintain their profitability, banks, therefore, have tended to increase the credit volumes. Thus, from an environment when banks resorted to some sort of credit rationing, they are now increasingly exploring new avenues of expanding their business volumes. In the process, the segmentation of the credit market has almost disappeared with banks now providing also long-term resources, apart from the traditional short-term funds.
4.115 On the demand side, robust economic growth has increased the demand for credit. Apart from the traditional sectors, the household sector has emerged as the major driver of demand for bank credit. Rising income levels and increase in asset prices have stimulated the demand for credit by the household sector.
4.116 The credit market is now also closely integrated with other market segments such as the money, the government securities, the foreign exchange markets, the equity market and the debt market. Conditions in the money market have a direct impact on the credit market, albeit,with a lag. On the other hand, credit market conditions impact the government securities market. Banks have resorted to liquidation of government securities in order to fund their credit demand. The linkage between the credit market and the equity market has also grown on account of participation by banks in the equity market for raising capital. Securitisation of assets has also linked the credit market with the corporate debt market. To the extent, the inter-linkages of the credit market with the other markets have grown, the efficacy of transmission channel of monetary policy has also increased.
4.117 Information technology (IT) has made steady inroads into the credit institutions and has brought about a significant change in many aspects in the form of computerisation of transactions and new delivery channels such as ATMs. With migration of traditional paper-based funds movements to quicker and more efficient electronic mode, funds transfers have become easy and efficient to perform. Quicker fund settlement has a direct bearing on the availability of money which, in turn, has a positive impact on the liquidity management. The increased competition and deregulation have exposed credit institutions to various risks, which have encouraged them to adopt appropriate risk management. Banks with proper risk management system are able to properly price their products and services. Thus, the credit market over the years has become highly competitive, more efficient and better integrated with other markets.
4.118 To sum up, a wide range of credit institutions operate in the country. The relative significance of banks, which are already predominant players in the credit market, has increased partly due to conversion of two DFIs into banks. After witnessing sluggish conditions in the second half of the 1990s, credit extended by banks expanded rapidly beginning 2002-03, underpinned by robust macroeconomic performance. The decline in NPLs in recent years also appeared to have encouraged banks to enlarge their credit portfolio. A welcome development has been large credit expansion to the agriculture sector in the last few years, reversing the decelerating trend of the 1990s. This was also reflected in the increased credit intensity of the agriculture sector. In comparison with the 1980s, credit to the industry slowed down somewhat in the 1990s as also during the current decade so far (up to 2005-06). This was despite the sharp increase in medium and long-term credit to industry, which is supposedly for the project-related activity. This suggests that banks have been filling the gap created by the conversion/merger of two DFIs into banks. Credit intensity of the industrial sector, on the whole, has increased. Credit growth to the SSI sector, which decelerated sharply between 1999-2004, reversed from 2004-05. A significant development in recent years has been a sharp decline in the share of cash credit and increase in the share of demand loans.
4.119 A major development in the credit market has been rapid expansion of credit to the household sector, underpinned by benign interest rate environment and increase in income levels. Household credit now constitutes a significant share of total bank credit. Empirical evidence suggests that credit trends since May 2002 are structurally at variance with the past relationships. Cross-country experience shows that rapid credit expansion has led to difficulties in several countries. In the Indian context, however, the indebtedness of the household sector, the main driver of credit growth in recent years, is at a low level. The banking sector is robust with a high level of capital adequacy and low level of NPAs. Stress tests also suggest that the banking sector is resilient enough to withstand adverse impacts that may arise out of rapid credit expansion.
4.120 Although deposits continue to be the main source of funds, banks’ reliance on non-deposit resources has increased. While the BPLR is exhibiting downward stickiness, banks are extending a large portion of their credit at sub-BPLR rates. As a result, the effective lending rates are in sync with the market conditions. The cost of intermediation has declined steadily even though it is still higher than many other EMEs.
V. THE WAY FORWARD
4.121 With the initiation of financial sector reforms, the Reserve Bank gradually relaxed various controls in the credit market and switched over from micro-regulation to macro and prudential regulation. Restrictions on credit and their pricing were progressively removed. This combined with increased competition induced banks, major players in the credit market, to persify their loan portfolios in line with the persification of the economy. However, while credit flows to agriculture and the SME sector have increased in recent years, the need is to further increase the flow of credit to these sectors, particularly to SMEs. To facilitate increased access to formal channels of credit and to enable the credit market to play an important role to sustain the growth process, several short to medium-term issues need to be addressed.
Rural Credit
4.122 According to the latest available All-India Debt and Investment Survey 2002, the share of institutional agencies in outstanding cash debts of the households declined from 66.3 per cent in 1991 to 57.1 per cent in 2002, with a corresponding increase in reliance on informal channels of credit. Although, the share of institutional credit might have risen on account of significant increase in bank credit to agriculture in recent years, concerns about inadequate access to credit in rural areas remain.
4.123 Although the supply led approach to rural credit prior to the 1990s ensured availability of credit at a subsidised rate, it turned out to be financially unsustainable as it impacted the health of credit institutions adversely. While there is certainly a need to increase the flow of credit to the agricultural sector, there are some critical issues that need to be addressed. Some of these issues have already been raised by the Hon’ble Prime Minister4 . These are: (i) What do farmers need – a lower rate of interest or reliable access to credit at reasonable rates?; (ii) Is our existing institutional framework adequate for meeting the requirements of our farmers who are a perse lot?; (iii) Do we need to create new institutional structures such as SHG, micro-finance institutions, etc., to provide improved and reliable access to credit? Or do we need to bring in money lenders under some form of regulation? It is necessary to find answers to these questions in the near future.
4.124 Reliable access to credit is more crucial than the cost of credit. The Reserve Bank, therefore, has been initiating several measures from time to time to extend the outreach of the credit institutions in underserved areas. The branch licensing policy favours opening branches in unbanked districts/areas. Banks have also been permitted to use the services of business facilitators and business correspondents to extend their outreach. Banks are now increasingly roping in non-government organisations, SHGs, and MFIs to act as intermediaries. The SHG-Bank linkage programme is expected to gain further ground with NABARD taking up a programme for intensification of these activities in 13 identified States, which account for 70.0 per cent of the rural poor population.
4.125 Some aspects of operations of MFIs, however, have also raised some concerns. Although micro-finance activities should be commercially viable, it is reported that some MFIs are charging very high interest rates, which could prove to be counter-productive in the long run. While informality of micro-finance structure is important, NABARD and banks need to build appropriate indigenous/local safeguards against such practices and in their relationship with MFIs.
Credit to the SME Sector
4.126 SMEs are more constrained in their financing options than large firms. In the absence of adequate credit from the credit institutions, they have to depend largely on their internal generation, which constrains their growth. As credit to the SME sector is crucial for sustaining the growth momentum in the economy, the Reserve Bank has taken several measures to streamline the credit flow and address structural problems in credit delivery to this sector. This is showing some encouraging results and the need is to sustain the recent growth trends. One major issue is that banks perceive the SME sector as more risky and, hence, they charge relatively high rate of interest on loans and insist on collateral.The Reserve Bank has advised banks not to insist on collateral for loans up to Rs.5 lakh and for loans above Rs.5 lakhs and up to Rs.25 lakh, banks may consider dispensing with the collateral requirement based on good track record and financial position of the SSI unit. There are several ways which may resolve this issue and facilitate extension of credit without collateral. One such option is the availability of credit history of the borrowers. However, building up of credit history of a large number of borrowers spread throughout the country, especially small borrowers, is a difficult task. The Credit Information Bureau (India) Limited has already become operational. The Credit Information Act was passed in May 2005, and rules and regulations thereunder have also been notified.This will facilitate formation of more credit information companies. These companies would collect and disseminate credit information about the borrowers and may also introduce credit scoring as in other countries. These should help in improving the quality of credit, reducing the transaction cost and improving the flow of credit to the SME sector. Another option to avoid the collateral requirement is to introduce independent rating of borrowers, both individuals and firms. At present, rating penetration is very low in the country and cost involved in getting the rating is high. Concerted efforts, therefore, need to be made to popularise rating as a concept acceptable to both the lenders and the borrowers. Yet another option is to consider future cash flows as collateral security such as account receivables in place of asset based collateral.
4.127 There has been a burst of entrepreneurship across the country, spanning rural, semi-urban and urban areas. This has to be nurtured and financed. It is only through growth of enterprises across all sizes that competition will be fostered. A small entrepreneur today will be a big entrepreneur tomorrow, and might well become a multinational enterprise eventually if given the comfort of financial support. But we also have to understand that there will be failures as well as successes. Banks will, therefore, have to tone up their risk assessment and risk management capacities, and provide for these failures as part of their risk management. Despite the risk, financing of first time entrepreneurs is necessary for financial inclusion and growth. The financing of non-agriculture service enterprises in rural areas would generate new income and employment opportunities (Mohan, 2006b).
Increasing Credit Penetration
4.128 Although India has a well-persified financial system with a wide variety of credit institutions, credit penetration continues to be relatively low in comparison with several other developed and emerging economies. This is despite the fact that several measures have been taken in the recent past to bring more and more people, especially the underprivileged and low income households, into the banking fold. In an ideal world, competitive pressures would ensure that the banking needs of all the segments of the population are met. However, the experience shows that some intervention may be required to ensure that people with low incomes are provided with credit facilities at a reasonable cost. Concerted efforts, therefore, need to be made to increase the credit penetration in the country. Major reasons for low credit penetration are lack of awareness of facilities, high transaction cost of doing business in rural areas and inability of the poor people to provide collaterals.
4.129 The under-privileged sections of the society with low income levels generally hesitate to visit the bank and are driven to local money lenders. There is, therefore, need to devise some mechanisms to impart financial education, especially in rural areas. The focus of financial education should be on educating the general public about the benefits of using formal credit institutions for their requirements.
4.130 A major issue in increasing credit penetration is the collateral that banks insist on for extending loans. While banks are being induced to provide small loans without collateral, banks need to consider alternative ways to reduce their dependence on collateral.
4.131 Another major issue in increasing the flow of credit is related to the high transaction costs. This, however, could be resolved through appropriate application of technology. Banks need to look into low cost delivery alternatives offered by IT. It can make a critical contribution by reducing cost and time in processing of applications, and maintaining and reconciliation of accounts. Use of a variety of devices such as weekly banking, mobile banking, satellite offices, and adoption of hub and spoke models can considerably cut the overhead cost for enabling banking services in remote areas. Once the data base and the track record are established, a multitude of financial services can be offered, including savings, remittances, transaction and banking such as receipt of salaries, pensions and payments for utilities, loans including home loans, insurance and mutual fund products.
4.132 One aspect, however, that needs to be taken care of while introducing IT-based products and services is low level of literacy and technology orientation and awareness about IT-based products in rural areas. Language is another barrier in the use of technology, which is largely English-based. Thus, banks would have to make efforts to popularise the new IT-based products. In this regard, due consideration to regional languages and programmes to impart some basic education in IT needs to be given.
4.133 However, the policy on increasing credit penetration may not yield the desired results by focusing on commercial banks alone. A comprehensive approach involving other institutions such as cooperatives and State level financial institutions is also desirable. Moreover, it is necessary to create an environment that promotes the emergence of sustainable financial service providers to work in under-served markets.
Pricing of Credit
4.134 Pricing of credit has drawn considerable attention since the deregulation of bank lending rates. Although interest rates are now driven by demand-supply forces, some downward stickiness has been observed in banks’ BPLR. Further, around 82 per cent of the lending by banks is taking place at sub-BPLR rates, which raises several concerns. While better creditworthy corporates are getting credit at sub- BPLR rates, the agriculture and SSIs sectors and other borrowers, in general, are charged BPLR or in some cases even higher rates. The administered interest rate is applicable only in the case of agricultural loans below Rs. 2 lakh and export credit. Banks can also extend short-term production credit to farmers up to Rs. 3 lakh at an interest rate of 7 per cent on which the banks are being provided interest subvention of 2 per cent by the Government. The All India Debt and Investment Survey 2002 found that about 82 per cent of the rural debt as of June 30, 2002 was in the interest range of 12 to 20 per cent, while prime lending rates (PLRs) of banks were in the range of 11 to 12 per cent.
4.135 Lending below the BPLR has several implications. First, it lacks transparency and, hence, affects both lenders and borrowers. Second, to compensate for sub-BPLR lending, other segments are charged higher rate of interest, thus, leading to cross subsidisation of the economically well-off borrowers by the economically poor borrowers. Though the Reserve Bank has been advising banks to evolve their own BPLR by taking into account the cost of funds, transaction cost and reasonable cover for the riskiness, fixation of the BPLR continues to be more arbitrary than rule based. It is, therefore, felt that the concept of arriving at the BPLR needs to be looked into with a view to making it more transparent.
Improving Efficiency
4.136 Improved efficiency in lending operations (and also in other banking business) can reduce the operating expenditure, interest spread and cost of intermediation in general (Mohan, 2006c). This may help in reducing the rate of interest on loans and, thus, facilitating improved credit flow to the various sectors of the economy. Although the intermediation cost in India has declined since the early 1990s, it is still high in comparison with other advanced and emerging market economies. It is, therefore, imperative that the intermediation cost is brought down. Technological improvement in bank operations holds the key in further improving efficiency and, thus, reducing the cost of operations.
Credit Counselling
4.137 While there is a need to encourage innovations and competition in the marketplace, it is also necessary to provide adequate protection to consumers. However, some of today’s products have become difficult for consumers to understand because they are complex, and lack transparency and standardised information. Credit is a source of risk. However, some consumers could take out loans that are inappropriate and expensive. Some consumers may also be driven into debt by change in circumstances. There is, therefore, need to provide consumers with right information and at the right time to enable them to take informed decisions. With the changing growth dynamics, certain segments of the population could also become susceptible to excessive optimism in the economic environment. In view of these reasons, it would be very useful to establish credit counselling institutions for educating individuals to assess their credit demand and debt management in order to mitigate the bankruptcy risk. Furthermore, credit counselling institutions can also remove asymmetric information in rural credit and can help individuals by guiding them to access credit from various available sources. From the perspective of a regulator, financial education delivered through credit counselling can empower the common person and, thus, reduce the market failure attributable to information asymmetries.
4.138 In several countries, the system of credit counselling organisastions is already in operation. The first well-known credit counselling agency was created in 1951 in the United States to promote financial literacy and help consumers to avoid bankruptcy. Subsequently, several other countries established such organisations. For instance, the Banking Code in the UK provides that member banks shall discuss financial problems with customers and together evolve a plan for resolving these problems. Canada established a non-profit counselling organisation in 2000 called Credit Counselling Canada (CCC), which seeks to enhance the quality and availability of not-for-profit credit counselling for all its citizens. The Bank Negara Malaysia has established a Credit Counselling and Debt Management (CCDM) agency to provide advice to individuals on credit counselling and loan restructuring. The arrangement is expected to be a prompt and cost-effective means of debt settlement based on the repayment plan between the creditor and the debtor without intervention of courts. In view of rising personal bankruptcies, primarily on unsecured debt, Credit Counselling of Singapore (CCS) was established in 2003 to assist financially distressed consumers. In India, the working group constituted by the Reserve Bank to examine procedures and processes for agricultural loans (Chairman: Shri C. P. Swarankar) recommended that banks should actively consider opening of counselling centres, either individually or with pooled resources, for credit and technical counselling with a view to giving special thrust to the relatively underdeveloped regions.
Strengthening of Credit Appraisal, Prudential Regulation and Supervisory Standards
4.139 While increase in credit in the Indian context reflects financial sector deepening, the process has to be gradual. Excessive credit expansion could lead to macroeconomic and financial vulnerabilities. The rapid credit growth has been often considered as risky as even weaker borrowers may be judged creditworthy. Excessive optimism about future earnings might lead banks to focus on credit creation to the detriment of credit monitoring and risk appraisal, which could lead to increase in non-performing loans. In view of rapid credit growth in recent years, banks need to strengthen their credit appraisal standards and ensure appropriate post-disbursal monitoring.
4.140 Prudential regulation and supervision is extremely important during periods of rapid credit expansion. The Reserve Bank has already taken several significant prudential measures to moderate the credit growth to the sensitive sectors. As stated in the Mid-term Review of the Annual Policy Statement, 2005-06, a supervisory review process was initiated in respect of select banks having significant exposure to certain sectors, namely, real estate, highly leveraged NBFCs, venture capital funds and capital markets. The quality of supervision has improved significantly with the setting up of the Board for Financial Supervision, which now gives focused attention to the supervision of all financial institutions. Efforts are also being made to make the supervisory system risk-based, for which pilot runs are on. Appropriate early warning system and the surveillance systems are also in place. The need, however, is to keep the supervisory machinery well-functioning.
VI. SUMMING UP
4.141 The credit market is the most significant segment of the financial market structure in India. The credit market in India has witnessed significant transformation in the last 15 years in terms of type of borrowers/type of instruments and price of credit. With the conversion of two DFIs into banks and reduction in the business operations of NBFCs, the predominance of banking institutions in the credit market has increased. However, with enhanced freedom for business operations and increased presence of private and foreign banks and non-bank credit institutions, the credit market has become highly competitive as new banks are making every effort to increase their share in the credit market. The credit market has also persified in terms of borrowing entities and the purposes for which credit is extended. Reflecting the changing structure of the economy, the services sector along with the household sector have emerged as significant borrowers from the banking sector.
4.142 The trend of declining share of credit to agriculture in the 1990s has been reversed as there has been rapid credit expansion to this sector in the last few years. This reflects the concerted efforts being made by the Reserve Bank and the Government. Credit to industry slowed down in the 1990s and the current decade as compared with the 1980s. Internal funds generation, as a result of improved financial performance, has limited the short-term borrowing needs of industry. Credit growth to the SSI sector, which had decelerated between 1999-2000 and 2003-04, has accelerated in the last two years. The need is to further strengthen the flow of credit to the SSI sector. Banks in recent years have reoriented their services to the household sector. Increase in the share of medium and long-term loans to industry and the strong growth of housing loans resulted in sharp increase in the share of medium and long-term loans in total credit in recent years. Given the short-term character of bank deposits, a significant increase in overall medium and long-term credit may have implications for banks’ asset liability management (ALM).
4.143 Bank credit has expanded at a rapid pace from 2002-03. One of the most significant changes in the composition of bank credit in recent years has been the large increase in the share of the household sector. Rapid credit expansion, to an extent, has been encouraged by improvement in asset quality as credit intermediation function was impaired in the mid-1990s on account of high level of NPAs. Empirical evidence suggests that credit trends since May 2002 are structurally at variance with the past relationships, although credit expansion in recent years has also been pro-cyclical in nature.
4.144 Many other emerging market economies have also been experiencing rapid credit expansion in recent years. Several factors have contributed to rapid credit expansion in emerging market economies such as robust growth, macroeconomic stabilisation, strong economic outlook and improvement in business confidence. However, in the case of India, the credit-GDP ratio has been low in comparison with other EMEs. Strong credit expansion in recent years, thus, to some extent reflects the financial deepening process. Although borrowings by the household sector have increased sharply in recent years, the debt-asset ratio of the household sector continues to be low. However, there is a need to recognise that large accumulation of debt could leave households prone to future interest rate/exchange rate shocks as banks have transferred a large part of their market risk to households, thus, raising concerns over sustainability of high credit growth to households. Insofar as the banking sector is concerned, it, in general, has high capital adequacy ratio and low level of non-performing loans. Stress tests suggest that the banking sector in India is resilient enough to withstand any adverse impact arising out of rapid expansion in credit. Nevertheless, keeping in view the risks arising out of rapid credit growth, the Reserve Bank initiated several prudential and monetary measures to slowdown the flow of credit to the sensitive sectors and maintain the asset quality of banking institutions. The need for banks is to strengthen credit appraisal and post-disbursal monitoring.
4.145 A proper functioning of the credit market depends on adequate competition. In a competitive environment, the more efficient institutions capture the market share at the expense of less efficient ones, which improves the overall efficiency of the system. This benefits both the credit institutions and their clients. While gains to credit institutions occur in the form of higher profits, to consumers they occur in the form of lower cost of the services. The process of consolidation and restructuring that is underway in the credit market in India may result in weeding out the inefficient players and the credit market may become more efficient in future.
4.146 Robust economic growth has increased the demand for credit. Proper functioning of credit institutions in general and banks in particular is key to sustained economic growth. In the current situation of high credit expansion, banks have been unwinding their surplus investments in SLR securities, over and above the prescribed minimum. This unwinding would soon reach a limit. Therefore, banks need to make sustained efforts for mobilising stable retail deposits by extending banking facilities and wide-spreading their deposit base. In particular, banks would need to devise imaginative ways to mop up the resources in rural areas to balance their deposit mobilisation and credit expansion.
Annex IV.2: Supervisory Measures to Manage Key Risks of Rapid Credit Growth |
Type of risk |
Specific Measures |
Credit risk |
- Higher and/or differentiated capital requirements or application of risk weights based on loan type, maturity, and currency composition of credit.
|
|
- Raising general provisions, incorporating various elements of risks (e.g., in foreign currency loans, offshore, derivatives, or other off-balance sheet activities) in loan classification and provisioning requirements (e.g., for bank with rapidly growing portfolios); or dynamic provisioning.
|
|
- Tightening eligibility requirements for certain types of loans including through limits on loan-to-value ratios for certain loans (e.g., for mortgages or foreign exchange loans).
|
|
- Tighter (or appropriate) collateral requirements (e.g., specifying assets eligible for collateral, marked-to-market asset valuation).
|
|
- Rules on credit concentration (limits against large exposures to a single borrower or a group of related borrowers and against connected lending; and limits against credit concentration in particular industries, sectors, or regions).
|
|
- Use of periodic stress tests of banks’ balance sheets against interest rate, exchange rate, and asset price changes (by banks themselves as well as supervisory authorities).
|
|
- More intensive surveillance and onsite/offsite inspection of potential problem banks.
|
|
- Improved reporting/disclosure rules for banks’ and their borrowers’ balance sheets and banks’ risk management, and internal control policies and practices.
|
|
- Periodic and close monitoring of banks’ foreign-currency-denominated (or indexed) loans to domestic customers, which do not have adequate sources of foreign exchange or are otherwise unable to hedge the risks involved, including through requirements to conduct periodic surveys of banks’ and their borrowers’ foreign exchange exposures.
|
Direct/indirect foreign exchange |
- Tightening of net open position limits for banks to limit direct foreign exchange risks.
|
|
- Imposing differentiated capital requirements or risk weights based on the currency composition of credit to limit indirect risks exposure to foreign exchange risks.
|
|
- Incorporating unhedged foreign exchange exposure in the criteria for loan classification and provisioning rules.
|
|
- Tightening eligibility requirements for foreign exchange loans, including by limiting such loans to borrowers with foreign exchange income or adequate hedging, to limit indirect exposure to foreign exchange risks.
|
|
- Periodic stress testing of banks’ balance sheets with respect to exchange rate changes (by banks themselves as well as supervisory authorities).
|
|
- More intensive surveillance and onsite/offsite inspection of banks with a large share of foreign exchange lending in their overall portfolios, including to ensure that banks have appropriate internal procedures for risk measurement, assessment, and management.
|
|
- Adequate monitoring of banks’ direct and indirect exposure to foreign exchange risks through improved reporting/ disclosure rules for banks and their borrowers’ open positions in foreign currency or through a requirement to conduct periodic surveys of banks’ and their borrowers’ foreign exchange exposures (by banks themselves and/ or by supervisory authorities).
|
Liquidity/
maturity risks |
- Imposing differentiated capital requirements or risk weights based on the maturity composition of credit.
|
|
- Maturity mismatch regulations (active management of maturity mismatches between bank assets and liabilities, with limits established against such gaps and limits on various instrument exposures incurred by the bank).
|
|
- Use of periodic stress tests of banks’ balance sheets under alternative scenarios for interest rate changes (by banks themselves as well as supervisory authorities).
|
|
- Enhanced monitoring and reporting requirements on : i) the maturity structure of interest-sensitive assets and liabilities broken down into several daily, weekly, monthly, and quarterly maturity “buckets”, ii) the maturity structure for each currency in which the bank has a substantive position, iii) the types of interest-bearing securities and their maturity breakdown and iv) banks’ liquid assets, expected future cash flows and liquidity gaps for specified future periods, and details of liquidity management.
|
|
- Guidance to banks to avoid over-reliance on short-term inter-bank borrowing and encouraging access to persified funding bases in terms of sources of funds and the maturity breakdown of the liabilities taking into account differences in volatility and reliability of domestic and external sources of liquidity.
|
Source: Hilbers, et al, 2005. |
|