Credit growth of scheduled commercial banks (SCBs) picked up during 2017-18 amidst sluggish deposit growth. The stress in the banking sector continues as gross non-performing advances (GNPA) ratio rises further. Profitability of SCBs declined partly reflecting increased provisioning. This has added pressure on SCBs’ regulatory capital ratios. Macro-stress tests indicate that under the baseline scenario, SCBs’ GNPA ratio may rise from 11.6 per cent in March 2018 to 12.2 per cent by March 2019. The system level capital to risk-weighted assets ratio (CRAR) may come down from 13.5 per cent to 12.8 per cent during the period. Sensitivity analysis indicates that a severe shock to the GNPA ratio could bring down the CRAR of as many as 20 banks, mostly public sector banks (PSBs), below 9 per cent. Macro-stress tests on public sector banks under prompt corrective action framework (PCA PSBs) suggest worsening of their GNPA ratio from 21.0 per cent in March 2018 to 22.3 per cent by March 2019 with 6 PCA PSBs likely experiencing capital shortfall under the baseline scenario. The PCA framework could help to mitigate financial stability risks by arresting the deterioration in the banking sector, so that further capital erosion is restricted and banks are strengthened to resume their normal operations. Analysis of inter-bank network reveals a reduction in the size of the interbank market coupled with a marginally higher level of interconnectedness in March 2018 as compared with the previous year. Contagion analysis of the banking network indicates that if the bank with the maximum capacity to cause contagion losses fails, it will cause a solvency loss of about 9.0 per cent of the Tier-I capital of the banking system. Section I Scheduled commercial banks1 2.1 In this section, the soundness and resilience of scheduled commercial banks (SCBs) is discussed under two broad sub-heads: i) performance, and ii) resilience using macro-stress tests through scenarios and single-factor sensitivity analyses2. Performance 2.2 SCBs’ credit growth picked up on a year-on-year (y-o-y) basis across bank groups between September 2017 and March 2018. However, deposit growth decelerated for PSBs impacting the deposit growth of all SCBs. Their capital to risk-weighted assets ratio (CRAR) as well as the Tier-I leverage ratio3 declined marginally between September 2017 and March 2018 (Chart 2.1). 2.3 SCBs’ profit after tax plummeted mainly due to higher risk provisions between September 2017 and March 2018 (Chart 2.1). The share of net interest income (NII) in total operating income increased from 63.7 per cent in 2016-17 to 65.2 per cent in 2017-18, whereas, their other operating income (OOI) declined. Among the components of other operating income, share of profit/loss due to securities trading showed significant decline in 2017-18 over 2016-17. Cost of interest bearing liabilities as well as return of interest earning assets for SCBs declined in 2017-18 as compared with 2016-17. Profitability ratios of SCBs turned negative mainly due to PSBs. Asset quality 2.4 SCBs’ gross non-performing advances (GNPA) ratio rose from 10.2 per cent in September 2017 to 11.6 per cent in March 2018. However, their net non-performing advances (NNPA) ratio registered only a smaller increase during the period due to increase in provisioning. The GNPA ratio in the industry sector rose from 19.4 per cent to 22.8 per cent during the same period whereas stressed advances ratio7 increased from 23.9 per cent to 24.8 per cent. Within industry, the stressed advances ratio of sub-sectors such as ‘gems and jewellery’, ‘infrastructure’, ‘paper and paper products’, ‘cement and cement products’ and ‘engineering’ registered increase in March 2018 from their levels in September 2017. The asset quality of ‘food processing’, and ‘textiles’ sub-sectors improved during the same period. The provision coverage ratio increased across all bank groups in March 2018 from its level in September 2017. Among the bank groups, FBs had the highest provision coverage ratio (88.7 per cent) followed by PvBs (51.0 per cent) and PSBs (47.1 per cent) (Chart 2.2). 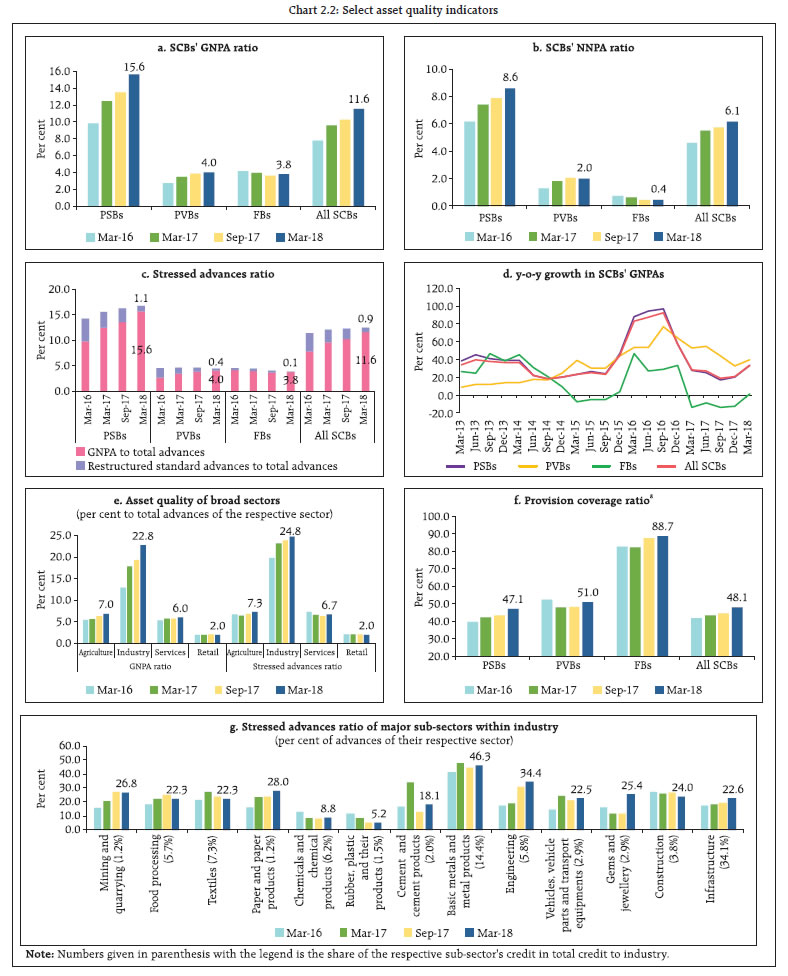 Credit quality of large borrowers9 2.5 Share of large borrowers in SCBs’ total loan portfolios as well as their share in GNPAs declined marginally between September 2017 and March 2018. In March 2018, large borrowers accounted for 54.8 per cent of gross advances and 85.6 per cent of GNPAs. The category 2 of special mention accounts10 (SMA-2) as percentage of gross advances decreased across bank-groups. Top 100 large borrowers accounted for 15.2 per cent of gross advances and 26 per cent of GNPAs of SCBs (Chart 2.3). Risks Banking stability indicator 2.6 The banking stability indicator (BSI)11 showed that deteriorating profitability as well as asset quality pose elevated risks to the banking sector stability (Charts 2.4 and 2.5).
2.7 Weak profitability of SCBs is a concern as low profits can prevent banks from building cushions against unexpected losses and make them vulnerable to adverse shocks. Median return on assets (RoA) of SCBs came down further in March 2018 (Chart 2.6). There are several structural issues resulting in low profitability of SCBs, viz., high loan loss provisions, debt overhang, increasing costs and declining revenues. 2.8 Profitability of weak banks (14 banks with RoAs in the bottom quartile) on an average has been worsening since September 2016 and more efforts will be needed to improve their resilience (Chart 2.7). Though such weak banks had higher pre-provisions operating profits (EBPT), the higher risk-provisioning against NPAs on their balance sheets resulted in their low profitability. Resilience - Stress tests Macro-stress test-Credit risk13 2.9 The resilience of the Indian banking system against macroeconomic shocks was tested through macro-stress tests for credit risk. These stress tests assess the resilience of the banking system to adverse but plausible macroeconomic shocks (please see Box 2.1 for details). These tests encompassed a baseline and two (medium and severe) adverse macroeconomic risk scenarios (Chart 2.8). The baseline scenario assumes the continuation of the current economic situation in future14. The adverse scenarios were derived based on standard deviations in the historical values of each of the macroeconomic variables separately, that is, univariate shocks: up to one standard deviation (SD) of the respective variables for medium risk and 1.25 to 2 SD15 for severe risk (10 years historical data). The horizon of the stress tests is one year. 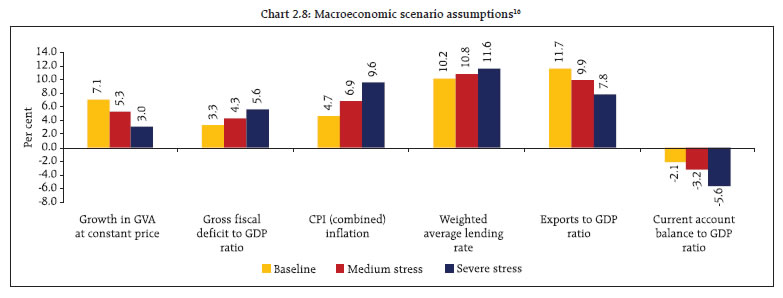
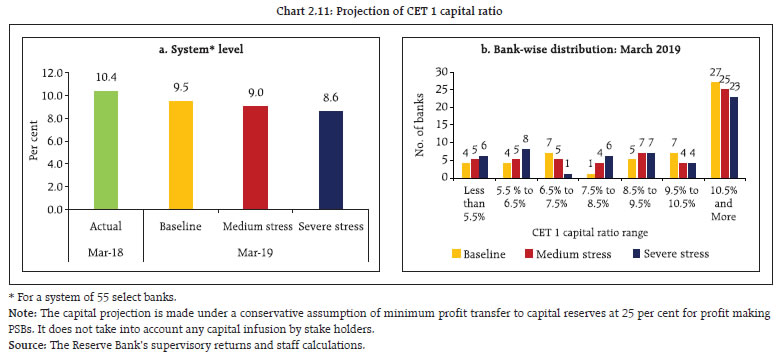
Box 2.1: Objective of Bank Stress Tests Bank Stress tests are exercises that are designed to assess whether a bank or a group of banks are adequately capitalized even under adverse economic scenarios (Goldstein, 2017). Such tests are being conducted by the international Monetary Fund (IMF) since the late 1990s, but have gained prominence following the global financial crisis. For example, the Supervisory Capital Assessment Program (SCAP) undertaken by the US Federal Reserve in 2009 and its subsequent evolution into Comprehensive Capital Analysis and Review (CCAR) have effectively dovetailed the result of such stress tests in the capital planning process of individual banks. Essentially, stress tests are meant to be “what if” exercises. Hence the construction of scenarios and underlying assumptions are important. The general guideline about construction of scenarios are that they should be “severe but plausible” and the construction of scenarios have varied based on the jurisdiction. For example, in the Bank of England’s new stress testing regime, an effort is being made to make the scenarios countercyclical: “The stress test will become more severe as the risks get bigger and less severe as those risks either materialize or shrink” (Brazier, 2015). In the Indian case, to ascertain the resilience of the banking sector to macroeconomic shocks, macro-stress test for credit risk under three hypothetical scenarios, viz. baseline, medium stress and severe stress, is conducted and reported in the Financial Stability Reports (FSRs) since June 2011. At present, the three scenarios are based on assumed adverse shocks, with increasing severity, to macroeconomic variables such as gross value added (GVA) growth, gross fiscal deficit to GDP ratio, CPI Inflation, weighted average lending rate, exports to GDP ratio and current account balance to GDP ratio. The stress impact assessment for Indian banks marries top-down system-level impact of adverse macro scenarios on banking sector's gross non-performing assets (GNPA) under three complementary econometric models viz., multivariate regression, vector auto regression (VAR) and quantile regression (details in Annex 2). The average of projections for GNPAs derived from these three models is presented at the bank group levels. Currently, top-down assessment of macroeconomic shocks on the capital adequacy of an individual bank entails first, the projection of risk weighted assets (RWA) and second, the projection of profit after tax (PAT). Projection of RWA involves projection of bank-wise RWA through the Internal Rating Based formula (IRB) for credit risk after obtaining projections of disaggregated sectoral probability of defaults. RWA (other than credit risk) is projected based on average growth rate in the past. The PAT at the bank level is projected through forward-looking estimates of net interest income, other operating income, other expenses and provisions. In addition to the top-down macro-stress test for credit risk, a number of single-factor sensitivity tests are carried out to look at bank-specific or idiosyncratic vulnerability. The method outlined above produces ‘first order impact’ of a macro-economic shock and doesn’t include ‘feedback’ or ‘second order’ effects (Haldane, 2009). Such feedback is captured in this Report in a limited way by looking at the solvency losses due to contagion after taking into account the impact of macroeconomic shocks. On balance, it is critical to appreciate that outcomes under the assumed stress scenarios, while being plausible, are neither forecasts nor are expected outcomes. Stress tests and consequent disclosure of results strive to remove information asymmetry that can cripple markets when adverse scenarios materialise. In other words, stress tests are potentially an important tool to communicate with economic agents to reinforce financial stability and build resilience in bank balance-sheets against economic adversity. References 1. Brazier, Alex (2015), ‘The Bank of England’s Approach to Stress Testing the UK Banking System’, Presentation at the LSE Systemic Risk Centre Conference on Stress Testing and Macroprudential regulation, London School of Economics, October 29-30. 2. Goldstein, Morris (2017), ‘Banking’s Final Exam- Stress Testing and Bank Capital Reform’, Peterson Institute of International Economics. 3. Haldane, Andrew (2009), ‘Rethinking Financial Network’, Speech at Financial Student Association, Amsterdam, April, 28. | 2.10 The stress tests indicate that under the baseline scenario, the GNPA ratio of all SCBs may increase from 11.6 per cent in March 2018 to 12.2 per cent by March 2019. However, if the macroeconomic conditions deteriorate, their GNPA ratio may increase further under such consequential stress scenarios (Chart 2.9). Among the bank groups, PSBs’ GNPA ratio may increase from 15.6 per cent in March 2018 to 17.3 per cent by March 2019 under severe stress scenario, whereas PvBs’ GNPA ratio may rise from 4.0 per cent to 5.3 per cent and FBs’ GNPA ratio might increase from 3.8 per cent to 4.8 per cent. 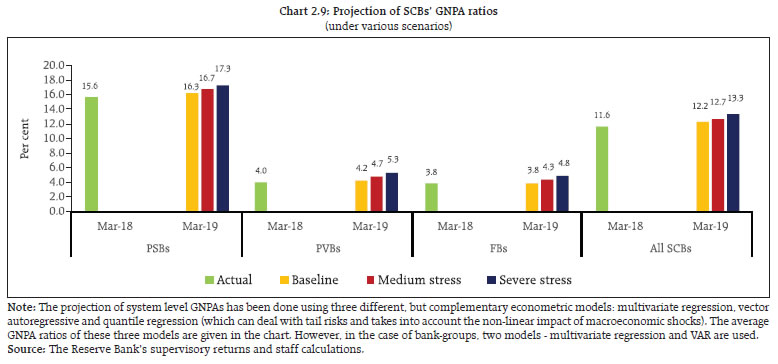 2.11 Under the assumed baseline macro scenario, six PSBs under prompt corrective action framework (PCA PSBs) may have CRAR below the minimum regulatory level of 9 per cent by March 2019 without taking into account any further planned recapitalisation by the Government17. However, if macroeconomic conditions deteriorate, ten banks may record CRAR below 9 per cent under severe macro-stress scenario. Under such a severe stress scenario, the system level CRAR may decline from 13.5 per cent to 11.5 per cent by March 2019, while under the baseline scenario, CRAR of SCBs may decline to 12.8 per cent (Chart 2.10). Under such severe stress scenario, six banks may have common equity Tier 1 (CET 1) capital to risk-weighted assets ratio below minimum regulatory required level of 5.5 per cent by March 2019. The system level CET 1 capital ratio may decline from 10.4 per cent in March 2018 to 8.6 per cent by March 2019 under severe stress scenario (Chart 2.11). The capital augmentation plan announced by the Government will go a long way in addressing potential capital shortfall as also play a catalytic role in credit growth. 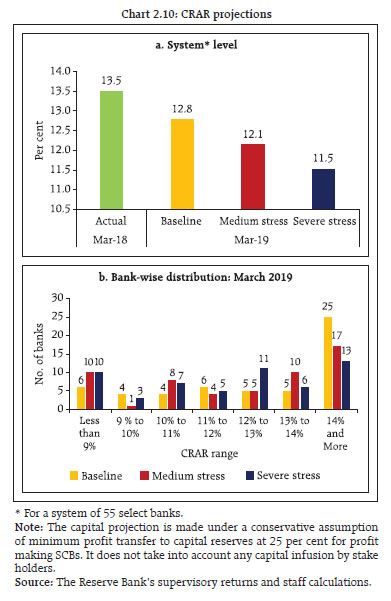
 2.12 A comparative analysis of PCA PSBs vis-à-vis non-PCA PSBs is given in the Box 2.2. Box 2.2: PCA PSBs vis-à-vis non-PCA PSBs: A Comparative Analysis The global financial crisis demonstrated the shortcomings of the framework for effective financial crisis management and in many cases the absence of effective resolution mechanism to handle systemic financial institutions. A resolution mechanism is put in place when a financial institution has weakened substantially, but a framework of preventive as well as early intervention measures could potentially arrest the deterioration in financial institutions in the first place. Putting in place a prompt corrective action (PCA) framework that incorporates graded triggers at pre-specified levels for taking early actions by the regulators is important for the financial sectors (Report of the Working Group on Resolution Regime for Financial Institutions, RBI, 2014). In literature, the efficacy of a PCA has been studied extensively, particularly, in the United States. The consensus is that it has worked well, particularly, in terms of raising capital ratios and reducing risks for banks (for example, Benston and Kaufmann 1997; Aggarwal and Jaques 2001; Elizalde and Repullo 2004). Freixas and Parigi (2007) provide theoretical support for PCA framework by showing that optimal capital regulation consists of a rule that i) allows well-capitalised banks to freely invest any amount in any risky assets, ii) prohibits banks with intermediate levels of capital to invest in the most opaque risky assets, and iii) prohibits undercapitalized banks to invest in risky assets at all. Freixas and Parigi (2007) argue that the rationale behind the mandate to PCA is preventing regulatory forbearance of undercapitalised banks. In the absence of such a mandate, banks have lower incentives to take costly actions to bolster their capital ratios. The Reserve Bank of India initiated a Scheme of Prompt Corrective Action (PCA) in 2002 in respect of banks which hit certain regulatory trigger points in terms of capital to risk weighted assets ratio (CRAR), net non-performing assets (NNPA), and return on assets (RoA). The scheme was revised in April 2017. Under the Revised PCA framework, apart from the capital, asset quality and profitability, leverage is being monitored additionally. Under PCA, banks face restrictions on distributing dividends, remitting profits and even on accepting certain kinds of deposits. Besides, there are restrictions on the expansion of branch network, and the lenders need to maintain higher provisions, along with caps on management compensation and directors’ fees. In other words, the entire thrust of the current PCA framwork is to prevent further capital erosion and more importantly, to strengthen them to the point of resilience so that they can, as soon as posible restart their normal operations. Eleven PSBs are currently under the PCA framework. Impairment in the asset quality of these banks remains high, necessitating sizeable provisioning and deleveraging, thereby constraining not only their capacity to lend but also the desirability of their lending and acceptance of public deposits. Profitability and capital position of these banks have seen erosion. An analysis of the NNPA ratios of PCA PSBs vis-à-vis non-PCA PSBs18 revealed that the NNPA ratio of PSBs under PCA was around 12 per cent in March 201819 (Chart 1). The gap between the CRAR of PCA PSBs and non-PCA PSBs has widened over the years (Chart 2). Although non-PCA PSBs are also loss-making currently, the extent of losses made by PCA PSBs has increased further over the years (Chart 3). Leverage ratio of PCA PSBs has been deteriorating steadily since September 2016 (Chart 4).
★ Quarters in which specific PSBs were put under PCA. i.e., 5 banks in quarter ending June 2017, 5 banks in quarter ending December 2017 and one bank in quater ending March 2018.
A projection of GNPA ratios of PCA PSBs as well as non-PCA PSBs is done by applying a similar methodology for each group, by first projecting the slippage ratios (SR) through the multivariate regression model: 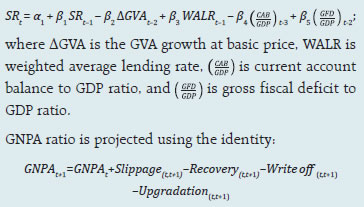
The estimation using the data for the period from June 2002 to March 2018 suggests that the GNPA ratio for PCA PSBs might go up from 21.0 per cent in March 2018 to 22.3 per cent by March 2019, whereas the GNPA ratio of non-PCA PSBs could increase relatively moderately from 13.5 per cent in March 2018 to 14.1 per cent in March 2019 (Chart 5). CRAR of the PCA PSBs as well as non-PCA PSBs is projected using the formula20: 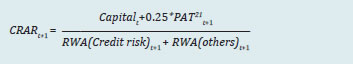
In the absence of further capital infusion (i.e. over and above done till March 31, 2018), CRAR of PCA PSBs may come down from 10.8 per cent in March 2018 to 6.5 per cent by March 2019 under the baseline scenario whereas for the non-PCA PSBs, the CRAR may decline from 12.0 per cent in March 2018 to 10.6 per cent by March 2019 (Chart 6). References: 1. Aggarwal, R. and K. T. Jaques (2001), 'The Impact of FDICIA and prompt corrective action on bank capital and risk: Estimates using a simultaneous equations model', Journal of Banking and Finance 25, 1139-1160. 2. Benston, J. G. and G. J. Kaufman (1997). 'FDICIA after Five Years', Journal of Economic Perspectives 11, 139-158. 3. Elizalde, A., and R. Repullo, (2004). 'Economic and regulatory capital. What is the difference?', CEPR Discussion Papers. 4. Freixas, X. and B. M. Parigi (2007). 'Banking regulation and prompt corrective action', Working Paper No. 2136, CESifo. 5. Reserve Bank of India (2014), Report of the Working Group on Resolution Regime for Financial Institutions, May. |
Sensitivity analysis: Bank level22 2.13 A number of single-factor sensitivity stress tests23, based on March 2018 data, were carried out on SCBs to assess their vulnerabilities and resilience under various scenarios. Their resilience with respect to credit, interest rate, equity prices, and liquidity risks was studied through a top-down24 sensitivity analysis. The same set of shocks was used on select SCBs to conduct bottom-up stress tests. Credit risk 2.14 Under a severe shock of 3 SD25 (that is, if the GNPA ratio of 54 select SCBs moves up from 11.5 per cent to 17.5 per cent), the system-level CRAR will decline from 13.5 per cent to 10.4 per cent and Tier- 1 CRAR will decline from 11.4 per cent to 8.1 per cent (Chart 2.12a). The impairment in capital at the system level could thus be about 25 per cent. The results of reverse stress test show that it requires a shock of 4.28 SD to bring down the system-level CRAR to 9 per cent. Bank-level stress test results show that 20 banks having a share of 59.7 per cent of SCBs’ total assets might fail to maintain the required CRAR under a shock of a 3 SD increase in GNPA ratio (Chart 2.12b). PSBs were found to be severely impacted with the CRAR of 18 of the 21 PSBs likely to go down below 9 per cent in case of such a shock. 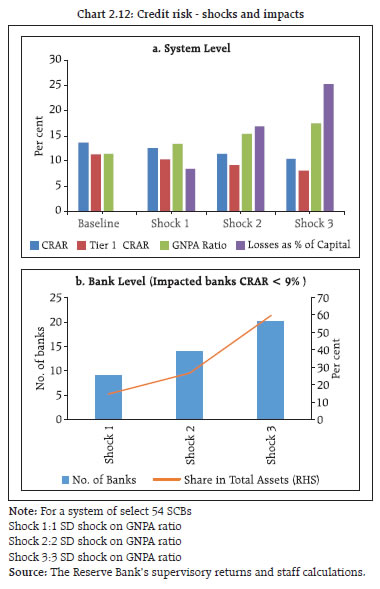 2.15 Distribution of CRAR of select SCBs shows that under a 3 SD shock on the GNPA ratio, PvBs and FBs experienced a less than 4 per cent shift in CRAR while PSBs dominate the right half of the distribution (Chart 2.13). Among PSBs, PCA PSBs experienced larger shifts in CRAR under the shock as compared to non-PCA PSBs, pointing towards the stress underlying in their books making them more vulnerable to shocks (Chart 2.14).
Credit concentration risk 2.16 Stress tests on banks’ credit concentration, considering top individual borrowers according to their stressed advances, showed that in the extreme scenario of the top three individual borrowers failing to repay26, the impact was significant for eight banks. These banks account for 17.4 per cent of the total assets of SCBs. The impact on CRAR at the system level under the assumed scenarios of failure of the top 1, 2 and 3 stressed borrowers will be 63, 99 and 124 basis points respectively (Chart 2.15). 2.17 Stress tests on banks’ credit concentration, considering top individual borrowers according to their exposures, showed that in the extreme scenario of top three individual borrowers failing to repay27, the impact was significant for five banks. These 5 banks account for 9.8 per cent of the total assets of SCBs (Chart 2.16). The impact on CRAR at the system level under the assumed scenario of default by all the top 3 individual borrowers will be 99 basis points. 2.18 Stress tests using different scenarios, based on the information of top group borrowers in the banks’ credit exposure concentration, reveal that the losses could be around 7.0 per cent and 11.8 per cent of the capital at the system level under the assumed scenarios of default by the top group borrower and by the top two group borrowers respectively28. As many as seven banks will not be able to maintain their CRAR level at 9 per cent if top 3 group borrowers default (Table 2.1). | Table 2.1: Credit concentration risk: Group borrowers – exposure | | | System Level* | Bank Level | | Shocks | CRAR | Core CRAR | NPA Ratio | Losses as % of Capital | Impacted Banks (CRAR < 9%) | | Baseline (Before Shock) | 13.5 | 11.4 | 11.5 | --- | No. of Banks | Share in Total Assets of SCBs (in %) | | Shock 1 The topmost group borrower defaults | 12.7 | 10.5 | 15.5 | 7.0 | 3 | 5.9 | | Shock 2 The top 2 group borrowers default | 12.1 | 9.9 | 18.3 | 11.8 | 5 | 9.8 | | Shock 3 The top 3 group borrowers default | 11.6 | 9.3 | 20.7 | 16.0 | 7 | 15.7 | * For a system of select 51 SCBs.
Source: RBI supervisory returns and staff calculations | Sectoral credit risk 2.19 Credit risk arising from exposure to the infrastructure sector (specifically power, transport and telecommunication) as well as textiles and engineering was examined through a sectoral credit stress test where the GNPA ratio of the specific sector was assumed to increase by a fixed percentage point. The resulting impact on the GNPA ratio of the entire banking system was examined. PSBs had the maximum exposure to these sectors and also account for the highest GNPAs, particularly in the power and the telecom sector. The results of the stress tests show that among the considered sectors, the most severe shock to the power sector will cause the banking system GNPAs to rise by about 68 bps. The textile and the engineering sectors, though small in terms of total advances to that sector as compared to the infrastructure sector, also exhibited considerable transmission of stress to the banking sector (Chart 2.17). Interest rate risk 2.20 For investments under available for sale (AFS) and held for trading (HFT) categories (direct impact), a parallel upward shift of 2.5 percentage points in the yield curve will lower the CRAR by about 126 basis points at the system level (Table 2.2). At the disaggregated level, six banks accounting for 9.9 per cent of the total assets could be impacted adversely with their CRAR falling below 9 per cent. The total loss of capital at the system level is estimated to be about 10.4 per cent. The assumed shock of a 2.5 percentage points parallel upward shift of the yield curve on the held to maturity (HTM) portfolios of banks, if marked-to-market (MTM), will reduce the CRAR by about 260 basis points (bps) resulting in 16 banks’ CRAR falling below 9 per cent. | Table 2.2: Interest rate risk – bank groups - shocks and impacts | | (under a shock of 250 basis points parallel upward shift of the INR yield curve) | | (per cent) | | | Public sector banks | Private sector banks | Foreign banks | All SCBs | | AFS | HFT | AFS | HFT | AFS | HFT | AFS | HFT | | Modified duration | 3.6 | 2.5 | 1.7 | 1.7 | 1.4 | 2.2 | 2.9 | 1.9 | | Share in total Investments | 43.7 | 0.0 | 34.0 | 5.4 | 79.4 | 20.6 | 43.7 | 3.0 | | Reduction in CRAR (bps) | 172 | 49 | 143 | 126 | Note: For a system of 48 select SCBs.
Source: The Reserve Bank’s supervisory returns and staff calculations. | 2.21 Yields on 10-year benchmark sovereign debt moved from 7.3 per cent on January 01, 2018 to 7.8 per cent on May 14, 2018. This translates into an approximately 25 bps decline in system-wide CRAR (given their asset positions and durations as at end- March 2018). CRAR of 2 banks may fall below the minimum regulatory requirement of 9 per cent (assuming that they do not spread out their losses across the four quarters). The PV01 values were at ₹ 3.7 billion for PSBs, ₹ 0.6 billion for PvBs and ₹ 0.3 billion for FBs as on end-March 2018. A further upward pressure on the yields may constrain an already stressed profitability of the banking sector. Equity price risk 2.22 Under the equity price risk, the impact of a shock of a fall in equity prices on bank capital and profit was examined. The system-wide CRAR would decline by 40 basis points from the baseline under the stressful 55 per cent drop in equity prices, while the CRAR of three banks will fall below the regulatory requirement of 9 per cent (Chart 2.18). The impact of a drop in equity price is limited for the overall system because of very low regulatory limits prescribed on banks’ exposures to capital markets. Liquidity risk: Impact of deposit run-offs on liquid stocks 2.23 The liquidity risk analysis aims to capture the impact of deposit run-offs and increased demand for the unutilised portions of credit lines which were sanctioned/committed/guaranteed. Banks in general may be in a position to withstand liquidity shocks with their high quality liquid assets (HQLAs)29. In assumed scenarios, there will be increased withdrawals of un-insured deposits30 and simultaneously there will also be increased demand for credit resulting in withdrawal of the unutilised portions of sanctioned working capital limits as well as utilisation of credit commitments and guarantees extended by banks to their customers. 2.24 Using their HQLAs required for meeting day-to-day liquidity requirements, 42 banks will remain resilient in a scenario of assumed sudden and unexpected withdrawals of around 12 per cent of their deposits along with the utilisation of 75 per cent of their committed credit lines (Chart 2.19). Bottom-up stress tests 2.25 A series of bottom-up stress tests (sensitivity analyses) were conducted for the select sample of banks,31 with the reference date as 31 March, 2018. The results of the bottom-up stress tests carried out by select banks also testified to the banks’ general resilience to different kinds of shocks. The bottom-up stress tests show, however, that the impact was more severe for some banks in particular 5 PSBs, especially in case of shocks imparted on NPAs, with their stressed CRAR positions falling below the regulatory minimum of 9 per cent (Chart 2.20). 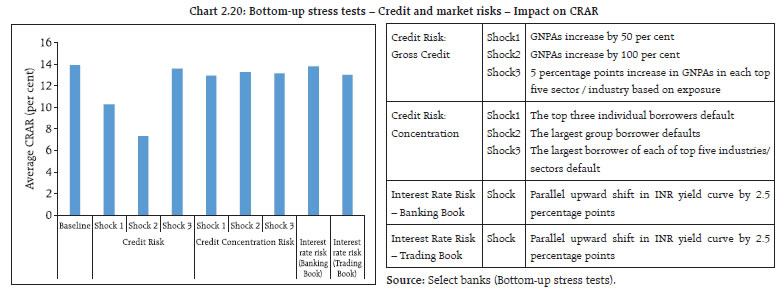 2.26 The results of bottom-up stress tests for liquidity risk show a significant impact of liquidity shocks on select banks. Liquid assets ratios32 reflect the liquidity position of select banks under different scenarios. The results show that HQLAs enable the banks in the sample to sustain themselves against the liquidity pressure from sudden and unexpected withdrawal of deposits by depositors (Chart 2.21). The banks have higher liquid asset ratios when compared to the exercise last year. Stress testing the derivatives portfolio of banks 2.27 A series of bottom-up stress tests (sensitivity analyses) on derivative portfolios were conducted for select banks33 with the reference date as on March 31, 2018. The banks in the sample reported the results of four separate shocks on interest and foreign exchange rates. The shocks on interest rates ranged from 100 to 250 basis points, while 20 per cent appreciation/depreciation shocks were assumed for foreign exchange rates. The stress tests were carried out by applying individual shocks. 2.28 In the sample, the marked to market (MTM) value of the derivatives portfolio for the banks varied with PSBs and PvBs registering small MTM values, while FBs had a relatively large positive as well as negative MTM values. Most of the PSBs and PvBs had positive net MTM, while many FBs recorded negative net MTM values (Chart 2.22). 2.29 The stress test results show that the average net impact of interest rate shocks on sample banks was negligible. The results of foreign exchange shock scenarios showed that the effect of the shock continued to normalise in March 2018 after a previous spike in March 2017 (Chart 2.23) Section II Scheduled urban co-operative banks Performance 2.30 At the system level,34 the CRAR of scheduled urban co-operative banks (SUCBs) remained unchanged at 13.6 per cent between September 2017 and March 2018. However, at a disaggregated level, CRAR of four banks35 was below the minimum required level of 9 per cent. GNPAs of SUCBs as a percentage of gross advances declined from 8.5 per cent to 6.0 per cent and their provision coverage ratio36 increased from 47.1 per cent to 61.8 per cent during the same period. Further, the RoAs of SUCBs declined from 0.9 per cent to 0.6 per cent and the liquidity ratio37 declined from 35.7 per cent to 34.9 per cent during the same period. Resilience - Stress tests Credit risk 2.31 The impact of credit risk shocks on the SUCBs’ CRAR was observed under four different scenarios38. The results show that even under a severe shock of increase in GNPAs by 2 SD, the system-level CRAR of SUCBs remained above the minimum regulatory requirement. At the individual level, however, a number of SUCBs (26 out of 54) may not be able to maintain the minimum CRAR. Liquidity risk 2.32 A stress test on liquidity risk was carried out using two different scenarios; i) 50 per cent, and ii) 100 per cent increase in cash outflows, in the 1 to 28 days’ time bucket. It was further assumed that there was no change in cash inflows under both the scenarios. The stress test results indicate that 25 banks under the first scenario and 40 banks under the second scenario are impacted significantly39. Section III Non-banking financial companies 2.33 As of March 2018, there were 11,402 non-banking financial companies (NBFCs) registered with the Reserve Bank, of which 156 were deposit-accepting (NBFCs-D). There were 249 systemically important non-deposit accepting NBFCs (NBFCs- ND-SI)40. All NBFC-D and NBFCs-ND-SI are subjected to prudential regulations such as capital adequacy requirements and provisioning norms along with reporting requirements. Performance 2.34 The aggregate balance sheet size of the NBFC sector41 as on March 2018 was ₹22.1 trillion. There was deceleration in share capital growth of NBFCs in 2017-18 whereas borrowings grew at 19.1 per cent, implying rising leverage in the NBFC sector. Loans and advances of the NBFC sector increased by 21.2 per cent and investments increased by 13.4 per cent (Table 2.3). | Table 2.3: Aggregated balance sheet of the NBFC sector: y-o-y growth | | (per cent) | | | 2016-17 | 2017-18 | | 1. Share capital | 19.9 | 8.3 | | 2. Reserves and surplus | 16.9 | 19.9 | | 3. Total borrowings | 13.5 | 19.1 | | 4. Current liabilities and provisions | 26.7 | 15.4 | | Total Liabilities / Assets | 15.2 | 18.6 | | 1. Loans and advances | 14.6 | 21.2 | | 2. Investments | 14.8 | 13.4 | | 3. Others | 20.8 | 5.5 | | Income/Expenditure | | | | 1. Total income | 9.7 | 11.9 | | 2. Total expenditure | 14.3 | 9.7 | | 3. Net profit | -14.4 | 30.8 | | Source: The Reserve Bank’s supervisory returns. | 2.35 Net profit increased by 30.8 per cent in 2017-18. RoA was 1.9 per cent in 2017-18 as compared with 1.6 per cent in 2016-17 (Table 2.3 and 2.4). | Table 2.4: Select ratios of the NBFC sector | | (per cent) | | | 2016-17 | 2017-18 | | 1. Capital market exposure to total assets | 8.5 | 7.5 | | 2. Real estate exposure to total assets | 6.3 | 7.5 | | 3. Leverage ratio | 3.4 | 3.5 | | 4. Net profit to total income | 13.4 | 15.6 | | 5. RoA | 1.6 | 1.9 | | 6. RoE | 6.9 | 8.4 | | Source: The Reserve Bank’s supervisory returns. | Asset quality and capital adequacy 2.36 GNPAs of the NBFC sector as a percentage of total advances decreased from 6.1 percent in 2016-17 to 5.8 percent in 2017-1842. 2.37 As per extant guidelines, NBFCs are required to maintain a minimum capital level consisting of Tier-I43 and Tier-II capital, of not less than 15 per cent of their aggregate risk-weighted assets. NBFCs’ CRAR increased from 22.0 per cent in 2016-17 to 22.9 per cent in 2017-18 (Table 2.5). | Table 2.5: Select ratios of the NBFC sector | | (Per cent) | | | GNPA Ratio | NNPA Ratio | CRAR | | 2013-14 | 2.7 | 1.2 | 27.5 | | 2014-15 | 2.9 | 1.6 | 26.2 | | 2015-16 | 4.3 | 2.4 | 23.9 | | 2016-17 | 6.1 | 4.1 | 22.0 | | 2017-18 | 5.8 | 3.5 | 22.9 | | Source: The Reserve Bank’s supervisory returns. | Resilience - stress tests System level 2.38 Stress test on credit risk for the NBFC sector as a whole for the year ended March 2018 was carried out under three scenarios: Increase in GNPA by (i) 0.5 standard deviation (SD), (ii) 1 SD and (iii) 3 SD. The results indicate that in the first scenario, the sector’s CRAR declines from 22.9 per cent to 21.6 per cent. In the second scenario, it declines to 21.3 per cent and in the third scenario it declines to 20.4 per cent. Individual NBFCs 2.39 The stress test results for individual NBFCs indicate that under first two scenarios, around 8 per cent of the companies will not be able to comply with the minimum regulatory capital requirements of 15 per cent. Around 10 per cent of the companies will not be able to comply with the minimum regulatory CRAR norm under the third scenario. Section IV Interconnectedness44 Inter-bank45 market 2.40 The size of the inter-bank market shrank from ₹8.1 trillion in March 2017 to ₹6.5 trillion in March 2018. Inter-bank exposures constituted 4.6 per cent of the total assets of the banking system in March 2018, indicating substantial decline from 9.5 per cent five years ago. The fund-based segment which dominated the inter-bank market had a share of nearly 88 per cent in March 2018 as against 84 per cent in March 2017 (Chart 2.24). 2.41 PSBs continued to be the dominant players in the inter-bank market with a share of 58 per cent (as compared to a share of 65 per cent in total bank assets) followed by PvBs at 30.1 per cent (share of 29 per cent in total bank assets) and FBs at 11.9 per cent (share of only 6 per cent in total bank assets) as on March 2018 (Chart 2.25). 2.42 Composition of short-term (ST) fund based inter-bank exposure shows that the highest share was of ST deposits followed by ST loans. Similarly, the composition of long-term (LT) fund based inter-bank exposure shows that LT loans had the highest share followed by LT debt instruments (Chart 2.26). Network structure and connectivity 2.43 The network structure46 of the banking system47 showed that the number of dominant banks (that is banks in the inner most core) declined from nine to four during March 2012 and March 2018 (Chart 2.27). 2.44 The degree of interconnectedness in the banking system (SCBs), as measured by the connectivity ratio48, increased marginally between March 2017 and March 2018. The cluster coefficient49, which depicts local interconnectedness, has remained almost constant between March 2013 and March 2018 indicating that clustering/grouping within the banking network did not change much over time (Chart 2.28). Network of the financial system50 2.45 From the perspective of the financial system51, SCBs continued to be the dominant players accounting for nearly 46 per cent of the bilateral exposure in March 2018 (51 per cent in March 2017), followed by asset management companies managing mutual funds (AMC-MFs) at 15 per cent (13 per cent in March 2017), non-banking financial companies (NBFCs) at 12 per cent, housing finance companies (HFCs) at 9 percent and insurance companies and all-India financial institutions (AIFIs) at 8 percent each. Pension funds (PFs) accounted for 1 per cent of the bilateral exposure in the financial system and SUCBs for less than 0.5 per cent. 2.46 In terms of inter-sectoral52 exposure, AMC-MFs were the dominant fund providers in the system, followed by the insurance companies, while NBFCs followed by HFCs and SCBs were the dominant receivers of funds. However, within SCBs, PvBs had a net payable position vis-à-vis the entire financial sector, whereas PSBs and FBs had a net receivable position (Chart 2.29 and Table 2.6).
| Table 2.6: Inter-sector assets and liabilities – March 2018 | | (₹ billion) | | Financial Entity | Receivables | Payables | | PSBs | 6841.1 | 3236.2 | | PvBs | 3036.6 | 8512.3 | | FBs | 981.9 | 916.9 | | SUCBs | 126.2 | 31.6 | | AIFIs | 2410.4 | 2665.8 | | AMC-MFs | 8851.8 | 560.4 | | Insurance companies | 5022.1 | 207.4 | | NBFCs | 419.5 | 7169.9 | | PFs | 583.6 | 1.3 | | HFCs | 312.4 | 5283.8 | 2.47 All lenders (that is, those who have a net receivable position against the rest of the financial system) except SUCBs recorded an increase in their net receivable position in March 2018 over March 2017. The increase in the PSBs’ net receivable position indicates their slower credit growth and the consequent channelisation of some of their deposits to other entities in the financial system. Among the borrowers, funds borrowed by NBFCs, PvBs, and HFCs increased between March 2017 and March 2018. In contrast, funds borrowed by AIFIs and FBs decreased; in the case of FBs they decreased to such an extent that they became net lenders to the financial system (Chart 2.30). Interaction between SCBs, AMC-MFs and insurance companies 2.48 The banking sector had an exposure (gross receivable) of nearly ₹323 billion in March 2018 towards the insurance and mutual fund sectors taken together (as against ₹154 billion in March 2017). However, the combined exposure (gross receivable) of AMC-MFs and insurance companies towards the banking sector was much larger (nearly ₹6.2 trillion in March 2018 as against ₹4.8 trillion in March 2017). Exposure of AMC-MFs 2.49 AMC-MFs were the largest net providers of funds to the financial system. Their gross receivables were around ₹8,852 billion (around 41 per cent of their average AUM), and their gross payables were around ₹560 billion in March 2018. Almost all their receivables (99.7 per cent) were fund based in nature. Top three recipients of their funds were SCBs (at 44 per cent) followed by NBFCs (at 26 per cent) and HFCs (at 19 per cent). AMC-MFs were quite active in the money markets (particularly CP and CD markets) with about 45 per cent of their receivables being short-term in nature. The remaining 55 per cent of their receivables were long-term in nature, in which LT debt followed by Capital had the largest shares (Chart 2.31). Exposure of insurance companies 2.50 Insurance companies had gross receivables of ₹5,022 billion and gross payables of around ₹207 billion making them the second largest net providers of funds to the financial system in March 2018. Like AMC-MFs, a breakup of their gross receivables indicates that the top 3 recipients of their funds were SCBs (at 46 per cent), followed by NBFCs (at 28 per cent), and HFCs (at 20 per cent). But in contrast to AMC-MFs, insurance companies had limited exposure to short-term instruments. Around 91 per cent of their receivables were long-term in nature, in which LT debt followed by Capital were the most important (Chart 2.32). Exposure to NBFCs 2.51 NBFCs were the largest net borrowers of funds from the financial system with gross payables of around ₹7,170 billion and gross receivables of around ₹419 billion in March 2018. A breakup of gross payables indicates that the highest funds were received from SCBs (44 per cent of total funds received by NBFCs), followed by AMC-MFs (at 33 per cent) and insurance companies (at 19 per cent). LT debt followed by LT loans and CPs were the three biggest sources of funds for NBFCs (Chart 2.33). Exposure to housing finance companies 2.52 HFCs were the second largest borrowers of funds from the financial system with gross payables of around ₹5,284 billion and gross receivables of only ₹312 billion in March 2018. As on March 2018, HFCs’ borrowing pattern was quite similar to that of NBFCs except that AIFIs also played a significant role in providing funds to HFCs. Like NBFCs, LT debt, LT loans, and CPs were the top three instruments through which HFCs raised funds from the financial markets (Chart 2.34). Contagion analysis53 Joint Solvency-Liquidity contagion analysis for SCBs and SUCBs 2.53 A contagion analysis using network tools was done to estimate the systemic importance of different banks. Failure of a bank which is systemically more important will lead to greater solvency and liquidity losses in the financial system. Solvency and liquidity losses, in turn, depend on the initial capital and liquidity position of the banks along with the number, nature (whether it is a lender or a borrower) and magnitude of the interconnections that the failing bank has with the rest of the banking system. 2.54 In this analysis, banks were hypothetically triggered one at a time and their impact on the banking system is seen in terms of the number of subsequent bank failures that took place and the amount of solvency and liquidity losses that were incurred (Chart 2.35). The assessment of impact of joint solvency54 - liquidity55 contagion was carried out for SCBs and SUCBs together56. 2.55 A contagion analysis of the banking network57 indicates that if the bank with the maximum capacity to cause contagion losses fails (labelled as Bank 1 in Table 2.7), it will cause a solvency loss to the system of about 9.0 per cent of total Tier 1 capital, liquidity loss of 4.2 per cent of total liquid assets, and failure of 15 banks. | Table 2.7: Top 5 banks with maximum contagion impact – March 2018 | | (Joint Solvency-Liquidity Contagion) | | Trigger Bank (SCB) | Number of Defaulting banks | Solvency losses (% of total tier 1 Capital of SCBs and SUCBs) | Liquidity losses (% of total liquid assets of SCBs and SUCBs) | | SCBs+SUCBs | SUCBs | | Bank 1 | 15 | 7 | 9.0 | 4.2 | | Bank 2 | 13 | 7 | 6.2 | 5.5 | | Bank 3 | 8 | 2 | 2.7 | 5.4 | | Bank 4 | 7 | 4 | 2.8 | 3.3 | | Bank 5 | 7 | 5 | 2.4 | 3.4 | Note: Top five ‘Trigger banks’ have been selected on the basis of the number of defaults further triggered by them.
Source: The Reserve Bank’s supervisory returns and staff calculations. | 2.56 On expected lines, analysis also revealed that the failure of a SCB will not only cause further distress to other SCBs but also to SUCBs, whereas, the impact of the failure of a SUCB will be confined to SUCBs only. Solvency contagion impact after macroeconomic shocks to SCBs 2.57 The contagion impact of the failure of a bank is likely to be magnified if macroeconomic shocks result in distress in the banking system in a situation of a generalised downturn in the economy. In this analysis, macroeconomic shocks are given to the SCBs, which cause some of the SCBs to fail the solvency criterion, which then act as a trigger causing further solvency losses. The initial impact of macroeconomic shocks on individual banks’ capital was taken from the macro-stress tests, where a baseline and two (medium and severe) adverse scenarios were considered for March 2019 (Chart 2.8)58. 2.58 The contagion impact on the outcome of the macro stress test shows that additional solvency losses due to contagion (on top of initial loss of capital due to the macro shocks) to the banking system in terms of Tier 1 capital is limited to 2.7 per cent for the baseline, 4.1 per cent for medium stress and 8.4 per cent for the severe stress scenarios. Also, the additional number of defaulting banks due to contagion (on top of initial defaulting banks due to the macro shocks) are zero for baseline, two for medium stress and nine for severe stress scenarios (Chart 2.36).
|