Global financial markets continue to face elevated levels of uncertainty notwithstanding resilience to the outcomes of Brexit referendum and the US election. While the unconventional monetary policy measures have so far fallen short of achieving their intended objectives, most central banks concerned in advanced economies are unlikely to end them abruptly because of limited scope for alternative measures on the fiscal front. A negative feedback loop arising from productivity and global trade slowdowns and rising protectionism is adding to the pessimistic outlook on global recovery. Furthermore, the uptick in US interest rates poses a significant risk to emerging financial markets. While the spillover of global events on the domestic economy may continue to be significant, reduced policy uncertainty, along with tax and legislative reforms will help in realising the benefits from the strong macroeconomic fundamentals. The transition to the nationwide goods and services tax (GST) is guided by the goal of minimal impact on consumer price inflation, even as any reversal in global commodity prices will have to be carefully embedded in the overall considerations of macroeconomic policy. Other initiatives such as the withdrawal of legal tender status of specified bank notes (SBNs) could potentially transform the domestic economy. While the financial performance of the corporate sector has improved in 2016-17, the risk of lower turnover remains. In the external sector, the narrowing of the current account deficit partly reflects the external spillovers in the form of sluggish trade growth. The decline in the flow of remittances is also a concern. Going ahead, capital flow, more than trade, is likely to influence exchange rates. Global backdrop 1.1 The June 2016 issue of the Financial Stability Report (FSR) was released around the time of the Brexit referendum, while this time, the global financial markets are coming to terms after being rattled by the uncertainties over the US election. Although financial markets across the world were significantly impacted immediately after the unexpected outcome of the Brexit referendum, the turmoil turned out to be short lived. This ‘Brexit bounce’ was mainly attributed to timely communication and effective contingency plans by authorities, especially the central banks. Similar resilience was witnessed in global financial markets subsequent to the US election. Subsequently, in early December 2016, the markets appeared to have shrugged off the outcome of referendum over constitutional reforms in Italy. However, there is still a lack of clarity over the long term implications of these mega events and other geo-political challenges (Chart 1.1).  1.2 On its part the US Fed, systemically the most important central bank, has been continuously trying to prepare markets for reversal of the extant monetary policy stance, even as concerns related to financial stability amidst possibilities of extreme market reactions were still seen to be influencing the monetary policy decisions. Its decision in December 2016 to increase interest rates comes with a relatively clearer recognition of improved prospects for labour market and economic growth. It is noteworthy that the preceding period of almost one year since the last increase in December 2015 was marked by a tendency to retreat from the expected course based on previous guidance linked to economic data. Nevertheless, the FOMC’s December 2016 statement has been perceived as hawkish. Uncertainty has been reflected in the volatility in probability of interest rate changes during the period (Chart 1.2). 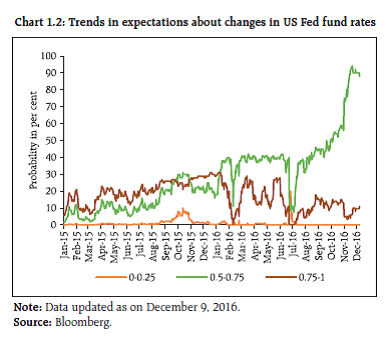 1.3 Asset prices were also seen to be influenced by the heightened risk appetite levels as search for higher yields is still evident (Chart 1.3). Although, there had been a hardening of yields in the US ahead of the Fed meeting in December 2016, the 10 year US treasury yields are still below the levels seen during the ‘taper tantrum’ in 2013. Political risks are playing out differently on bond prices in different jurisdictions, as could be seen in the US after the elections and in the UK post Brexit. 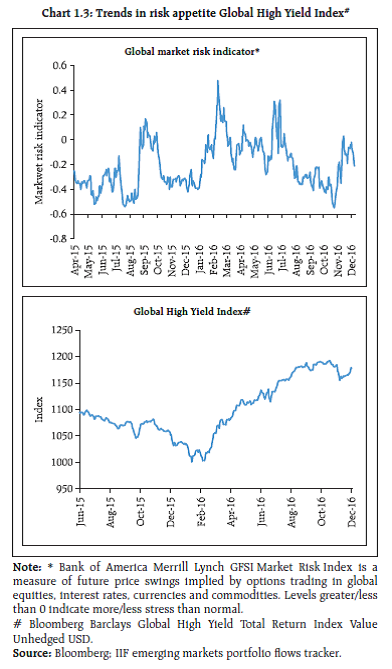 1.4 Meanwhile, a debate is raging over the efficacy of monetary policy and the need to shift focus to fiscal policy. For instance, the monetary policy stimulus seems to be hitting a cul de sac in Japan, and the Eurozone banks seem to be showing little interest in targeted longer-term refinancing operations (TLTRO)1 despite the European Central Bank (ECB) offering substantial incentives to borrowing banks. Such instances also highlight the financial frictions that are coming in the way of desired monetary policy transmission. Rather, the considerably large size of the fiscal stimulus required2 – seen against the constrained fiscal space in many economies – may incentivise the political economy to continue to rely on a loose monetary policy stance. For instance, ECB’s recent decision to cut monthly bond buying programme, while extending the life of QE also confirmed the dilemmas within the common currency area. Besides, the efficacy and quantum of fiscal stimulus required may also depend upon the ‘multiplier’ of the intended fiscal measures3. 1.5 For the real economy, tapering benefits from wage arbitrage and the unintended effects of automation aimed at scaling up efficiency, are showing profound impact on labour market dynamics. Prolonged recession has also led to some structural damage to the labour market4. In addition, a slowdown in productivity growth (Chart 1.4) has contributed to weak economic growth, probably on account of a credit boom-induced reallocation of labour into lower productivity growth sectors.5 Thus, this context also calls for alternative solutions to lessen the burden on monetary policy. 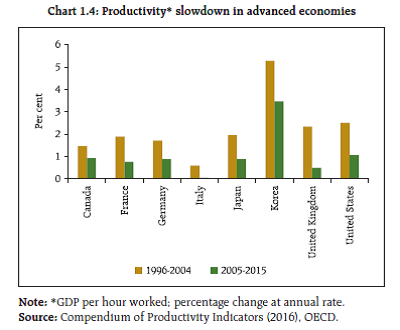 1.6 The last FSR had emphasised the need for assessing the growth trends in world trade in terms of volume as well as in terms of values measured in US dollars. Global trade in volume terms has been stagnant since 2015 (Chart 1.5). While the view that the creeping protectionism has started dragging the growth in world economy is gaining traction, the long-term trends, such as the shortening of global supply chains, demographics and the increasing role of digital trade, could also be playing an important role. However, there is enough evidence that growing non-trade barriers and opposition to trade pacts are compelling businesses to change their strategies from globalisation to ‘localisation’ – not on the basis of sound economic logic of cost-benefit analysis but out of respect for political economy compulsions. Whether the resultant cost-push inflation is desirable for those countries looking for higher inflation is a moot point. 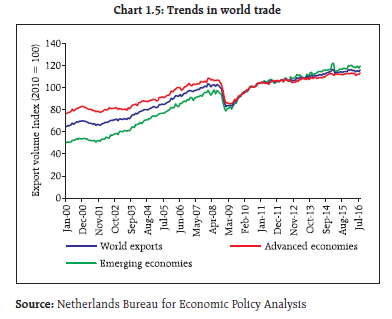 1.7 With slack in demand, growing corporate savings too is a matter of concern. There is some evidence of the strong link between corporate net lending and macroeconomic performance suggesting significant leakages from aggregate demand6 (Chart 1.6). In the broader context, there is a need to address the growing pessimism, given the potentially influential role played by sentiments in shaping future outcomes (Box 1.1). Box 1.1: Countercyclical Thinking The response to the global financial crisis, to some extent, has resulted in an emphasis on ‘de-risking’ for the sake of financial stability. However, global financial markets play by the cardinal principle of regulatory dialectics (see FSR, June 2013), and risk taking is an inherent part of financial market activity. Whether the re-regulation is able to strike a balance between risk appetite and risk capacity sufficiently is a moot point. It is possible that the practitioners of finance may become hostage to established theories and concepts generating ‘self-fulfilling prophesies’ that tend to lean towards pessimism in the current scenario. For instance, issues such as corporate leverage, dwindling capex, gaps in pension funds, interpretation of market liquidity and dependence on market forecasts, probably, need to be discerned differently. First, corporate leverage per se is neither good nor bad. However, leverage amplifies both the good and bad outcomes of corporate financial decisions depending on whether the income generating capacity is higher than the cost of capital, and whether the productivity of the assets financed by leverage is growing faster than the pace of income growth. In any case, ‘financing’ decisions may not always capture these outcomes ex-ante. Similarly, the secular decline in capex needs to be viewed against the changing structure of many economies, where capex is shifting to less capital intensive sectors such as technology and R&D, reflecting an effort at improving the efficiency of capital. Then, given the ultra-low or negative interest rates, there are worries over pension fund deficits. Not that these concerns are misplaced but is there an alternative way of looking at the problem? It has been suggested that there should be a move away from market based valuation (using the ‘risk free’ yield). Given the contributions made to the fund (the principal) and future benefits (the present value of cash flows at the time of retirement), one can calculate the accrual rate which in turn can be used to arrive at the present value of the fund’s liabilities that can be matched with the market value of the assets held. Technological advances and constant information flows are also changing the way in which volatility used to be viewed. Even as the jury is still out on the reasons for the fall of the British pound during the illiquid ‘graveyard shift,’7 the increased frequency and size of market moves need to appreciate the dynamics of market liquidity and impact costs. In other words, traders and electronic trading mechanisms can add as much to liquidity as they take it away. Lastly, the role and credibility of market forecasts as an aid for decision making needs to be rethought, especially in the light of the experience with the Brexit and the US presidential polls. The market gyrations around these events indicate that the influence of uncertainty and expectations around potentially disruptive outcomes of certain events on market moves may exceed the actual effect on the market when the same unexpected outcomes become realities ex post. References 1. Michael J. Mauboussin, Dan Callahan, Darius Majd (2015), ‘Capital Allocation: Evidence, Analytical Methods and Assessment Guidance’, Credit Suisse. 2. Con Keating, Ole Settergren, Andrew Slater (2012), ‘Keep your lid on! A financial analyst’s view of the cost and valuation of DB pension provision’, Long Finance. Domestic economy 1.8 Given the global backdrop, the spillovers to the domestic economy and financial markets are significant though not insurmountable in view of the continued strength of macro fundamentals. One redeeming feature of Indian economy is the relatively lower levels of policy uncertainty (Chart 1.7). The consensus arrived at in implementing the nationwide goods and services tax (GST) has been a significant development with a huge potential for promoting domestic trade and growth. The enactment of the national bankruptcy law is another significant reform, though commensurate steps for capacity building will be the key to effective implementation of these measures. Pressure on the rupee on account of redemption of foreign currency deposits – raised towards the end of 2013 to contain rupee volatility – has been dealt with relative ease. The ‘one time fund infusion scheme’ approved by the Indian government will enable the National Highways Authority of India (NHAI) to extend loans to eligible, languishing road projects to ensure their completion on a priority basis. India’s ranking in the Global Competitiveness Index for 2016-17, released by the World Economic Forum (WEF), improved 16 places to 39, making it the fastest riser up the ranks among 138 countries surveyed. This is the second year in a row that India has jumped 16 spots. India also ranks 130 out of 189 countries in the ease of doing business released by World Bank, moving up four places from last year’s adjusted ranking of 134. The newly started ranking of states8 in terms of their business-friendly policies could encourage a healthy competitive environment in the Indian federal structure leading to further improvement in the country’s international rankings on these parameters. 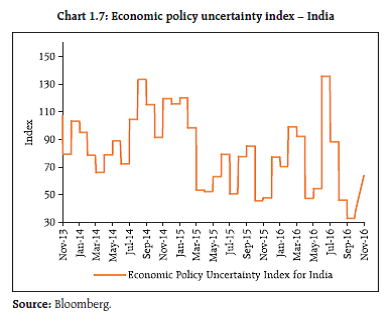 1.9 Amidst this, the government’s resolve to take on the shadow economy (Box 1.2) through various measures are expected to deliver net direct and collateral benefits to the economy in the long run, and will also improve India’s international standing. Such measures include, among others, the income disclosure scheme, setting up of a Special Investigation Team (SIT), enacting a law regarding undisclosed foreign income and assets, amending the Double Taxation Avoidance Agreement between India and Mauritius and India and Cyprus, reaching an understanding with Switzerland for getting information on bank accounts held by Indians9 and amending the Benami Transactions Act. Further, the initiatives for encouraging the use of non-cash and digital payments and withdrawal of legal tender status of specified bank notes (SBNs), accompanied by changes in income tax rules are expected to result in a shift away from the significant dependence of Indian economy on cash-based transactions10. Output growth, external trade and inflation 1.10 In 2016-17:Q2, real gross domestic product (GDP) at market prices showed a higher growth of 7.3 per cent as compared with 7.1 per cent in the previous quarter. GDP growth rate, however, was lower as compared to the corresponding quarter of previous year, largely due to contraction in fixed investment. Capex spending remains a concern due to excess available capacity and financial stress in large brown field projects, especially in sectors such as iron and steel, construction, textiles and power amidst an environment of fragile global growth. Growth in exports and contraction in imports continued in 2016-17:Q2 (Chart 1.8). However, downside risk to export demand remains. Box 1.2: System D In recent literature and usage, shadow economy is also referred to as System D. Though estimating the size of the shadow economy is challenging, according to the Organisation for Economic Co-operation and Development (OECD) half of the world’s workers were employed in the shadow economy in 2009 (this number is likely to grow to two-thirds by 2020). According to an article published in Foreign Policy, the global black market approximately valued at US$ 10 trillion, is the world’s second largest “economy” and is also the fastest growing one (Neuwirth, 2011). The term shadow economy may refer to black economy or black money. There is no uniform definition of black money in economic theory and various other terms such as ‘unaccounted income’, ‘black income’, ‘dirty money’, ‘black wealth’, ‘underground wealth’, ‘black economy’, ‘parallel economy’ are also used in this regard. In the Indian context, the White Paper on Black Money, released by Department of Revenue, Ministry of Finance in 2002 adopted a definition of black money “as assets or resources that have neither been reported to the public authorities at the time of their generation nor disclosed at any point of time during their possession.” One of the many problems with the shadow economy is that it renders official statistics unreliable and severely impacts policy formulations by governments. Besides, the loss of tax revenues may force governments to hike tax rates, which in turn may further encourage greater activity in the shadow economy. As per some analyses, in the US a 1 percentage point increase in personal income tax rates, other things being equal, tends to increase the size of the shadow economy by 1.4 percentage points. Similarly, a 1 point increase in a regulation index (ranging from 1 to 5) corresponds to a 10 per cent increase in the shadow economy. There is also evidence in some economies of dynamic mobility between the official and shadow economies depending on the relative ‘net’ wage levels; this in turn is an indication of the influence of tax rates and rigidities in labour markets on the size of the official versus shadow economies. While the impact of the shadow economy on direct tax revenues is a concern, its role in contributing to indirect taxes and economic growth is debatable. The best way to contain the shadow economy is to improve governance and quality of public services, avoid excessive regulations, impose stringent penalties and have a compatible tax structure. References: 1. Neuwirth, Robert (2011), Stealth of Nations: The Global Rise of Informal Economy. 2. Schneider, Friedrich and Dominic Enste (2002), Hiding in the Shadows; The Growth of the Underground Economy. The International Monetary Fund. 1.11 The overall consumption expenditure picked up sharply in 2016-17:Q2 steered by both private final consumption expenditure (PFCE) and government final consumption expenditure (GFCE). Downside risks to GDP growth in the near term persist through short-term disruptions in economic activity in cash-intensive sectors amid withdrawal of legal tender status of SBNs (Reserve Bank of India (2016), Fifth Bi-monthly Monetary Policy Statement, 2016-1711). 1.12 The immediate financial impact of withdrawal of SBNs, announced on November 8, 2016 was a surge in bank deposits with a commensurate fall in currency in circulation. In terms of macroeconomic impact, there is a dampening effect on inflation with a temporary loss of momentum in the growth of real gross value added (GVA). The Reserve Bank has revised downward the GVA growth for 2016-17 to 7.1 per cent from 7.6 per cent, with evenly balanced risks. However, the precise impact of the same on the economy may be difficult to capture at this stage and the disruptions in the cash intensive sectors of the economy are likely to be transitory. In the interim, policy measures to sterilise the impact of excess liquidity resulted in higher investment in government securities by the banking system and a fall in Reserve Bank’s investments in government securities as also credit to commercial banks. Notwithstanding the short-term disruptions in certain segments of the economy, withdrawal of SBNs is expected to significantly transform the domestic economy in the long run in terms of greater intermediation and increasing efficiency gains through adoption of digital modes of payments 1.13 Retail inflation measured by consumer price index (CPI) eased, though inflation in sugar and protein-rich items such as pulses remained elevated. Normal monsoon conditions and pro-active supply management measures by the Government significantly helped in reining in the food inflation (Chart 1.9). However, stickiness in CPI inflation-excluding food and fuel, could set a floor to headline inflation12. Going ahead, unfavourable base effect, likely firming up of crude prices after the agreement between OPEC and non-OPEC countries on production cut and exchange rate volatility emanating from external factors may result in inflationary pressures. Impact of GST and 7th central pay commission (CPC) award on inflation 1.14 In the CPI basket, a majority of the items (food group) are outside the purview of GST.13 Although a partial impact on services may be observed post its implementation, the framework put in place for GST is guided by the principle that the transition should have a minimal impact on CPI inflation. 1.15 Among the recommendations of the 7th central pay commission (CPC), the government is yet to decide on accepting the hike in allowances. The implementation of house rent allowance (HRA) will affect the magnitude of the direct effect of house rent on CPI but this will largely be statistical in nature. The indirect impact arising out of aggregate demand effects and rise in inflation expectations, however, may warrant some caution. Fiscal deficit 1.16 As per the union budget, fiscal deficit was projected at 3.5 per cent of GDP during 2016-17. While lower-than-expected revenues through disinvestments and telecom spectrum auctions may stretch the fiscal deficit, the additional revenue from measures such as income disclosure schemes may compensate for this. Though the short-term impact of the measures undertaken to contain the shadow economy and tax evasion, both in terms of changes in GDP and revenues, is difficult to capture, these measures are expected to have a positive impact both on GDP and on fiscal deficit in the long run. External sector indicators 1.17 India’s external sector vulnerability indicators improved in 2016-17:Q1. The current account deficit has narrowed to 0.6 per cent in 2016-17:Q2 from 1.1 per cent of GDP in 2015-16. External debt – both in absolute and relative terms (as ratio to GDP), has declined and the foreign exchange reserves now cover a larger portion of total external debt and about 11 months of imports (Chart 1.10). 1.18 One potential source of stress in India’s balance of payments is the decline in the flow of remittances. Globally, remittance flows are expected to increase only marginally in 2016.14 Projections suggest a decline in remittances only in the case of India in the top five remittance receiving countries. A major portion of remittances to India originate from the Gulf countries (Chart 1.11). Low oil prices, subdued growth in source countries and change in labour policies in some Gulf Cooperation Council (GCC) countries, among other factors, have adversely affected such flows to India. Credit flow to the commercial sector 1.19 While growth in bank credit has continued to decline (see Chart 2.1, Chapter II), corporate debt issuance has shown robust trends (Chart 1.12a). The total flow of resources from the financial sector to the commercial sector remained sluggish during the first half of the current financial year, mainly due to the reduced contribution from banks (Chart 1.12b). The overall resource mobilisation through the primary securities market witnessed increase during the first half of financial year 2016-17 as compared to the corresponding period of previous financial year, especially in the public and rights issuance of debt securities (Chart 1.13). Asset prices Stock prices 1.20 The NSE-Nifty, one of India’s major benchmark indices, outperformed both the MSCI World and Emerging Market indices from the beginning of this financial year till November 2016 (Chart 1.14 a). The NSE Volatility Index was also observed to remain in a relatively narrow range as compared to the S&P Volatility Index for the US markets during the period since April 2016 till November 2016 (Chart 1.14 b). Bond markets and currency movements 1.21 The Indian bond market has witnessed a long rally during the six months till early October 2016, when foreign investors started selling Indian bonds (along with the bonds in other EMEs) seeking to reduce exposure to EME assets amid rising probability of a Fed interest rate increase in December 2016 (Chart 1.15 a). With the strengthening of US dollar against most of the emerging market currencies, the Indian rupee has also been under pressure since November 2016 (Chart 1.15 b). 1.22 The net foreign portfolio investments (FPIs) in Indian markets turned negative during 2015-16. Notwithstanding the increased significance of the domestic MFs in Indian capital markets, the FPIs continue to play an important role in the swings of equity, bond and currency markets (Chart 1.16). House prices 1.23 The all-India house price index posted an annual increase of 7.3 per cent in 2016-17:Q1 after moderation over four consecutive quarters (Chart 1.17). The push to regulate the realty sector is likely to have an impact on housing finance segments as it may help curb speculative activities significantly. While the stressed advances ratio in the retail housing sector increased slightly in recent quarters, still there are no systemic risk concerns from this sector. Corporate sector 1.24 The half-yearly positions of select non-government non-financial (NGNF) listed companies15 indicate marked improvement in the performance of the corporate sector on a y-o-y basis (Table 1.1). As per the implementation road map for adoption of Indian Accounting Standards (Ind AS) – which are converged with the International Financial Reporting Standards (IFRS), all companies, other than insurance, banking and non-banking finance companies, having net worth of ₹5 billion or above were required to prepare their financial statements as per Ind AS from 2016-17 onwards. Therefore, the Ind AS-based financial statements for the current period (half year ended on September 30, 2016) may not be strictly comparable with the results of earlier periods. Corporate leverage16 Trend 1.25 During the period of September 2015 to September 2016, 42.2 per cent of NGNF listed companies in the select sample witnessed deleveraging, while the total borrowings remained the same for another 17.3 per cent of the companies. Though the total borrowings increased for only 40.4 per cent companies, the growth of total borrowings of such companies was much higher than the reduction in total borrowings of companies which deleveraged, thus influencing the total borrowings of the companies in the sample (Table 1.2). | Table 1.1: Select financial ratios of performance of NGNF listed companies | | | First-half of 2014-15 | Second-half of 2014-15 | First-half of 2015-16 | Second-half of 2015-16 | First-half of 2016-17 | | Sales growth (y-o-y) (per cent) | 5.8 | -2.3 | -3.5 | 2.2 | 1.9 | | Net profit to average* total asset (per cent) | 2.6 | 1.9 | 2.6 | 2.1 | 3.1 | | Solvency ratio & (per cent) | 13.8 | 12.1 | 14.5 | 12.9 | 18.3 | | Debt to equity ratio # | 0.38 | 0.39 | 0.38 | 0.38 | 0.32 | | Interest coverage ratio $ (number of times) | 5.8 | 4.9 | 5.4 | 5.0 | 5.8 | | Interest payment^ to average* borrowings (per cent) | 10.1 | 10.1 | 10.3 | 10.0 | 9.3 | Note: * Average is based on outstanding opening and closing positions for the half year.
& Solvency ratio is defined as sum of profit after tax (PAT) and depreciation to total borrowings (long and short term).
# Debt is taken as long term borrowings and equity is the net worth.
& ICR is defined as EBITDA to interest expense ratio, where EBITDA is earnings before interest, taxes, depreciation and amortisation, which is derived as EBITDA = EBIT + depreciation and amortisation. EBIT is earnings before interest and taxes.
^ Annualised interest payment is used.
Source: RBI (Half-yearly statements of select NGNF listed companies). |
| Table 1.2: NGNF listed companies: Change in corporate debt | | (per cent) | | Comparison of total borrowings of individual companies in two periods | No. of Companies | Total borrowings | | Share in Sep-15 | Share in Sep-16 | Growth (y-o-y) | | Companies showing a decrease in total borrowings | 42.2 | 41.0 | 31.9 | -16.1 | | Companies showing an increase in total borrowings | 40.4 | 58.8 | 67.9 | 24.5 | | Companies showing no change in total borrowings | 17.3 | 0.2 | 0.2 | 0.0 | | Total | 100.0 | 100.0 | 100.0 | 7.8 | Note: 1. For common companies.
2. Debt is taken as total borrowings.
Source: RBI (Half-yearly statements of select NGNF listed companies). | Tail risk 1.26 The proportion of ‘leveraged’ companies in the sample [defined as those either with negative net worth or debt to equity ratio (DER) >=2], though marginally up from March 2016 position, has remained much lower at 14.5 per cent in September 2016 as compared to 19.4 per cent in September 2015. The share of such companies in the total debt has declined further to 16.0 per cent in September 2016 from 20.6 per cent in March 2016 which was 30.5 per cent in September 2015. Similarly, the proportion of ‘highly leveraged’ companies (defined as ‘leveraged’ companies with DER>=3) declined from 15.3 per cent to 13.5 per cent with the share of debt of these companies in the total debt coming down from 24.9 to 14.5 per cent (Table 1.3). Debt servicing capacity 1.27 An analysis of the current trends in debt servicing capacity and leverage of ‘weak’ companies [defined as those having interest coverage ratio (ICR) <1] was undertaken using the same sample, which shows significant improvement in 2016-17. The analysis shows that 14.1 per cent of companies were ‘weak’ in the select sample as at end September 2016, compared to 15.8 per cent in September 2015. The share of debt of these ‘weak’ companies also fell sharply to 14.7 per cent of total debt in the first half of 2016-17 from 27.3 per cent in the first half of 2015-16. However, the DER of these ‘weak’ companies increased to 2.1 from 1.7. The proportion of ‘leveraged weak’17 companies sharply declined to 1.4 per cent from 2.4 per cent during this period. The share of debt of ‘leveraged weak’ companies also declined significantly to 3.7 per cent from 11.8 per cent (Chart 1.18). 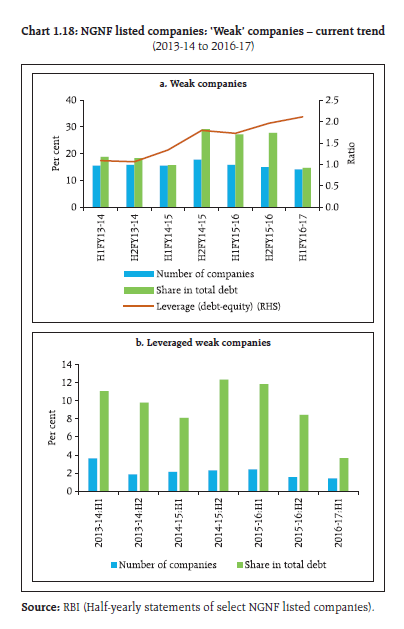
| Table 1.3: NGNF listed companies: Tail risk in corporate leverage | | (per cent) | | Leverage | Number of companies
(as percentage of total companies) | Share of debt to total debt | | Mar'15 | Sep'15 | Mar'16 | Sep'16 | Mar'15 | Sep'15 | Mar'16 | Sep'16 | | Negative Net worth or DER >= 2 | 19.0 | 19.4 | 14.0 | 14.5 | 33.8 | 30.5 | 20.6 | 16.0 | | Negative Net worth or DER >= 3 | 14.2 | 15.3 | 12.9 | 13.5 | 23.0 | 24.9 | 19.0 | 14.5 | | Source: RBI (Half-yearly statements of select NGNF listed companies). | Sectoral analysis of corporate leverage 1.28 The total borrowings by companies in chemical, computer, food products, hotel, rubber and textiles industries decreased during the period from September 2015 to September 2016. On the other hand, cement, construction, electrical machinery, power, iron & steel, jewellery, mining, automobiles, papers, pharmaceuticals, real estate, telecommunications and transport industries contributed towards an increase in total borrowings (Chart 1.19). 1.29 A risk profile of select industries as at end September 2016 showed that iron & steel and power industries had high leverage as well as interest burden18. Telecommunication and transport industries also had relatively high leverage (Chart 1.20). Trends in pledging of shares by promoters and credit rating downgrades 1.30 The stress in corporate debt is also supported by data on the shares pledged by promoters. The percentage of shares pledged by promoters out of their holdings in all listed companies across NSE and BSE has shown a gradual increasing trend over the years. Across all NSE listed companies (including companies with no pledging), the percentage of promoter held shares pledged went up from 15.2 per cent in March to 15.3 per cent in June 2016. The corresponding numbers were 13.8 per cent in December 2013, 14.4 per cent in December 2014 and 14.8 per cent in December 2015. 1.31 An analysis of the trends in credit ratings (quarterly data from December 2015 to September 2016) of corporate debt instruments rated by three major CRAs in India shows significant improvements in ‘upgraded’ ratings from 3.3 per cent of the total rated instruments in December 2015 to 8.9 per cent in September 2016 (Chart 1.21). Simultaneously, there has been a decline in ‘downgraded’ ratings from 7.5 per cent to 3.1 per cent during the same period. Corporate sector risks 1.32 The corporate sector stability indicator and map19 indicate that the overall risks to the corporate sector, which increased after the global financial crisis during 2007-08, have shown moderation in recent past. However, the risks due to lower demand (turnover)20 remain (Charts 1.22).
1 Targeted longer-term refinancing operations (TLTRO-II). 2 Biven, Josh (2016), ‘Why is recovery taking so long – and who’s to blame?’ Economic Policy Institute, August. 3 For instance, impact of tax cuts may be different from that of fiscal spending on infrastructure. 4 Reifschneider, Dave, William Wascher, and David W. Wilcox (2015). ‘Aggregate Supply in the United States: Recent Developments and Implications for the Conduct of Monetary Policy,’ IMF Economic Review, vol. 63 (May). 5 Borio, C., E. Kharroubi, C. Upper, and F. Zampolli (2016). ‘Labour reallocation and productivity dynamics: financial causes, real consequences’, BIS Working Papers No. 534, January. 6 Gruber, Joseph W., and Steven B. Kamin (2015). ‘The Corporate Saving Glut in the Aftermath of the Global financial Crisis’, International Finance Discussion Papers 1150. 7 The sharp fall of the pound during early October 2016 happened during Asian trading hours when the US and European traders were away. 8 ‘Ease of Doing Business Reforms Ranking 2015-16,’ conducted by the Department of Industrial Policy and Promotion (DIPP), Government of India and the World Bank. 9 With respect to the Hong Kong and Shanghai Banking Corporation (HSBC). 10 (Source:http://finmin.nic.in/press_room/2016/press_cancellation_high_denomination_notes.pdf). 11 Reserve Bank of India (2016), Fifth Bi-monthly Monetary Policy Statement, 2016-17, available at https://rbi.org.in/Scripts/BS_PressReleaseDisplay.aspx?prid=38818 12 Reserve Bank of India (2016), Fifth Bi-monthly Monetary Policy Statement, 2016-17. 13 Edited transcript of the Reserve Bank of India’s post-policy conference call with the media, August 9, 2016. 14 World Bank (2016), ‘Trends in Remittances, 2016: A New Normal of Slow Growth’, October 6. (http://blogs.worldbank.org/peoplemove/trends-remittances-2016-new-normal-slow-growth%20). 15 Based on half-yearly data of about 2,400 to 2,700 NGNF listed companies starting from half-year ended September 2013. A common set of companies have been taken while calculating growth and doing other comparisons. 16 For the analysis of corporate leverage, debt to equity ratio has been used, where debt is taken as long term borrowings and equity is the net worth. However, to look at the overall deleveraging trend of companies (in terms of growth and share), total borrowings (long and short term) has been used for comparison. 17 Companies with DER >= 2 were classified as ‘leveraged’. The ‘leveraged weak’ companies are those with DER >=2 or having negative net worth among the ‘weak’ companies. ‘Leveraged’ companies include companies having negative net worth as these companies would also have solvency issues. 18 Interest burden is defined as the interest expense as a percentage of EBITDA. 19 From 1992-93 to 2011-12 annual balance sheet data have been taken, while from 2012-13 to 2016-17, the half-yearly data have been used. The detailed methodology and basic indicators used under different dimensions are given in Annex 2. 20 Turnover is derived as sales to assets ratio. |