The business of scheduled commercial banks (SCBs) slowed significantly during 2015-16. The gross nonperforming advances (GNPAs) ratio increased sharply, largely reflecting reclassification of restructured standard advances as non-performing. Consequently, the restructured standard advances ratio declined but with a marginal increase in the overall stressed advances ratio from 11.3 per cent in September 2015 to 11.5 per cent in March 2016. The capital to risk-weighted assets ratio (CRAR) of SCBs showed some improvement. Public sector banks (PSBs) continued to record the lowest CRAR among the bank groups with steep decline in their profitability. Asset quality of scheduled urban co-operative banks (SUCBs) as well as non-banking financial companies (NBFCs) improved. The performance of NBFC sector in general is relatively better than that of PSBs. As per the banking stability indicator, risks to the banking sector increased significantly during the second half of 2015-16 due to deteriorating asset quality and lower profitability. While stress tests reveal resilience, the system could become vulnerable if the macroeconomic conditions were to deteriorate sharply. Given the higher level of balance sheet impairment, banks may remain risk averse for some more time as their focus would be on strengthening balance sheet. Moreover, their capital position may impact their ability to meet credit delivery. Section I Scheduled commercial banks1 2.1 In this section, the soundness and resilience of scheduled commercial banks2 (SCBs) are discussed under two broad sub-heads: a) performance on functional aspects, and b) resilience using macrostress tests through scenarios and single factor sensitivity analysis. Performance Credit and deposit growth 2.2 Overall credit and deposit growth of SCBs remained in single digits because of subdued performance of the public sector banks (PSBs). Credit growth of all SCBs, on a y-o-y basis, declined to 8.8 per cent in March 2016 from 9.4 per cent in September 2015 while the growth in deposit declined to 8.1 per cent from 9.9 per cent. The relative performance of bank groups reflects their respective strengths amidst on-going industry-wide balance sheet repair and also sluggish growth in private capex (Chart 2.1). Capital, leverage and risk-weighted assets 2.3 The capital to risk-weighted assets ratio (CRAR) of SCBs at the system level as well as bank-group level increased between September 2015 and March 2016. However, the Tier-I leverage ratio3 remained unchanged at 6.8 per cent during the same period (Chart 2.2). 2.4 The risk-weighted assets (RWAs) density4 of all SCBs, which was showing an upward trend earlier, declined from 67.2 per cent to 63.7 per cent between September 2015 and March 2016. The decline was broad based (Chart 2.3). Asset quality 2.5 The gross non-performing advances5 (GNPAs) of SCBs sharply increased to 7.6 per cent of gross advances from 5.1 per cent between September 2015 and March 2016 after the asset quality review (AQR) [see paragraphs 3.8 to 3.9 in Chapter III]. A simultaneous sharp reduction in restructured standard advances ratio from 6.2 per cent to 3.9 per cent during the same period resulted in the overall stressed advances6 ratio rising marginally to 11.5 per cent from 11.3 per cent during the period. PSBs continued to hold the highest level of stressed advances ratio at 14.5 per cent, whereas, both private sector banks (PVBs) and foreign banks (FBs), recorded stressed advances ratio at 4.5 per cent (Chart 2.4). 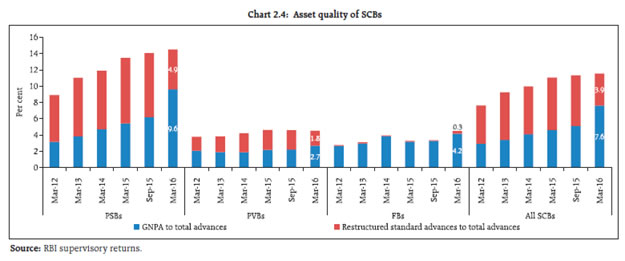 2.6 The net non-performing advances (NNPAs) as a percentage of the total net advances for all SCBs increased considerably to 4.6 per cent from 2.8 per cent between September 2015 and March 2016. At the bank group level, the NNPA ratio increased from 3.6 per cent to 6.1 per cent for PSBs, from 0.9 per cent to 1.3 per cent for PVBs and from 0.5 per cent to 0.8 per cent for FBs during the same period (Chart 2.5). 2.7 Subsequent to AQR, the banking sector GNPAs showed a sharp y-o-y increase of 79.7 per cent in March 2016. Large increases were observed across bank-groups (Chart 2.6). 2.8 Probability density functions show that a significant number of banks shifted from lower GNPA ratios to higher GNPA ratios during the last year, whereas, distribution of banks based on the stressed advances ratio did not change much. This suggests that increasing proportion of restructured advances are reckoned as non-performing (Chart 2.7). 2.9 Amongst major sectors, the industrial sector showed a decline in the stressed advances ratio from 19.9 per cent to 19.4 per cent between September 2015 and March 2016, though the GNPA ratio of the sector increased sharply to 11.9 per cent from 7.3 per cent. Retail loans continued to witness the least stress (Chart 2.8). 2.10 Among the major sub-sectors within the industrial sector, ‘basic metal and metal products’ accounted for the highest stressed advances ratio as of March 2016 followed by ‘construction’ and ‘textiles’. It is notable that the stressed advances ratio of the ‘infrastructure’ sector declined to 16.7 per cent from 21.8 per cent between September 2015 and March 2016 (Chart 2.9). 2.11 On the other hand, annual slippages of major sectors/sub-sectors in December 20157 show that the textiles industry had the highest number of standard accounts slipping into the NPA category at 8.8 per cent, followed by the cement industry at 8.0 per cent. In terms of outstanding amounts, the iron and steel industry saw the highest slippages at 7.8 per cent followed by textiles at 6.4 per cent (Chart 2.10). In this context, to address the prevailing stress in various sectors, the Government has taken several measures (Box 2.1). Box 2.1: Stress in banking sector - Recent measures taken by the Government The Government has taken many initiatives to expedite recovery of bad loans. The initiatives include establishment of six new Debt Recovery Tribunals (DRTs) as also those mentioned below: In the case of distressed steel sector, import duty for steel products was increased, additional safeguard duty was imposed and a minimum import price was stipulated. In addition, auction of long term coal linkages is being envisaged. In order to address the issue of stalled projects in the case of road sector, provisions were made to substitute ‘concessionaire’ at the instance of lenders through approval by National Highways Authority of India (NHAI) to provide exit even during construction period. Concessionaires were also permitted to divest 100 per cent equity two years after commercial operational date (COD). Further NHAI would intervene with one time fund infusion in languishing projects affected by lack of funds so that they can be completed. NHAI has also approved premium recast of several distressed road projects. New structures such as Hybrid Annuity Model and Toll- Operate-Transfer Model are being tried besides facilitating project implementations by de-linking of statutory clearances such as environmental/ forest clearance. For the power sector, a scheme8 to strengthen the financial and operational aspects of distribution companies (Discoms) was introduced. The scheme envisages take-over of 75 per cent of the debt of Discoms by the respective state governments. Besides improving the process of providing coal linkages and auctioning of coal blocks, the Government has also started auctioning re-gasified liquefied natural gas (RLNG) along with providing support through power system development fund (PSDF) to stranded gas-based power projects. An “Amended Technology Up-gradation Fund Scheme” has been envisaged to provide one time capital subsidy for investments in the employment and technology intensive segments of the textile value chain to deal with issues relating to textile industry. 2.12 In terms of size, loans in the range of ₹200 million to ₹500 million recorded the highest slippages at 6.2 per cent during 2015 based both on the number of accounts and amount outstanding. These were followed by the loans in the range of ₹500 million to ₹1000 million. Overall slippage ratio based on amount outstanding was 3.2 per cent (Chart 2.11). Credit quality of large borrowers9 2.13 As a part of sustained efforts to address NPAs in the banking sector, the Central Repository of Information on Large Credits10 (CRILC) is collecting and disseminating data. The system has been further strengthened to capture red flagged accounts, fraud accounts, updates on positions of special mention accounts-211 (SMA-2), status of the joint lenders’ forum (JLF) and non-cooperative borrowers. The system has fairly stabilised and banks are using the data for monitoring their large borrowers’ asset quality and also for credit appraisal of prospective borrowers. 2.14 Share of large borrowers’ in total loans increased from 56.8 per cent to 58.0 per cent between September 2015 and March 2016. Their share in GNPAs also increased from 83.4 per cent to 86.4 per cent during the same period (Chart 2.12). 2.15 Advances to large borrowers classified as SMA- 2 declined sharply by 40.5 per cent and restructured standard advances declined by 25.0 per cent between September 2015 and March 2016, simultaneously pushing up their GNPAs by 66.3 per cent, largely reflecting reclassification. Advances to large borrowers classified as SMA-1 (early signs of stress in asset quality), however, increased sharply by 35.1 per cent between September 2015 and March 2016 (Chart 2.13). 2.16 The GNPA ratio of large borrowers increased sharply from 7.0 per cent to 10.6 per cent during September 2015 to March 2016 and the increase was evident across all bank groups. In this respect, PSBs recorded the highest GNPA ratio at 12.9 per cent. On the other hand, SMA-2 ratio of large borrowers declined across bank-groups during the same period (Chart 2.14). 2.17 The share of standard advances in total funded amount outstanding of large borrowers declined from 84.1 per cent to 83.2 per cent between September 2015 and March 2016. Top 100 large borrowers (in terms of outstanding funded amounts) accounted for 27.9 per cent of credit to all large borrowers and 16.2 per cent of the credit of all SCBs. There was a sharp increase in the share of GNPAs of top 100 large borrowers in GNPAs of all large borrowers from 3.4 per cent in September 2015 to 22.3 per cent in March 2016 reflecting again reclassification (Table 2.1). | Table 2.1: Exposure of SCBs to large borrowers | | (per cent) | | | Mar-15 | Sep-15 | Mar-16* | | Composition of total funded amount outstanding of large borrowers | | i. Standard | 86.2 | 84.1 | 83.2 | | ii. Restructured standard | 8.4 | 8.9 | 6.2 | | ii. Sub-standard | 1.7 | 2.0 | 3.3 | | iv. Doubtful | 3.0 | 4.2 | 6.6 | | v. Loss | 0.7 | 0.8 | 0.7 | | Top 100 borrowers | | i. Fund-based amount outstanding to total fund-based amount outstanding of large borrowers | 28.1 | 27.5 | 27.9 | | ii. Fund-based amount outstanding to total gross advances of SCBs | 18.3 | 15.6 | 16.2 | | iii. GNPAs to total GNPAs of large borrowers | 0.8 | 3.4 | 22.3 | | iv. GNPAs to total GNPAs of SCBs | 0.7 | 2.9 | 19.3 | Note: * Provisional data.
Source: RBI supervisory returns. | Profitability 2.18 Both return on assets (RoA) and return on equity (RoE) of SCBs declined sharply to 0.4 per cent and 4.8 per cent, respectively, in March 2016 from 0.8 per cent and 9.3 per cent in March 2015. Profit after tax (PAT) declined by 43.0 per cent during the financial year 2015-16, due to sharp increase in risk provisions and write-off (Table 2.2). | Table 2.2: Profitability of SCBs | | (per cent) | | | RoA | RoE | Y-o-Y growth | | PAT | Earnings Before Provisions & Taxes | Net Interest Income | Other Operating Income | Risk Provisions | Write-off | | Mar-12 | 1.1 | 13.4 | 14.6 | 15.3 | 15.8 | 7.4 | 35.6 | -13.1 | | Mar-13 | 1.0 | 12.9 | 12.9 | 9.9 | 10.8 | 14.4 | 10.2 | -8.5 | | Mar-14 | 0.8 | 9.5 | -14.1 | 9.5 | 11.7 | 16.6 | 41.9 | 80.3 | | Mar-15 | 0.8 | 9.3 | 10.1 | 11.4 | 8.5 | 17.4 | 7.0 | 23.4 | | Mar-16 | 0.4 | 4.8 | -43.0 | 11.9 | 8.3 | 6.7 | 86.2 | 27.3 | Note: RoA and RoE are annual figures, whereas the growth is calculated on a y-o-y basis.
Source: RBI supervisory returns. | 2.19 Among the bank-groups, PSBs recorded a loss during 2015-16 whereas PVBs showed 11.6 per cent growth in PAT on a y-o-y basis (Chart 2.15). 2.20 A bank-wise distribution of RoAs (annual) shows that 21 SCBs with a share of 37 per cent in the total assets of SCBs recorded negative RoAs during the financial year 2015-16. Further, seven banks with a share of 5 per cent in the total assets recorded RoAs in the range of 0 to 0.25 per cent (Chart 2.16). 2.21 The probability density function of bank-wise RoAs shows that more banks had lower RoAs in 2015- 16 as compared to 2014-15 (Chart 2.17). Risks Banking stability indicator 2.22 The banking stability indicator (BSI),12 shows that risks to the banking sector have sharply increased since the publication of the previous FSR.13 A trend analysis of BSI suggests that stability conditions in the banking sector which started deteriorating in mid-2010, have now worsened significantly. The factors contributing to an increase in risks during the half-year ended March 2016 are deteriorating asset quality and low profitability (Charts 2.18 and 2.19).
Resilience - Stress tests Macro stress test-Credit risk14 2.23 The resilience of the Indian banking system against macroeconomic shocks was subjected to a series of macro stress tests for credit risk at the system, bank-group and sectoral levels. These tests encompassed assumed risk scenarios incorporating a baseline and two adverse macroeconomic scenarios representing medium and severe risks. The adverse scenarios were derived based on up to one standard deviation (SD) for medium risk and up to two SD for severe risk (10 years historical data) (Table 2.3).15 | Table 2.3: Macroeconomic scenario assumptions (2016-17)16 | | (per cent) | | Macro factors | Baseline | Medium Stress | Severe Stress | | Growth in GVA at basic price | 7.6 | 5.5 | 2.9 | | Gross fiscal deficit to GDP ratio | 3.5 | 4.6 | 5.9 | | CPI (combined) inflation | 5.1 | 6.9 | 9.1 | | Weighted average lending rate | 11.3 | 11.9 | 12.6 | | Merchandise exports to GDP ratio | 12.6 | 11.1 | 9.3 | | Current account balance to GDP ratio | -1.3 | -2.4 | -4.8 | | Note: GVA=Gross value added. | Credit risk17 2.24 The macro stress tests suggest that under the baseline scenario, the GNPA ratio may rise to 8.5 per cent by March 2017 from 7.6 per cent in March 2016. If the macro scenarios deteriorate in the future, the GNPA ratio may further increase to 9.3 per cent by March 2017 under a severe stress scenario. Under such a severe stress scenario, the system level CRAR of SCBs may decline to 11.5 per cent by March 2017 from 13.2 per cent as of March 2016 (Chart 2.20). 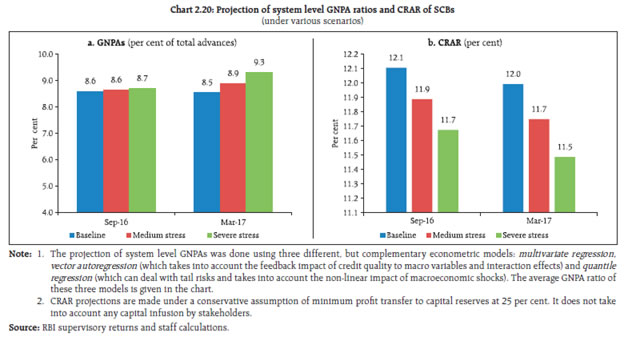 2.25 Among the bank-groups, PSBs may continue to register the highest GNPA ratio. Under the baseline scenario, their GNPA ratio may go up to 10.1 per cent by March 2017 from 9.6 per cent as of March 2016. However, under a severe stress scenario, it may increase to 11.0 per cent by March 2017. Under the baseline scenario, the GNPA ratio of PVBs may increase to 3.1 per cent by March 2017 from 2.7 per cent as of March 2016, which could further increase to 4.2 per cent under a severe stress scenario. Under a severe stress scenario, PSBs may record the lowest CRAR of around 10.3 per cent by March 2017, as against 11.6 per cent as of March 2016 (Chart 2.21). 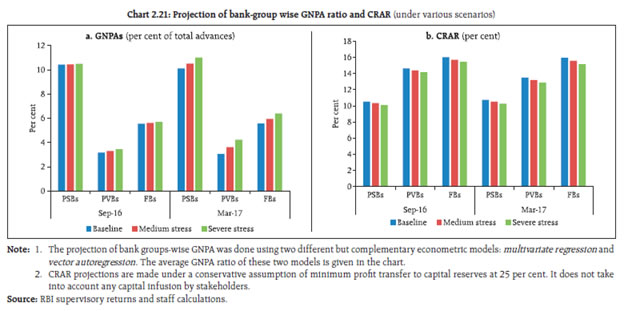 2.26 A macro stress test of sectoral credit risk revealed that in a severe stress scenario, among the select seven sectors, iron and steel industry (which had the highest GNPA ratio at 30.4 per cent as of March 2016) could see its GNPA ratio moving up to 33.6 per cent by March 2017 followed by engineering (from 10.9 per cent to 15.9 per cent) and infrastructure (from 7.1 per cent to 13.4 per cent) [Chart 2.22]. Sensitivity analysis: Bank level18 2.27 A number of single factor sensitivity stress tests19 (top-down) were carried out on SCBs20 to assess their vulnerabilities and resilience under various scenarios21. The resilience of SCBs with respect to credit, interest rate and liquidity risks was studied through the top-down sensitivity analysis by imparting extreme but plausible shocks. The same set of shocks was used on select SCBs to conduct bottom-up stress tests. The results are based on March 2016 data. Credit risk 2.28 The impact of different static credit shocks for banks showed that system level CRAR remained above the required minimum of 9 per cent. Under severe shock of 3 SD22 (that is, if the average GNPA ratio of 60 select SCBs moves up to 13.5 per cent from 7.5 per cent), the system level CRAR and Tier-1 CRAR declined to 10.1 per cent and 7.5 per cent, respectively. The capital losses at the system level could be around 23.6 per cent under a severe shock. The impact of these shocks on profit will be more severe with the SCBs losing their entire annual profit of 2015-16 if the GNPA ratio moves up by 0.74 SD to 9.0 per cent. At the individual bank-level, the stress test results show that 20 banks having a share of 38.4 per cent of SCBs’ total assets might fail to maintain the required CRAR under the shock of a large 3 SD increase in GNPAs. PSBs were found to be severely impacted in these stress tests, where, CRAR of 17 PSBs fall below 9 per cent (Charts 2.23 and 2.24). 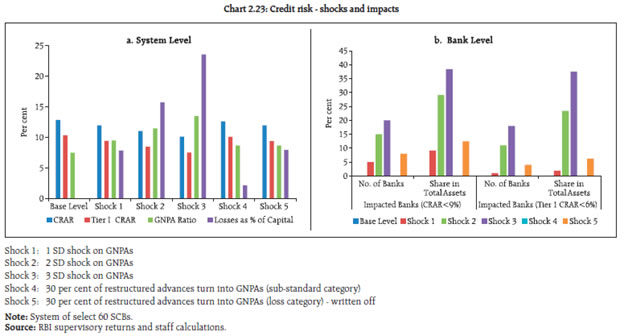
 Credit concentration risk 2.29 Stress tests on banks’ credit concentration risks, considering top individual borrowers according to their exposures, showed that the impact23 (under three different scenarios) was significant for three banks, comprising about 5.3 per cent of the assets, which may fail to maintain 9 per cent CRAR in at least one of the scenarios. Capital losses under the assumed scenarios of default of the top individual borrower could be around 3 per cent. Default of the top two individual borrowers could result in capital losses of 5 per cent, while 6 per cent losses could occur in case the three top individual borrowers default. The impact on profit before tax (PBT) could be 112 per cent in case of default of the top three individual borrowers. The losses could be 45 per cent of PBT under the scenarios of default of topmost individual borrower and 81 per cent in case the top two individual borrowers default. The impact on CRAR at the system level under the assumed scenarios of default of the top one, two and three individual borrowers will be 31, 55 and 76 basis points (Chart 2.25). 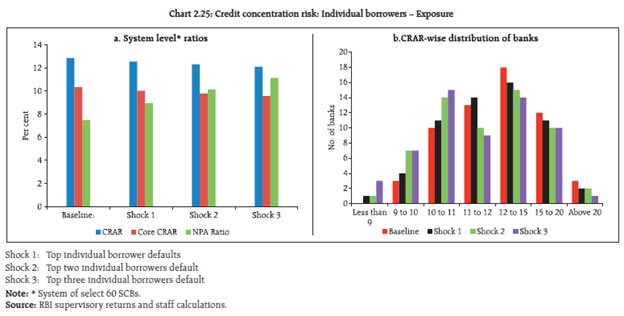 2.30 Stress tests on banks’ credit concentration risks, considering top individual borrowers according to their stressed advances showed that the impact24 (under three different scenarios) was significant for 8 banks, comprising about 12.1 per cent of the assets, which may fail to maintain 9 per cent CRAR in at least one of the scenarios. Capital losses under the assumed scenarios of failure of the top stressed borrower could be around 4 per cent. Failure of the top two stressed borrowers could result in capital losses of 6.9 per cent, while 9.4 per cent losses could occur in case the top three stressed borrowers fail. The impact on PBT could be 162 per cent for failure of the top three stressed borrowers. The losses could be 70 per cent of PBT under the scenarios of default of topmost stressed borrower and 120 per cent in case the top two stressed borrowers fail. The impact on CRAR at the system level under the assumed scenarios of failure of the top one, two and three stressed borrowers will be 47, 81 and 110 basis points (Chart 2.26).  2.31 Stress tests using 10 different scenarios, based on the information of group borrowers on the credit concentration risk of banks reveal that the losses25 could be around six per cent and nine per cent at the system level under the assumed scenarios of default of the top one group borrower and top two group borrowers. The losses could be 18 per cent of capital in case of default of top five group borrowers and this could be as high as 28 per cent of capital if ten top group borrowers default in severe stress conditions. As many as 25 banks will not be able to maintain their CRAR level at 9 per cent in such severe conditions (Table 2.4). | Table 2.4: Credit concentration risk: Group borrowers – Exposure | | Shocks | System Level* | Bank Level | | CRAR | Core CRAR | NPA Ratio | Losses as % of Capital | Impacted Banks (CRAR < 9%) | | Baseline (Before Shock) | 12.9 | 10.3 | 7.5 | --- | No. of Banks | Share in Total Assets of the Banking System (in %) | | Shock 1 | The top 1 group borrower defaults | 12.2 | 9.7 | 10.6 | 6 | 1 | 0.1 | | Shock 2 | The top 2 group borrowers default | 11.7 | 9.2 | 12.8 | 9 | 5 | 8.2 | | Shock 3 | The top 3 group borrowers default | 11.3 | 8.8 | 14.6 | 13 | 8 | 14.4 | | Shock 4 | The top 4 group borrowers default | 11.0 | 8.5 | 16.3 | 16 | 11 | 20.8 | | Shock 5 | The top 5 group borrowers default | 10.7 | 8.1 | 17.7 | 18 | 12 | 24.4 | | Shock 6 | The top 6 group borrowers default | 10.4 | 7.8 | 19.0 | 20 | 13 | 24.6 | | Shock 7 | The top 7 group borrowers default | 10.1 | 7.6 | 20.2 | 23 | 17 | 43.2 | | Shock 8 | The top 8 group borrowers default | 9.9 | 7.3 | 21.4 | 25 | 21 | 48.7 | | Shock 9 | The top 9 group borrowers default | 9.7 | 7.1 | 22.4 | 27 | 25 | 51.6 | | Shock 10 | The top 10 group borrowers default | 9.6 | 7.0 | 23.4 | 28 | 25 | 51.6 | Note: * System of select 60 SCBs.
Source: RBI supervisory returns and staff calculations. | Sectoral credit risk 2.32 Credit risk arising from exposure to industries was examined through a sectoral credit stress test by giving a shock to the GNPA ratio resulting in an increase in GNPAs by a fixed percentage point. The results of the sensitivity analysis revealed that the impact of assumed shocks on profitability, which is already low, would be considerable. The shocks on sub-sectors would also have significant impact on banks’ profitability (PBT), while the capital impact would be limited (Table 2.5). Table 2.5: Sectoral credit risk : Industry - shocks and impacts
(incremental shock on GNPA ratio: increase in GNPA ratio by a fixed percentage points) | | (per cent) | | Sector | (a) Industry | (a1) Of which: Chemical & chemical products | (a2) Of which: Textile | (a3) Of which: Basic metal & metal products (including Iron & steel) | | Sector's Profile | | Sector's Share in Total Advances | 41.68 | 2.31 | 2.98 | 5.90 | | Sector's Share in Restructured Standard Advances | 82.05 | 1.99 | 6.40 | 12.59 | | Sector's Share in GNPAs | 67.94 | 3.03 | 5.58 | 20.09 | | Sectoral Restructured Standard Advances Ratio | 7.91 | 3.46 | 8.61 | 8.58 | | System's Restructured Standard Advances Ratio | 4.02 | 4.02 | 4.02 | 4.02 | | Shocks | Shock on Restructured Standard Advances & | Shock on other Standard Advances # | (a) Industry | (a1) Of which: Chemical & chemical products | (a2) Of which: Textile | (a3) Of which: Basic metal & metal products (including Iron & steel) | | GNPA Ratio of the sector | Impact at System Level* | GNPA Ratio of the sector | Impact at System Level* | GNPA Ratio of the sector | Impact at System Level* | GNPA Ratio of the sector | Impact at System Level* | | GNPA Ratio at system level | Losses as per cent of Capital | Losses as per cent of Profit | GNPA Ratio at system level | Losses as per cent of Capital | Losses as per cent of Profit | GNPA Ratio at system level | Losses as per cent of Capital | Losses as per cent of Profit | GNPA Ratio at system level | Losses as per cent of Capital | Losses as per cent of Profit | | Before Shock Position | 12.20 | 7.48 | - | - | 9.81 | 7.48 | - | - | 13.98 | 7.48 | - | - | 25.48 | 7.48 | - | - | | | | Shock-1 | 0 | 2 | 14.20 | 8.31 | 4.51 | 77.86 | 11.81 | 7.53 | 0.20 | 3.46 | 15.98 | 7.54 | 0.25 | 4.36 | 27.48 | 7.60 | 0.43 | 7.41 | | Shock-2 | 5 | 17.20 | 9.56 | 11.27 | 194.65 | 14.81 | 7.60 | 0.50 | 8.65 | 18.98 | 7.63 | 0.63 | 10.89 | 30.48 | 7.78 | 1.07 | 18.53 | | Shock-3 | 10 | 22.20 | 11.65 | 22.54 | 389.29 | 19.81 | 7.71 | 1.00 | 17.30 | 23.98 | 7.78 | 1.26 | 21.79 | 35.48 | 8.07 | 2.15 | 37.06 | | Shock-4 | 15 | 2 | 15.38 | 8.81 | 6.10 | 105.26 | 12.33 | 7.54 | 0.22 | 3.83 | 17.27 | 7.58 | 0.32 | 5.54 | 28.77 | 7.67 | 0.56 | 9.74 | | Shock-5 | 5 | 18.38 | 10.06 | 12.86 | 222.05 | 15.33 | 7.61 | 0.52 | 9.02 | 20.27 | 7.67 | 0.70 | 12.07 | 31.77 | 7.85 | 1.21 | 20.86 | | Shock-6 | 10 | 23.38 | 12.14 | 24.13 | 416.70 | 20.33 | 7.72 | 1.02 | 17.67 | 25.27 | 7.82 | 1.33 | 22.97 | 36.77 | 8.15 | 2.28 | 39.39 | | Shock-7 | 15 | 2 | 15.38 | 8.81 | 8.48 | 146.37 | 12.33 | 7.54 | 0.28 | 4.82 | 17.27 | 7.58 | 0.51 | 8.74 | 28.77 | 7.67 | 0.93 | 16.05 | | Shock-8 | 5 | 18.38 | 10.06 | 15.24 | 263.16 | 15.33 | 7.61 | 0.58 | 10.01 | 20.27 | 7.67 | 0.88 | 15.28 | 31.77 | 7.85 | 1.57 | 27.16 | | Shock-9 | 10 | 23.38 | 12.14 | 26.51 | 457.81 | 20.33 | 7.72 | 1.08 | 18.66 | 25.27 | 7.82 | 1.52 | 26.17 | 36.77 | 8.15 | 2.65 | 45.69 | Note: & Assumption on asset category of new NPAs:
Shocks 1-3: No shock on restructured standard advances.
Shocks 4-6: Restructured standard advances to sub-standard category.
Shocks 7-9: Restructured standard advances to loss category.
# Shock assumes increase in sectoral NPAs by a fixed percentage. The new NPAs arising out of standard advances (other than restructured standard advances) have been assumed to become sub-standard in the shock scenario.
* System of select 60 SCBs.
Source: RBI supervisory returns and staff calculations. | 2.33 Sectoral credit stress tests were also conducted for the infrastructure segment, including a few important sub-sectors of power, transport and telecommunications. The tests revealed that the shocks to the infrastructure segment would considerably impact the profitability of banks, with the most significant effect of the single sector shock coming from the power and transport sectors (Table 2.6). Table 2.6: Sectoral credit risk : Infrastructure - shocks and impacts
(incremental shock on GNPA ratio: increase in GNPA ratio by a fixed percentage points) | | (per cent) | | Sector | (a) Infrastructure | (a1) Of which: Power | (a2) Of which: Transport | (a3) Of which: Telecommunication | | Sector's Profile | | Sector's Share in Total Advances | 14.22 | 7.82 | 2.87 | 1.50 | | Sector's Share in Restructured Standard Advances | 34.43 | 20.89 | 8.64 | 1.03 | | Sector's Share in GNPAs | 13.90 | 5.97 | 4.33 | 1.09 | | Sectoral Restructured Standard Advances Ratio | 9.73 | 10.73 | 12.08 | 4.09 | | System's Restructured Standard Advances Ratio | 4.02 | 4.02 | 4.02 | 4.02 | | Shocks | Shock on Restruct-ured Standard Advances & | Shock on other Stand-ard Adva-nces # | (a) Infrastructure | (a1) Of which: Power | (a2) Of which:
Transport | (a3) Of which:
Telecommunication | | GNPA Ratio of the sector | Impact at System Level* | GNPA Ratio of the sector | Impact at System Level* | GNPA Ratio of the sector | Impact at System Level* | GNPA Ratio of the sector | Impact at System Level* | | GNPA Ratio at system level | Losses as per cent of Capital | Losses
as per
cent of Profit | GNPA Ratio at system level | Losses
as per
cent of Capital | Losses as per cent of Profit | GNPA Ratio at system level | Losses as per cent of Capital | Losses as per cent of Profit | GNPA Ratio at system level | Losses as per cent of Capital | Losses
as per
cent
of Profit | | Before Shock Position | 7.31 | 7.48 | - | - | 5.71 | 7.48 | - | - | 11.28 | 7.48 | - | - | 5.42 | 7.48 | - | - | | Shock-1 | 0 | 2 | 9.31 | 7.77 | 1.16 | 20.06 | 7.71 | 7.64 | 0.61 | 10.55 | 13.28 | 7.54 | 0.24 | 4.14 | 7.42 | 7.51 | 0.16 | 2.75 | | Shock-2 | 5 | 12.31 | 8.19 | 2.90 | 50.14 | 10.71 | 7.87 | 1.53 | 26.38 | 16.28 | 7.62 | 0.60 | 10.34 | 10.42 | 7.56 | 0.40 | 6.87 | | Shock-3 | 10 | 17.31 | 8.90 | 5.81 | 100.29 | 15.71 | 8.26 | 3.06 | 52.76 | 21.28 | 7.77 | 1.20 | 20.68 | 15.42 | 7.63 | 0.80 | 13.74 | | Shock-4 | 15 | 2 | 10.77 | 7.97 | 1.53 | 26.42 | 9.32 | 7.76 | 0.83 | 14.41 | 15.09 | 7.59 | 0.33 | 5.73 | 8.03 | 7.52 | 0.18 | 3.03 | | Shock-5 | 5 | 13.77 | 8.40 | 3.27 | 56.50 | 12.32 | 8.00 | 1.75 | 30.24 | 18.09 | 7.68 | 0.69 | 11.94 | 11.03 | 7.57 | 0.41 | 7.15 | | Shock-6 | 10 | 18.77 | 9.11 | 6.18 | 106.65 | 17.32 | 8.39 | 3.28 | 56.62 | 23.09 | 7.82 | 1.29 | 22.28 | 16.03 | 7.64 | 0.81 | 14.03 | | Shock-7 | 15 | 2 | 10.77 | 7.97 | 2.53 | 43.67 | 9.32 | 7.76 | 1.44 | 24.87 | 15.09 | 7.59 | 0.58 | 10.06 | 8.03 | 7.52 | 0.22 | 3.80 | | Shock-8 | 5 | 13.77 | 8.40 | 4.27 | 73.75 | 12.32 | 8.00 | 2.36 | 40.70 | 18.09 | 7.68 | 0.94 | 16.27 | 11.03 | 7.57 | 0.46 | 7.92 | | Shock-9 | 10 | 18.77 | 9.11 | 7.17 | 123.90 | 17.32 | 8.39 | 3.88 | 67.08 | 23.09 | 7.82 | 1.54 | 26.61 | 16.03 | 7.64 | 0.86 | 14.79 | Note: & Assumption on asset category of new NPAs:
Shocks 1-3: No shock on restructured standard advances.
Shocks 4-6: Restructured standard advances to sub-standard category.
Shocks 7-9: Restructured standard advances to loss category.
# Shock assumes increase in sectoral NPAs by a fixed percentage. The new NPAs arising out of standard advances (other than restructured standard advances) have been assumed to become sub-standard in the shock scenario.
* System of select 60 SCBs.
Source: RBI supervisory returns and staff calculations. | 2.34 An analysis of a few specific industries to sectoral credit shocks was also undertaken. The analysis considered engineering, automobiles, construction and cement industries. The results of the sensitivity analysis revealed that the shocks would impact the profitability, with the most significant effect of the single industry shock coming from engineering (Table 2.7). Table 2.7: Sectoral credit risk: Select industries
(Incremental shock on GNPA Ratio: Increase in GNPA ratio by a fixed percentage points) | | (per cent) | | Sector | Engineering | Automobiles | Construction | Cement | | Sector's Profile | | Sector’s Share in Total Advances | 2.28 | 1.00 | 1.22 | 0.73 | | Share of Sector in Total NPAs - Aggregate Level | 3.50 | 1.10 | 2.00 | 1.31 | | Shocks | Shock on Standard Advances # | Engineering | Automobiles | Construction | Cement | | GNPA Ratio of the sector | Impact at System Level* | GNPA Ratio of the sector | Impact at System Level* | GNPA Ratio of the sector | Impact at System Level* | GNPA Ratio of the sector | Impact at System Level* | | GNPA Ratio at system level | Losses as per cent of Capital | Losses as per cent of Profit | GNPA Ratio at system level | Losses as per cent of Capital | Losses as per cent of Profit | GNPA Ratio at system level | Losses as per cent of Capital | Losses as per cent of Profit | GNPA Ratio at system level | Losses as per cent of Capital | Losses as per cent of Profit | | Before Shock Position | 11.5 | 7.5 | - | - | 8.3 | 7.5 | - | - | 12.2 | 7.5 | - | - | 13.4 | 7.5 | - | - | | Shock-1 | 2 | 13.5 | 7.5 | 0.2 | 3.2 | 10.3 | 7.5 | 0.1 | 1.2 | 14.2 | 7.5 | 0.1 | 1.8 | 15.4 | 7.5 | 0.1 | 0.9 | | Shock-2 | 5 | 16.5 | 7.6 | 0.5 | 7.9 | 13.3 | 7.5 | 0.2 | 3.1 | 17.2 | 7.5 | 0.3 | 4.4 | 18.4 | 7.5 | 0.1 | 2.2 | | Shock-3 | 10 | 21.5 | 7.7 | 0.9 | 158 | 183 | 7.6 | 04 | 6.1 | 22.2 | 7.6 | 0.5 | 8.8 | 23.4 | 7.6 | 0.3 | 4.4 | Note: # Shock assumes a fixed percentage increase in the sectoral GNPAs ratio (incremental shock on GNPA ratio- addition on existing GNPA ratio). The new GNPAs arising out of standard advances have been assumed to be distributed among different asset classes (following the existing pattern) in the shock scenario.
*System of select 60 SCBs.
Source: RBI supervisory returns and staff calculations. | Interest rate risk 2.35 The interest rate risk arising from a parallel upward shift of 2.5 percentage points in the yield curve of securities under available for sale (AFS) and held for trading (HFT) portfolios of banks (direct impact) appears manageable as the impact on CRAR will be about 97 basis points at the system level. Table 2.8 shows the bank group level analysis. At the disaggregated level, six banks accounting for 11.6 per cent of the total assets were impacted adversely and their CRAR fell below 9 per cent. The total capital loss at the system level was estimated to be about 8.6 per cent. The assumed shock of a 2.5 percentage points parallel upward shift of the yield curve on the held to maturity (HTM) portfolios of banks, if marked-to-market, markedly reduces CRAR by about 227 basis points adversely impacting 20 banks, whose CRAR fell below 9 per cent. The income impact on SCBs’ banking books26 could be about 45 per cent of their latest annual PBT under the assumed shock of a parallel downward shift (2.5 percentage points) in the yield curve. Table 2.8: Interest rate risk – bank groups - shocks and impacts
(under shock of 250 basis points parallel upward shift of the INR yield curve) | | (per cent) | | | PSBs | PVBs | FBs | | AFS | HFT | AFS | HFT | AFS | HFT | | Modified duration | 4.2 | 4.7 | 2.4 | 3.9 | 1.2 | 2.0 | | Share in total investments | 35.4 | 0.6 | 35.1 | 5.1 | 81.0 | 18.5 | | Reduction in CRAR (bps) | 123 | 43 | 105 | | Source: RBI supervisory returns and staff calculations. | Liquidity risk 2.36 Statutory liquidity ratio (SLR) investments, in general, will help the banks to withstand sudden liquidity shocks. The liquidity risk analysis captures the impact of assumed scenarios on banks where deposit run-offs as well as increased demand for the unutilised portion of credit lines which were sanctioned/committed (taking into account the undrawn working capital limit and undrawn committed lines of credit) were considered. In assumed scenarios, there will be increased withdrawals of un-insured deposits27 and simultaneously there will also be increased demand for credit resulting in withdrawal of the unutilised portions of sanctioned working capital limits as well as credit commitments of banks towards their customers. It is presumed that banks will be required to meet these using their stocks of liquid assets (full or a portion of the SLR portfolio) only, with no external funding factored in. A 10 per cent haircut/ margin was assumed on the investments. The tests28 were conducted for SCBs using two approaches based on March 2016 data. 2.37 In the first case, it was assumed that full SLR investments and the excess cash reserve ratio (CRR) will be available to banks to support their liquidity requirements in the stress scenario, which may be through specific policy measures taken during a crisis. 2.38 The analysis shows that though there will be liquidity pressure under the stress scenarios, most banks (49 out of the 60 banks in the sample) can withstand sudden and unexpected withdrawals of around 25 per cent of deposits along with the utilisation of 75 per cent of their committed credit lines with the help of their SLR investments (Table 2.9). Table 2.9: Liquidity risk – Shocks and impacts
(using full SLR along with excess CRR for liquidity support) | | Shocks | Liquid assets Available to the system (per cent of total assets) | Number of banks which failed29 the test (out of select 60) | Share of assets of failed banks in stress scenario to total assets of SCBs (per cent) | | Shocks | Cumulative (un-insured) deposits withdrawal (per cent) | | Baseline | - | 20.9 | - | - | | Shock 1 | 10 | 12.4 | 1 | 0.6 | | Shock 2 | 20 | 6.7 | 4 | 1.5 | | Shock 3 | 25 | 3.7 | 11 | 12.1 | | Shock 4 | 30 | 1.6 | 30 | 46.4 | | Source: RBI supervisory returns and staff calculations. | 2.39 The second case considers liquidity coverage ratio30 (LCR) regime where readily available high quality liquid assets31 (HQLAs) will help banks withstand the initial shocks. 2.40 Under the LCR regime, most banks (44 out of the 60 banks in the sample) will remain resilient in a scenario of assumed sudden and unexpected withdrawals of around 10 per cent of deposits along with the utilisation of 75 per cent of their committed credit lines with the help of their available HQLAs (recognised under LCR) (Table 2.10). In case of incremental shocks in an extreme crisis, banks will be able to withstand further withdrawal of deposits using their remaining SLR investments as discussed in para 2.38 (Table 2.9) through specific policy measures taken as per requirements. Table 2.10: Liquidity risk – Shocks and impacts – LCR regime
(using HQLAs for liquidity support) | | Shocks | Liquid assets available to the system (per cent of total assets) | Number of banks which failed the test (Out of select 60) | Share of assets of failed banks in stress scenario to total assets of SCBs (per cent) | | Shocks | Cumulative (un-insured) deposit withdrawal (per cent) | | Baseline | - | 11.4 | - | - | | Shock 1 | 5 | 5.1 | 3 | 1.2 | | Shock 2 | 7 | 4.0 | 6 | 4.5 | | Shock 3 | 10 | 2.5 | 16 | 29.6 | | Shock 4 | 12 | 1.7 | 25 | 41.8 | | Source: RBI supervisory returns and staff calculations. | Bottom-up stress tests 2.41 A series of bottom-up stress tests (sensitivity analyses) were conducted for the select sample banks,32 with the reference date as March 31, 2016. The results of the bottom-up stress tests carried out by select banks also testified to the banks’ general resilience to different kinds of shocks. While confirming the top-down stress tests results in general, the bottom-up stress tests also pointed out that most banks could withstand the impact of the shocks, though the impact was relatively more severe on some banks, especially in case of shocks imparted on NPAs, with their stressed CRAR positions falling below the regulatory minimum of 9 per cent (Chart 2.27). 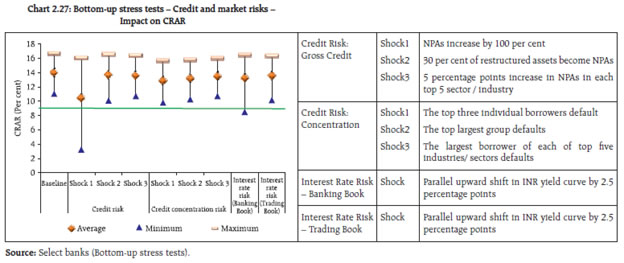 2.42 The results of bottom-up stress tests for liquidity risk show a significant impact of liquidity shocks on select banks. Liquid assets ratios33 using various definitions reflect the liquidity position of (select) banks under different scenarios. The results show that SLR investments and CRR deposits helped banks sustain themselves against the liquidity pressure from sudden and unexpected withdrawal of deposits by depositors (Chart 2.28). Stress testing the derivatives portfolio of banks 2.43 A series of bottom-up stress tests (sensitivity analyses) on derivatives portfolio were conducted for select sample banks34 with the reference date as on March 31, 2016. The shocks on interest rates ranged from 100 to 250 basis points, while 20 per cent appreciation/depreciation shocks were assumed for foreign exchange rates. The stress tests were carried out for individual shocks on a stand-alone basis. 2.44 In the sample, the marked-to-market (MTM) impact has been varied with FBs accounting for the major impact (Chart 2.29). 2.45 The stress test results showed that the average net impact of interest rate shocks on sample banks were negligible. The foreign exchange shock scenarios also showed a relatively lower impact in March 2016 (Chart 2.30). Section II Scheduled urban co-operative banks Performance 2.46 At the system level,35 CRAR of scheduled urban co-operative banks (SUCBs) rose from 12.7 per cent to 13.0 per cent between September 2015 and March 2016. However, at a disaggregated level, six banks failed to maintain the minimum required CRAR of 9 per cent. GNPAs of SUCBs as a percentage of gross advances declined considerably to 6.4 per cent from 7.7 per cent and their provision coverage ratio36 increased to 56.6 per cent from 50.9 per cent during the same period. Further, RoA declined from 0.8 per cent to 0.6 per cent and the liquidity ratio37 fell marginally from 35.0 per cent to 34.8 per cent during the same period. Resilience - Stress tests Credit risk 2.47 A stress test for assessing credit risk was carried out for SUCBs using data as of March 31, 2016. The impact of credit risk shocks on the CRAR of SUCBs was observed under four different scenarios.38 The results showed that except under the extreme scenario (two SD increase in GNPAs which are classified as loss advances), the system level CRAR of SUCBs remained above the minimum regulatory required level. However, individually, a large number of banks (30 out of 52 banks) will not be able to meet the required CRAR levels under the extreme scenario. Liquidity risk 2.48 A stress test on liquidity risk was carried out using two different scenarios; i) 50 per cent and ii) 100 per cent increase in cash outflows, in the one to 28 days’ time bucket. It was further assumed that there was no change in cash inflows under both the scenarios. The stress test results indicate that SUCBs will be significantly impacted under a stress scenario (out of 52 banks, 25 banks under Scenario i and 38 banks under Scenario ii) and will face liquidity stress. Section III Non-banking financial companies 2.49 As of March 31, 2016, there were 11,682 non-banking financial companies (NBFCs) registered with the Reserve Bank, of which 202 were deposit-accepting (NBFCs-D) and 11,480 were non-deposit accepting NBFCs (NBFCs-ND). There were 220 systemically important non-deposit accepting NBFCs (NBFCs-ND-SI)39. All NBFCs-D and NBFCs-ND-SI are subject to prudential regulations such as capital adequacy requirements and provisioning norms along with reporting requirements. Performance 2.50 The aggregated balance sheet of the NBFC sector expanded by 15.5 per cent on a y-o-y basis in March 2016 as compared to 15.7 per cent in the previous year. Loans and advances increased by 16.6 per cent, while, total borrowings increased by 15.3 per cent in March 2016 (Table 2.11). | Table 2.11: Consolidated balance sheet of the NBFC sector: y-o-y growth | | (per cent) | | Item | Mar-15 | Mar-16 | | 1. Share capital | 6.3 | 4.8 | | 2. Reserves and surplus | 13.5 | 14.3 | | 3. Total borrowings | 16.9 | 15.3 | | 4. Current liabilities and provisions | 14.1 | 31.8 | | Total Liabilities / Assets | 15.7 | 15.5 | | 1. Loans & advances | 17.1 | 16.6 | | 2. Investments | 11.5 | 10.8 | | 3. Other assets | 10.6 | 12.7 | | Income/Expenditure | | 1.Total income | 15.3 | 15.8 | | 2. Total expenditure | 15.5 | 15.8 | | 3. Net profit | 15.0 | 15.6 | | Source: RBI supervisory returns. | 2.51 The financial performance of NBFC sector has remained unchanged for the last two years. Net profit as a percentage to total income remained at 18.3 per cent between March 2015 and March 2016 and RoA stood at 2.2 per cent during the same period. RoE increased to 10.6 per cent from 10.3 per cent (Table 2.12). While the regulatory norms for the NBFC sector are sought to be brought closer to those applicable to SCBs, the performance of this sector (RoE and RoA) seems to be much better as compared to that of banks. | Table 2.12: Financial performance of the NBFC sector | | (per cent) | | Item | Mar-15 | Mar-16 | | 1. Capital market exposure(CME) to total assets | 7.4 | 8.5 | | 2. Leverage ratio | 3.7 | 3.9 | | 3. Net profit to total income | 18.3 | 18.3 | | 4. RoA | 2.2 | 2.2 | | 5. RoE | 10.3 | 10.6 | | Source: RBI supervisory returns. | Asset quality and capital adequacy 2.52 GNPAs of the NBFC sector as a percentage of total advances declined to 4.6 per cent in March 2016 from 5.1 per cent in September 2015. NNPAs as a percentage of total advances also declined to 2.5 per cent from 2.9 per cent during the same period (Chart 2.31). 2.53 As per extant guidelines, NBFCs40 are required to maintain a minimum capital consisting of Tier-I41 and Tier-II capital, of not less than 15 per cent of their aggregate risk-weighted assets. The CRAR of NBFCs increased to 24.3 per cent as of March 2016 from 23.8 per cent as of September 2015 (Chart 2.31). At the disaggregated level, seven NBFCs were unable to meet the regulatory required minimum CRAR of 15 per cent as of March 2016. Resilience - Stress tests System level 2.54 Stress test on credit risk for the NBFC sector as a whole for the period ended March 2016 was carried out under three scenarios: (i) GNPA increase by 0.5 SD, (ii) GNPA increase by 1 SD and (iii) GNPA increase by 3 SD. The results indicate that in the first and second scenarios, the CRAR of the sector was marginally affected while in the third scenario, it declined to 23.3 per cent from 24.3 per cent. This however, was much above the regulatory minimum required level of 15 per cent. Individual NBFCs 2.55 Stress test on credit risk for individual NBFCs was also conducted for the same period under the same three scenarios. The results indicate that under scenarios (i) and (ii), around 5 per cent of the companies, will not be able to comply with the minimum regulatory capital requirements, while 8 per cent of the companies will not be able to comply under the third scenario. Section IV Interconnectedness42 Trends in the interbank market43 2.56 The interbank market continued to display a declining trend with a turnover of ₹7.2 trillion in March 2016, a shrinkage of over 6 per cent over March 2015. Fund based exposure in the interbank market displayed an increasing trend over the last three years, with a share of nearly 82 per cent in March 201644 (Chart 2.32). 2.57 While the PSBs remained the most dominant participants in the market, the share of PVBs indicated a steady increase over the last two years. The share of all the banks in the interbank market was, however, widely distributed as indicated by the Herfindahl-Hirschman Index (HH Index) of around 0.06 in March 2016 (Chart 2.33). 2.58 The interbank market is generally perceived to be a source of funding liquidity. In the Indian context, however, the share of long-term bilateral exposures between banks has been steadily increasing over the years. Around 54 per cent of the exposure in the fund-based interbank market was long-term in nature as of March 2016 (Chart 2.34). 2.59 While there was not much change in the size of the overall short-term fund-based interbank market, a visible trend was the sharp decline in the share of certificate of deposits (CDs). The share of call money and CDs which together accounted for over 71 per cent of the short-term interbank market in March 2012, declined to around 36 per cent in March 2016. During the same period, the share of other short-term interbank exposure increased from 28 per cent to 64 per cent (Chart 2.35). Network structure and connectivity 2.60 The network structure45 of the banking system has consistently remained tiered, with the same set of banks continuing to dominate (Chart 2.36). The degree of interconnectedness in the banking system can be measured by the connectivity ratio46 which has shown a declining trend indicating that the links/ connections between the banks have reduced. The dominant banks are depicted in the inner most circle of the network plot. The number of such banks ranged between nine and six during March 2012 to March 2016. The cluster coefficient47, which depicts local interconnectedness remained consistent during the period from March 2012 to March 2016 indicating that the clustering/ grouping within the banking network has not changed much over time (Chart 2.37).
Network of the financial system 2.61 From the perspective of the larger financial system, the flow of funds between the SCBs, asset management companies managing mutual funds (AMC-MFs), insurance companies, NBFCs, urban co-operative banks (UCBs) and other all India financial institutions (AFIs) assume importance. The AMC-MFs followed by insurance companies are the biggest fund providers in the system, while SCBs followed by NBFCs are the biggest receiver of funds. Within SCBs, however, both PSBs and FBs have a net receivable position vis-à-vis the entire financial sector, whereas PVBs have a net payable position. Further, the four AFIs included in the analysis are significant participants in the financial system (Chart 2.38 and Table 2.13). 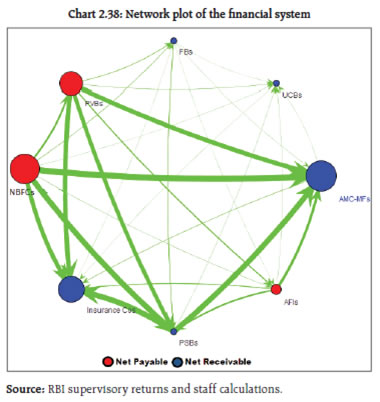
| Table 2.13: Inter-sector assets and liabilities | | (₹ billion) | | | Receivables | Payables | | SCBs | 3585 | 6494 | | AMC-MFs48 | 4508 | 265 | | Insurance Companies49 | 3709 | 117 | | NBFCs50 | 393 | 4615 | | UCBs51 | 123 | 22 | | All India FIs (NABARD, Exim Bank, NHB, SIDBI) | 1309 | 2114 | Note: The receivable and payable amount does not include transactions done among entities which are part of the same group.
Source: RBI supervisory returns and staff calculations. | Interaction between SCBs, AMC-MFs and insurance companies 2.62 Other than SCBs, the two most dominant sectors in the Indian financial system are the insurance companies and AMC-MFs. These three sectors taken together account for more than 80 per cent of the financial system. As at end March 2016, the exposure52 of AMC-MFs towards the financial system was around 36 per cent of its total assets under management (AUM), while the exposure of the banking system and insurance sector to the financial system was around 15 and 10 per cent of their total assets, respectively53. 2.63 The banking sector had a combined exposure of over ₹176 billion towards the insurance and mutual fund sector, which accounted for 0.2 per cent of the total assets of the banking system54 in March 2016. At the same time, the combined exposure of AMC-MFs and insurance companies towards the banking sector was nearly ₹4.9 trillion which was around 19 per cent and 10 per cent of their respective AUMs. While the exposure of AMC-MFs to banks was primarily through short-term instruments (₹1.4 trillion), the insurance companies had substantial exposure through long-term instruments (₹2.2 trillion) (Table 2.14). | Table 2.14: Pattern of AMC-MFs’ and insurance companies’ exposure to banks (March 2016) | | (₹ billion) | | | AMC-MFs | Insurance companies | Investment
in short-term
instruments | Investment in capital instruments | Investment in
bonds and other long-term
instruments | Investment
in short-term
instruments | Investment in
capital instruments | Investment
in bonds and other long-term
instruments | | PSBs | 1058 | 140 | 153 | 139 | 455 | 723 | | PVBs | 357 | 550 | 137 | 45 | 508 | 551 | | FBs | 25 | 0 | 9 | 2 | 0 | 0 | | All SCBs | 1439 | 690 | 300 | 186 | 963 | 1275 | | Source: RBI supervisory returns | SCBs, AMC-MFs and insurance companies’ interaction with NBFCs 2.64 While SCBs were the largest gross receivers of funds from the rest of the financial system, NBFCs continued to be the largest net receivers of funds from the rest of the system. As of March 2016, the banking sector had an outstanding exposure of over ₹2 trillion to NBFCs. Further, the exposure of AMC-MFs to NBFCs displayed an increasing trend between March 2012 and March 2016 (Table 2.15). | Table 2.15: Exposure of SCBs, AMC-MFs and insurance companies to NBFCs | | (₹ billion) | | | Mar-12 | Mar-13 | Mar-14 | Mar-15 | Mar-16 | | SCBs | 1513 | 1453 | 1516 | 1595 | 2029 | | AMC-MFs | 425 | 624 | 756 | 1008 | 1489 | | Insurance companies | 780 | 880 | 965 | 1080 | 1038 | | Source: RBI supervisory returns. | Contagion analysis 2.65 A contagion analysis using network tools is a stress test which is carried out to estimate potential loss that could happen in the event of failure of one or more banks. Further, the extent of loss that could be triggered by a bank is also an indicator of its systemic importance. While a contagion could be triggered by the failure of any bank, the current analysis was conducted with the top net borrowers and net lenders as trigger banks. Theoretically, a net borrower bank will generate a solvency contagion while a net lender bank will generate a liquidity contagion. However, in reality, both solvency and liquidity contagions are likely to occur simultaneously as typically a bank is a net borrower vis-à-vis some counterparties while remaining a net lender for some others. An analysis was undertaken to assess the impact of failure of the top borrower and top lender of the banking system on the Tier-I capital of the system (Tables 2.16 and 2.17). The failure of the top net borrower bank could result in a loss of nearly 37 per cent of Tier-I capital of the banking system (under the joint solvency liquidity contagion) while the failure of the top net lender bank could result in a loss of nearly 38 per cent of Tier-I capital, subject to certain assumptions made with regard to contagion.55 It may be observed that failure of Bank D, the fourth among the net borrower banks, resulted in a more severe loss than the failure of the top net borrower bank due to the greater connectivity of this bank. Table 2.16: Contagion triggered by net borrower banks
(percentage loss of total Tier I capital of the banking system) | | Top Net Borrower Banks | Solvency Contagion | Liquidity Contagion | Joint Solvency Liquidity Contagion | | Bank A | 6.8 | 1.0 | 36.8 | | Bank B | 3.8 | 0.5 | 4.1 | | Bank C | 2.6 | 0.2 | 2.8 | | Bank D | 3.8 | 8.8 | 40.3 | | Bank E | 2.0 | 0.1 | 2.0 | | Source: RBI supervisory returns and staff calculations. |
Table 2.17: Contagion triggered by net lender banks
(percentage loss of total Tier I capital of the banking system) | | Top Net Lender Banks | Solvency Contagion | Liquidity Contagion | Joint Solvency Liquidity Contagion | | Bank 1 | 0.1 | 20.4 | 37.5 | | Bank 2 | 0.7 | 17.0 | 38.8 | | Bank 3 | 4.0 | 7.7 | 42.4 | | Bank 4 | 0.8 | 3.3 | 2.7 | | Bank 5 | 0.7 | 12.6 | 38.5 | | Source: RBI supervisory returns and staff calculations. | 2.66 More banks fail in case of a joint contagion since the spread of the contagion is via both the asset and liability sides of banks while in the case of a standalone contagion the spread is one-sided [that is either asset or liability side] and hence the impact of a joint contagion is generally found to be severe and often disproportionate vis-à-vis a standalone contagion (Chart 2.39).
|