The outlook for global growth remains subdued. A mix of unconventional policy measures and negative interest rates in some jurisdictions seems to be having unintended consequences of raising financial stability risks, while not stimulating growth commensurately. In this context, the emerging market economies (EMEs) are not immune to the effects of policy changes and risk manifestations in advanced economies underscoring the need for greater macro-policy vigilance. While India stands out in the current milieu with significant terms-of-trade gains, the risks of reversal of global commodity prices need to be factored in going forward. Significant excess capacity and corporate distress seem to be deterring private investment. With two consecutive years of drought, the farm sector needs special attention, given its impact on livelihood and inflation, besides the broader political economy. Although the prediction of a normal monsoon this year augurs well, the final impact will be determined by its spatial and temporal distribution. Stress in the corporate sector, elevated since 2009-10 showed some signs of abating in 2015-16. This is reflected in improved profitability while corporate leverage levels continue to cause concern. Global backdrop 1.1 The global economic recovery remains fragile amidst weak and uneven growth, a slowdown in world trade and uncertainty prevailing in financial and commodities markets. The International Monetary Fund (IMF) has yet again lowered the projection of world GDP growth1 to 3.2 per cent in 2016 (Chart 1.1a). Although the Q1 2016 growth rate at 0.6 per cent in the Euro area exceeded market expectations, the inherent internal contradictions of a single monetary policy in the face of varied fiscal conditions and policy priorities continue to weigh on its prospects. Similarly for Japan, while the Q1 growth performance at 0.5 per cent was better than expected, the weakness in industrial activity remains amidst a buildup of deflationary pressures. The slowdown in China (notwithstanding the slight improvement registered in the first quarter of 2016) and apprehensions of hard landing weigh heavily on global growth prospects, with India’s relatively stronger growth appearing to provide some of the much needed support. In the US, another slowdown in GDP growth in Q1 2016 probably indicates that a faster and durable recovery may take more time to achieve (Chart 1.1b). 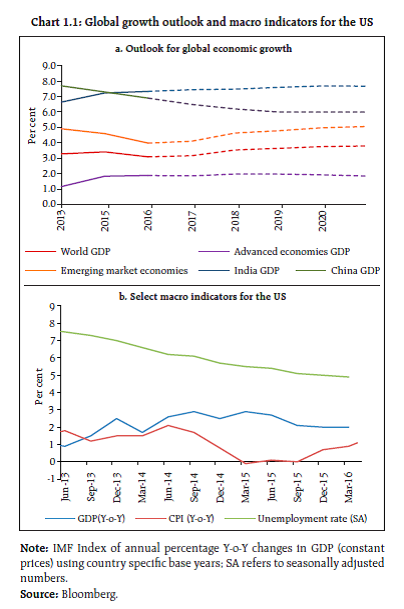 1.2 While there is some semblance of return of macroeconomic stability in some EMEs and stabilisation of commodity prices, the uncertainty from the evolving geo-political situation could continue to cast a shadow over the investment sentiments. Elevated gold prices point towards the search for safety in the prevailing uncertainty and the US dollar continues to reflect the changes in expectations of future monetary policy decisions of the Fed (Chart 1.2). In the meanwhile, the uncertainty over interest rate hikes by the US Fed continues (Chart 1.3). 1.3 In any case, it is becoming increasingly difficult to anticipate to what extent policymakers in advanced economies would be willing to extend the current ultra-easy monetary policy. Without any clear signs of an exit strategy, this path seems to be leading to the phenomena of ‘easing begets easing’ and ‘competitive easing’ (Taylor, 2013, 2015; and Rajan, 2014)2. For instance, one unintended consequence is the appreciation of the Euro and the Japanese Yen. This reinforces the fundamental tenet that short term fiscal and monetary measures cannot substitute for long-term structural reforms and investment. 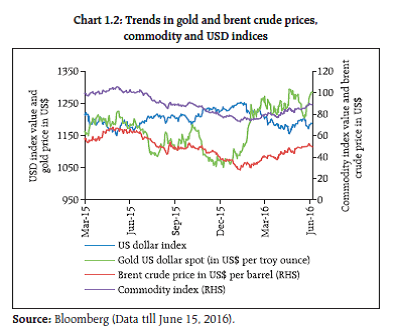 1.4 While some of the policy measures, seen in isolation, might have had some positive impacts on financial and economic stability, their unintended adverse side effects are becoming evident. For instance, asset buying by central banks appear to have squeezed the markets of high quality paper. Furthermore, very low (in some cases negative) interest rates may be building risks into pension funds3 and other social security plans. Such policies may also be inducing people to save more rather than consume and also engage in ‘search for yield’ strategies. There are other potential financial stability implications of prolonged dependence on unconventional measures such as negative interest rate policy (NIRP) (Box 1.1). In EMEs, it could potentially make the foreign currency debt more attractive which has its own financial stability challenges. Box 1.1: Negative interest rates – Financial stability implications Central banks in some jurisdictions like Denmark, Sweden, Switzerland, European Union (EU) and more recently Japan have entered the uncharted territory of negative interest rate policy (NIRP) regimes as an attempt to raise economic growth and counter deflationary conditions by encouraging borrowing and risk taking. However, the transmission channels through which this policy will work are still uncertain and the actual real sector impact on growth and inflation has not been very encouraging (Monetary Policy Report, RBI, April 2016). At the same time, financial stability risks to the global economy in terms of pressures on bank profitability, inflated asset prices, exchange rate dominance and fiscal dominance may be significant. Banks and financial institutions: If pursued for long, NIRP may result in balance sheet contraction with implications for bank profitability depending on the extent to which banks are able to pass on negative interest rates to depositors. In general, stickiness of deposit rates causes an imbalance between adaptation of NIRP on the asset and liability sides. Banks which are non-systemic and with large retail businesses may suffer more than those that are more focused on corporate banking, since it may be easier to pass negative rates to corporate clients than to retail clients (Jackson, 2015). Actual data for some of these economies show that pass-through to the economy has been limited as banks have been reluctant to pass on negative rates to individual depositors4. Concerns have also been raised that banks may choose to borrow less from central banks, in order to lower excess reserves and avoid the negative deposit rate. This will put upward pressure on rates in the interbank and bond market, offsetting the stimulation effect of the negative policy rate (Coeuré, 2014). For the insurance and pension sectors, a sustained period of low and negative interest rates could undermine the viability of institutions in these sectors and pose challenges in meeting future pension disbursement commitments in the longer term (GFSR, April 2016). Competitive devaluation and capital flows: Negative interest rates are also likely to push capital either out of the economy leading to currency depreciation pushing exports and reducing imports (which is akin to competitive devaluations) or could inflate certain asset prices like housing necessitating the use of macro prudential measures (Lipton, 2016). In the absence of a switching effect when several countries are deleveraging at the same time, these depreciations may not have had the desired real sector impact. Fiscal consolidation: Negative interest rates will reduce the incentive for fiscal consolidation and structural reforms in cases where they are needed. They also lower the debt servicing capacity, which will give a misleading picture of debt sustainability and hence, could reduce incentives for fiscal discipline (Hannoun, 2015). Considering that negative interest rates can make government borrowing easier, it has been suggested that one way to mitigate this is to impose a risk weight on sovereign assets. Thus, the unintended financial stability consequence of a monetary policy measure (negative interest rates) is being mitigated through a financial sector policy measure that can have huge macro and monetary policy implications. References: Coeuré, B. (2014); ’Life Below Zero: Learning about Negative Interest Rates.’ Speech at the ECB’s Money Market Contact Group. Hannoun, H. (2015); ‘Ultra-low or negative interest rates: what they mean for financial stability and growth’, Speech at the Eurofi High-Level Seminar, Riga. IMF (2016); Global Financial Stability Report, April. Jackson H. (2015); ‘The International Experience with negative Policy Rates’, Staff Discussion Paper, Bank of Canada. Lipton, David (2016); ‘Policy Imperatives for Boosting Global Growth and Prosperity’, Speech at NABE, Washington. RBI (2016); Monetary Policy Report, RBI, April. 1.5 Another question that arises in this context is whether NIRP is actually driving down inflation expectations, contrary to its intended objective. The break-even inflation rates have come off their peaks of recent years (Chart 1.4). On the other hand, some scepticism lingers in the markets about the market based inflation expectations on the premise that there may not be enough demand for inflation protected products in a deflationary scenario. 1.6 Moreover, while the wealth effects of low or negative interest rates are becoming visible in appreciating asset prices, their impact on aggregate demand and inflation through lower borrowing costs is not evident, as seen in the case of the US, for instance (Chart 1.5). The recent developments showing excessive reliance on prolonged use of unconventional monetary policy also raise questions on established wisdom. For instance, as there is an increasing risk that monetary policy was becoming ‘subordinated to financial dominance, exchange rate dominance and fiscal dominance’5, there is a need to rethink whether the central banks should always act in a predictable way and never surprise the markets. It is, therefore, important to assess the costs and benefits of too much assurance to markets. 1.7 In the meanwhile, the appreciation of major EME currencies and a decline in EME bond yields in the recent past has augured well for capital flows to EMEs though it remains to be seen how long the recovery in EME currencies and bonds will sustain (Chart 1.6). While there are concerns about sluggish global trade, the fall in growth in global trade in value terms only seems to reflect the movements in the valuations of the US dollar (Chart 1.7). 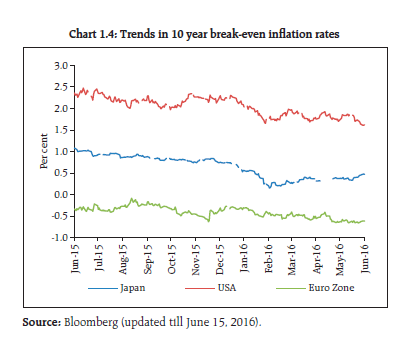
 1.8 The dominance of the US dollar in the international monetary and financial system (IMFS) is another issue that is being widely debated though an alternative seems elusive. The popular notion that the US needs to run current account deficit to provide dollar liquidity to the rest of the world, given the fact that ‘US dollar liquidity can be produced at will regardless of the US current account position’ is also being questioned (Borio and Disyatat, 2015)6. Accordingly, it has been suggested that ’solutions need to focus less on addressing current account imbalances and more on financial imbalances’ (Borio, 2016)7 with an emphasis on gross rather than net capital flows and the corresponding stocks (Chart 1.8). 1.9 As regards crude oil prices, when prices crash, a new supply-demand equilibrium should emerge for prices to adjust. However, this does not seem to be happening in the oil market, as the supply side, despite being led by a cartel, seems to be a divided house. Although there has been a fall in shale gas output in the US in recent months, the overall dynamics in the oil markets could be an indication that economic rationale was not playing out fully as political considerations appear to take centre-stage.
Domestic economy Growth, savings and investments 1.10 As global uncertainties and dynamics impact India with its increasing level of integration with the global economy, continuation of sound domestic policies and structural reforms become important. Being a net commodity importer and with efforts to improve the ‘ease of doing business’,8 India at this juncture stands out amongst the emerging markets cohort in terms of growth. However, gross fixed capital formation needs to be bolstered while maintaining robust trends in consumption to sustain higher levels of growth (Chart 1.9). 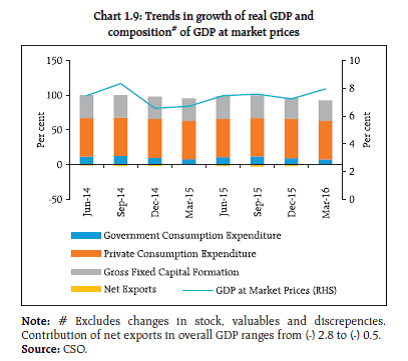 1.11 Retail inflation rose sharply in April 2016 after softening for two months, which further increased in May 2016. Real fixed investment growth slackened during 2015-16. The issue of slow investment recovery needs to be seen in the context of desired deleveraging of corporates and balance sheet repairs in the banking industry. While capacity utilisation has shown some improvements, trends in the index of industrial production (IIP) and the purchasing managers’ index (PMI) indicate that manufacturing activity needs to pick up further. Gross savings rate has declined reflecting moderation in household savings (Charts 1.10 and 1.11).
Note: PMI above 50 means expansion.
Source: MOSPI and Bloomberg. Commitment to fiscal rectitude 1.12 Higher allocations were made in the recent union budget for capital expenditure despite the government sticking to fiscal discipline. Efforts are also being made to contain the revenue deficit and to rationalise subsidies (Charts 1.12 and 1.13). Going forward, the tax revenues will need to be increased by expanding the tax base further. In the meanwhile the Government of India has constituted a committee to review the Fiscal Responsibility and Budget Management (FRBM) roadmap. Fiscal consolidation in the recent year has enabled reduction in statutory liquidity ratio (SLR)9 facilitating further financial market development.
Risk from reversal of commodity prices 1.13 The sharp decline in international crude oil prices since Q3 of 2014-15 has provided terms of trade benefits leading to relatively lower imports and reduced external vulnerabilities. According to IMF, the terms of trade benefits are estimated to be the highest for India among all G-20 countries in the recent period. On the other hand, according to the International Energy Agency (IEA), India is the third largest consumer of oil and surpassed China as its main growth market. In this context, there is a need to be alert to the risks of commodity price cycle reversals and the economy’s preparedness to readjust. Already oil prices have significantly moved up in the recent period since their February 2016 lows of below US dollar 30 per barrel. 1.14 As of now India’s external position looks robust with forex reserves at historic highs and low trade deficit, helped mainly by lower crude prices (Chart 1.14). However, the downside of prolonged low oil prices also needs to be reckoned in terms of likely reduction in private transfers and remittances (Chart 1.15). Hence, there may not be any room for complacency in the current global scenario.
Risks from rural distress 1.15 The agriculture sector is important in terms of livelihood and food prices. Although the spatial and temporal distribution of rainfall is as important as the quantum, the impact of a deficient monsoon on overall agricultural GDP and inflation has shown a perceptible shift in recent years (Chart 1.16). Given the fact that any distress in the farm sector has a significantly higher impact on the political economy, continuous thrust on a coherent policy which addresses overall rural distress assumes significance even as the government’s efforts are aimed at doubling farm incomes by 2022. 1.16 Notwithstanding substantial credit allocations (Chart 1.17) and financial outlays, rural indebtedness and distress are indicative of the need of a comprehensive strategy shift in policy. The solutions need to go beyond short-term responses such as loan waivers and subsidised or free electricity, water and fertilisers. While significant steps have been taken, such as the revamped crop insurance scheme, direct benefit transfers and initiatives by some state governments for strengthening the laws and administrative processes for land titling, there are many other issues that require policy attention, such as providing alternative employment opportunities. While policies focused on the rural sector, like any public policy initiative come with an embedded ‘moral hazard’,it is important to find ways to minimise it so as to ensure optimal use of limited resources (Box 1.2). Box 1.2: Moral hazard and morality The term moral hazard, once confined to the ‘insurance’ lexicon made its way into public discourse following the global financial crisis (GFC). The diverse range of policies, including those related to deposit insurance, forbearance (of any sort), qualitative and quantitative easing, subsidies, bailouts, bankers’ incentives, tax treatments and a freebie culture that disturbs intergenerational equity and even limited liability have stimulated debates veering towards moral hazard. Moral hazard, simply put, is the ability to impose the costs of one’s actions on others without their direct consent thus providing a powerful incentive to act in ways that one normally would not (McCaffrey, 2016). The real problem in public policy initiatives arises when the incentive of a person is to use more resources than she otherwise would have used because she knows or believes that someone else will provide some or all of these resources, and this occurs against the will or sanction of this expropriation (Hülsmann, 2006). For instance, while providing a subsidy the assumption is that the ultimate burden is supposed to be on the tax payer. However, given a choice the tax payer may not be willing to sanction this appropriation. While dealing with uncertainty, Frank Knight also referred to moral hazard. For him, uncertainty is ‘fundamentally a moral problem’…..and ‘…actual human actions are therefore moral judgments’ (Emmet 2011). Kenneth Arrow outlined the distinction between ex ante and ex post moral hazard (McCaffrey, 2016). This difference is about how individuals upfront influence the probability of losses to insurers and how they take advantage of an unfortunate event after its occurrence. To the extent that human beings are fallible, some actions that are genuinely undertaken might expose them to unwarranted and unsolicited risks. Some have also argued that moral hazard can be akin to a kind of contract (Classen, 2015). McCaffrey suggests that by not making hidden value judgments, a contract view of moral hazard is useful for policy discussions, while it also explains a moral dimension of behaviour, viz., the violation of property rights. What, however, must be appreciated is the fact that moral hazard is embedded in varied degrees in any public policy initiative. As public policy measures are in the nature of ‘declared state objectives relating to the health, morals, and wellbeing of the citizenry’, the moral hazard aspect is sometimes inevitable. Thus, at best the policymakers can structure the incentive framework to minimise the abusive impact of the moral hazard. At the same time, there is a need to beware of, what Lawrence Summers called, ‘moral hazard fundamentalism’ since government interventions of unconventional types are sometimes a prerequisite to ensure social and economic stability. References: Classen, Rutger (2015), ‘Financial Crisis and Ethics of Moral Hazard’, Social Theory and Practice, Vol. 41, No. 31. Emmett, Ross B. (2011), ’Frank H. Knight on the “Entrepreneur Function” in Modern Enterprise’. Ross B. Emmett, Seattle University Law Review, Vol. 34. Hulsmann, Jörg Guido (2006) ‘The Political Economy of Moral Hazard’, Politická ekonomie, vol. 54, no. 1, pp. 35-47. McCaffrey, M. (2016), ‘The morals of moral hazard: a contracts approach’. Business Ethics: A European Review, May. Asset prices Stock prices 1.17 The equity markets, world over, experienced turmoil during the first two months of 2016 primarily due to the developments in China and a sharp fall in international crude oil prices. The markets seem to have recovered since then (Chart 1.18a). In the Indian context while the banking sector has tended to converge with the market-wide index, other important sectors such as auto and pharmaceuticals have outperformed the market-wide index (Chart 1.18b). House prices 1.18 Apart from the catalytic role of the housing sector in economic development, house prices have an impact on financial stability. The growth in house prices has moderated significantly in the recent period (Chart 1.19). With gross non-performing asset (GNPA) ratio around 1.3 per cent11, the retail housing segment does not presently pose any significant systemic risks in the Indian context. Corporate sector 1.19 The half-yearly data on select non-government non-financial (NGNF) listed companies12 indicate some improvements in the performance of the corporate sector on a year on year basis (Table 1.1). | Table 1.1: Select financial ratios of performance of NGNF listed companies (2014-15 and 2015-16) | | | First- half of 2014-15 | Second- half of 2014-15 | First- half of 2015-16 | Second- half of 2015-16 | | Sales growth (y-o-y) | 5.8 | -2.3 | -3.5 | 2.2 | | Net profit to average* total asset (per cent) | 2.6 | 1.9 | 2.6 | 2.1 | | Solvency ratio & (per cent) | 13.8 | 12.1 | 14.5 | 12.9 | | Debt to equity ratio # | 0.38 | 0.39 | 0.38 | 0.38 | | Interest coverage ratio (ICR) (number of times) | 5.8 | 4.9 | 5.4 | 5.0 | | Interest payment^ to average* borrowings (per cent) | 10.1 | 10.1 | 10.3 | 10.0 | Note: * Average is based on outstanding opening and closing positions for the half year.
& Solvency ratio is defined as sum of profit after tax (PAT) and depreciation to total borrowings.
# Debt is taken as long term borrowings and equity is the net worth.
^ Annualised interest payment is used.
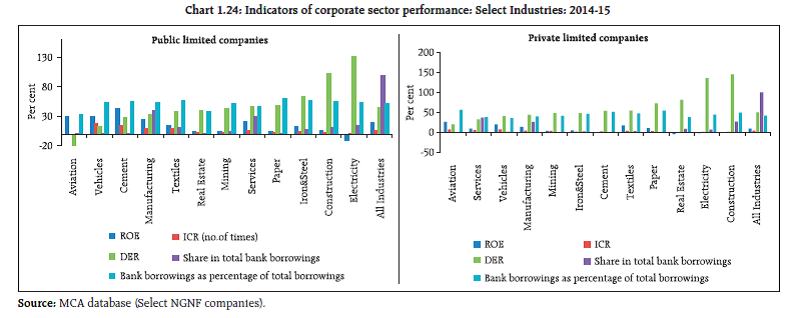
Source: RBI (Half-yearly statements of select NGNF listed companies). | Corporate leverage Trend 1.20 The proportion of ‘leveraged’ companies in the sample [defined as those either with negative net worth or debt to equity ratio (DER) ≥ 2] declined sharply from 19.0 per cent in March 2015 to 14.0 per cent in March 2016, and their share in the total debt also declined from 33.8 per cent to 20.6 per cent. Similarly, the proportion of ‘highly leveraged’ companies (defined as ‘leveraged’ companies with DER ≥ 3) declined from 14.2 per cent to 12.9 per cent with the share of debt of these companies in the total debt coming down from 23.0 to 19.0 per cent (Table 1.2). | Table 1.2: NGNF listed companies: Tail risk in corporate leverage | | (per cent) | | Leverage | Number of companies (as percentage of total companies) | Share of debt to total debt | | Sep'14 | Mar'15 | Sep'15 | Mar'16 | Sep'14 | Mar'15 | Sep'15 | Mar'16 | | Negative Net worth or DER ≥ 2 | 18.4 | 19.0 | 19.4 | 14.0 | 31.8 | 33.8 | 30.5 | 20.6 | | Negative Net worth or DER ≥ 3 | 13.6 | 14.2 | 15.3 | 12.9 | 22.9 | 23.0 | 24.9 | 19.0 | | Source: RBI (Half-yearly statements of select NGNF listed companies). | Debt servicing capacity 1.21 An analysis of the current trends in debt servicing capacity and leverage of ‘weak’ companies [defined as those having interest coverage ratio (ICR)<1]was undertaken using the same sample, indicated some improvement in 2015-16. The analysis shows that 15.0 per cent of companies were ‘weak’ in the select sample as at end March 2016, compared to 17.8 per cent in March 2015. The share of debt13 of these ‘weak’ companies also fell to 27.8 per cent of total debt in the second half of 2015-16 from 29.2 per cent in the second half of 2014-15. However, the DER of these ‘weak’ companies increased to 2.0 from 1.8. The proportion of ‘leveraged weak’ 14 companies sharply declined to 1.6 per cent from 2.3 per cent during this period.The share of debt of ‘leveraged weak’ companies also declined to 8.5 per cent from 12.4 per cent (Chart 1.20). 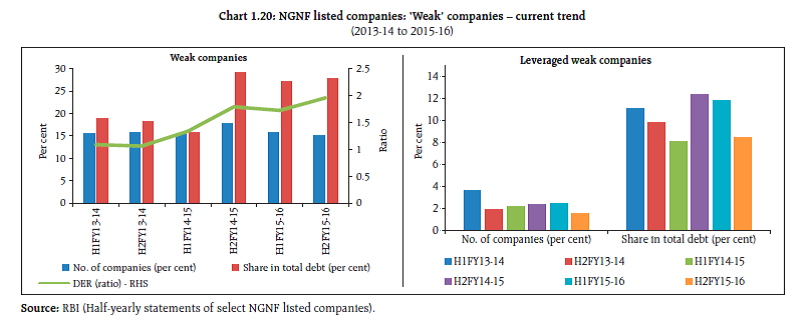 1.22 A risk profile of select industries as at end March 2016 showed that iron and steel industry had high leverage as well as interest burden15. Construction, power, telecommunication and transport industries also had relatively high leverage (Chart 1.21). Analysis of corporate sector risks 1.23 The corporate sector stability indicator and map16 indicate that the overall risks to the corporate sector, which increased after the global financial crisis during 2007-08, have shown some moderation in 2015-16. However, the risks due to lower demand (turnover17) and liquidity pressure remains (Charts 1.22). Financial health: Based on large database 1.24 A more detailed analysis of the corporate sector’s performance with a large sample18 of Ministry of Corporate Affairs (MCA), Government of India during the period from 2012-13 to 2014-15 indicates that the profitability19 of both public and private limited companies, in general, improved in 2014-15, while the leverage ratios indicated increasing trends. Debt servicing capacity measured in terms of the ICR improved for private limited companies whereas it remained almost the same in case of public limited companies (Chart 1.23). 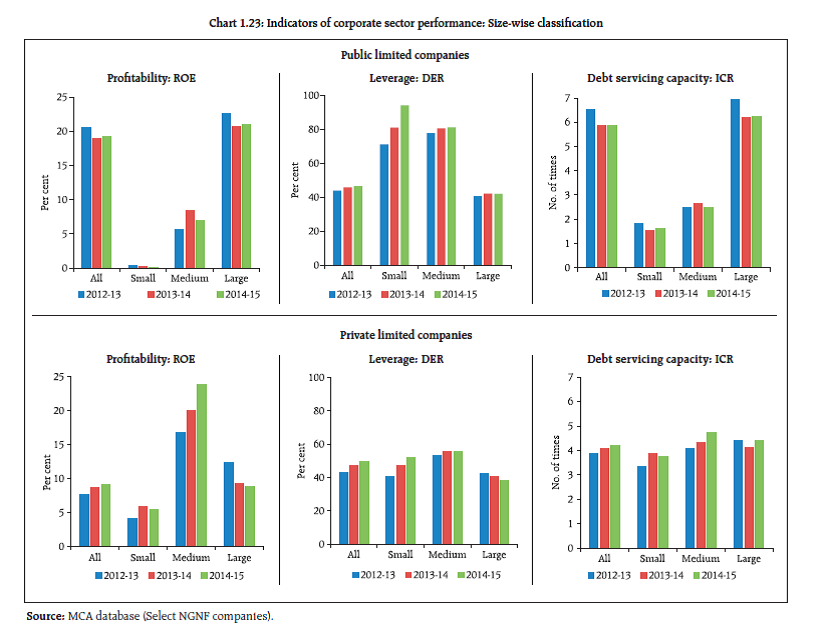 1.25 An analysis of performance of the corporate sector in various industries in 2014-15 in terms of return on equity (ROE), DER, ICR, total borrowings and bank borrowings are presented in Chart 1.24. The analysis shows that profitability of public limited companies in cement industry was the highest followed by aviation, vehicles, manufacturing, services and textiles. Profitability of public limited companies in construction, real estate, mining and paper was low. The public limited companies in electricity industry incurred losses in 2014-15. The private limited companies in aviation, manufacturing, textiles, paper and vehicle registered profits in 2014- 15, while cement, electricity, real estate and construction industries incurred losses. The iron & steel and mining industries exhibited low profitability. The leverage ratios of electricity and construction industries are higher for both public and private limited companies, whereas it was negative for public limited companies in aviation due to negative net worth at aggregate level. The ICR of aviation and electricity for public limited companies and real estate among private limited companies were lower than one.
 Debt servicing capacity and leverage 1.26 An analysis was undertaken using broad MCA data to identify the ‘weak’ and ‘leveraged weak’ companies and their share in total debt and bank borrowings (Chart 1.25). The analysis shows that 4,151 (24.5 per cent) public limited companies and 61,194 (25.8 per cent) private limited companies were ‘weak’ in the respective select sample in 2014-15. The DER stood at 3.3 for public limited companies and 1.6 for private limited companies which deteriorated from 2.5 and 1.4 in the previous year. In the select sample, 1,366 (8.15 per cent) public limited companies and 25,004 (10.5 per cent) private limited companies were ‘leveraged weak’. In the case of public limited companies, the share of bank borrowings of ‘leveraged weak’companies in total bank borrowings was 16.6 per cent. For private limited companies, the share of bank borrowings in the case of ‘leveraged weak’companies was 29.4 per cent. 1.27 An analysis was also undertaken to identify the ‘weak’ and ‘leveraged weak’companies and their share in total debt and bank borrowings in few select industries (Chart 1.25). Among the public limited companies, the percentage of ‘leveraged weak’ companies out of total companies in the respective industry was relatively higher in the case of electricity, construction, iron & steel, real estate, textiles and paper industries. For private limited companies, the percentages of ‘leveraged weak’ companies were more in electricity, construction, real estate, mining, paper, aviation and cement. The share in bank borrowings of ‘leveraged weak’ companies out of total bank borrowings in the respective industry was dominant in electricity, paper, construction and real estate in the case of public limited companies and electricity, construction, real estate and services in the case of private limited companies (Chart 1.26). Impact on bank credit 1.28 The ‘leveraged weak’ companies, with lower debt servicing capacity and high leverage, may exert pressure on the already deteriorated asset quality of bank loans in adverse situations. The credit extended by scheduled commercial banks (SCBs) to all NGNF companies was about 40 per cent of total bank credit as at end March 2015. Therefore, the overall impact20 on account of assumed default by ‘weak’ NGNF companies could be about 10.4 per cent of total bank credit of SCBs. The impact could be about 8.0 per cent in case of assumed default by ‘leveraged weak’NGNF companies (Table 1.3). However, a portion of bank credit to these companies could already be a part of the existing stressed advances (non-performing advances or restructured standard advances) of banks. 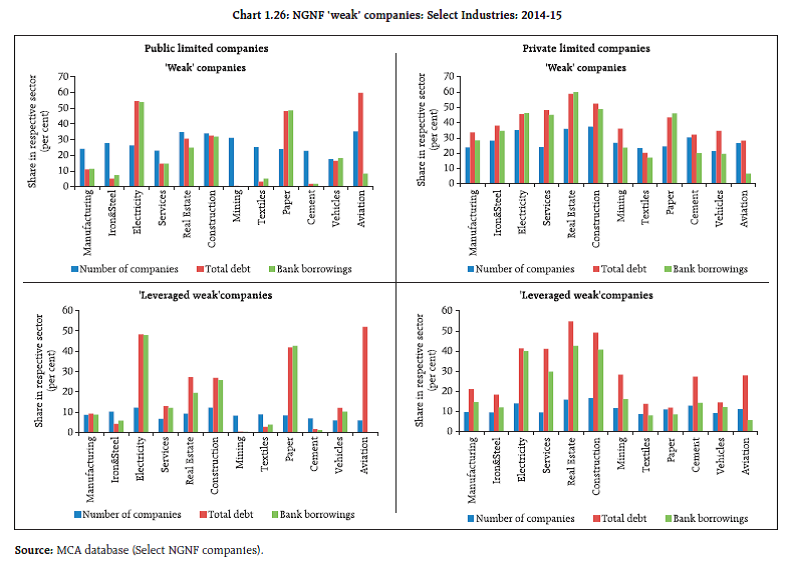 1.29 In this context it is pertinent to note that this position is based on MCA data of 2014-15 and the analysis of latest available data for a smaller sample (select NGNF listed companies) for 2014-15 and as well for 2015-16 indicate marginal improvement as discussed earlier in the chapter. Table 1.3: Impact of weakness in debt servicing capacity of NGNF companies on bank credit
(Share of bank credit in total bank credit of scheduled commercial banks) | | (per cent) | | | Mar-13 | Mar-14 | Mar-15 | | All NGNF companies | 31.5 | 38.5 | 40.0 | | Weak companies | 7.8 | 9.5 | 10.4 | | Leveraged weak companies | 5.6 | 6.8 | 8.0 | | Source: Basic statistical returns of scheduled commercial bank in India (BSR) and MCA database (Select NGNF companies). |
|