| ACRONYMS | | ADB | Asian Development Bank | | AEs | Advanced Economies | | ATM | Average Time to Maturity | | ATR | Average Time to Re-Fixing | | CIB | Capital Indexed Bond | | CPI | Consumer Price Index | | DMS | Debt Management Strategy | | EMDEs | Emerging Market and Developing Economies | | FPI | Foreign Portfolio Investor | | FRB | Floating Rate Bond | | FRBM | Fiscal Responsibility and Budget Management | | GDP | Gross Domestic Product | | GFD | Gross Fiscal Deficit | | GoI | Government of India | | G-Sec | Government Securities | | IBRD | International Bank for Reconstruction and Development | | IDA | International Development Association | | IIB | Inflation Indexed Bond | | IMF | International Monetary Fund | | MTDS | Medium-Term Debt Management Strategy | | MTFPS | Medium Term Fiscal Policy Statement | | NSSF | National Small Savings Fund | | POLIF | Post Office Life Insurance Fund | | RBI | Reserve Bank of India | | SLR | Statutory Liquidity Ratio | | T-Bills | Treasury Bills |
EXECUTIVE SUMMARY The objective of the debt management strategy (DMS) is to secure the government’s funding at all times at low cost over the medium /long-term while avoiding excessive risk. The DMS has been articulated in medium-term for a period of three years and it may be reviewed annually and rolled over for the next three years. The scope of debt management strategy is restricted to active elements of domestic debt management, i.e., marketable debt of the Central Government only. Over time, the scope would be progressively expanded to cover the entire stock of outstanding liabilities including external debt as well as General Government Debt including SDL. The estimations in the MTDS report has also incorporated the fiscal deficit targets mentioned in the Medium Term Fiscal Policy Statement (MTFPS) announced along with Union Budget 2015-16. The MTDS document comprises of three chapters, viz. Objective and scope of MTDS, Debt Profile of Central Government: Current Status and Strategic Objectives, and Medium Term Debt Strategy [2015-18]. The present debt profile of the Central Government is analysed with regard to cost, maturity and potential risk factors. The risk analysis contains metrics, such as, average time to maturity, analysis of the redemption profile, average time to refixing, percentage of outstanding debt maturing in next 12 months. It was found that the GoI’s debt structure is stable and risks are low. The debt management strategy revolves around three broad pillars, viz., low cost, risk mitigation and market development. Low cost objective is attained by planned issuances and offer of appropriate instruments to lower cost in medium to long-run, market conditions, preferences of various investor segments, improved transparency by way of a detailed issuance calendar. Following risk management tools have been adopted to reduce the risk associated with the sovereign debt: -
Adoption of portfolio management practices and creating prudent debt structure by containing rollover risk through switches / buy back; -
Lowering interest rate risk by keeping floating rate debt low; -
Managing foreign currency risk by issuing debt in domestic currency, developing stable domestic investor base and calibrated opening of G-sec market to foreign investors; and -
Reducing rollover risks by elongation of maturity and establishing limits on security issuances and annual maturities. Reserve Bank, in consultation with the Government, will continue its effort in development of the G-sec market by a series of measures such as introducing new instruments, expanding the investor base, strengthening market infrastructure, etc. Scenario analysis, which contains expected cost of debt based on the assumptions of future interest and exchange rates and future borrowing needs, are included. Debt sustainability indicators, such as, debt to GDP, average time to maturity and interest expense to GDP are projected. Stress tests of the debt portfolio on the basis of the economic and financial shocks, to which the government are exposed, are conducted and indicate a very low level of stress. The analysis confirms that the debt is stable, sustainable over medium to long run. Further, there are no short-term risks to the debt structure.
Chapter I Objectives and Scope of Debt Management Strategy Introduction 1. Public debt management plays an important role in macro-economic policy. It is a well-recognised fact that countries need efficient and effective public debt management as public debt portfolio is the largest portfolio in the economy and its impact could be felt across generations. Establishing and executing a strategy for managing government’s debt in order to raise the required amount of funding at low cost over the medium to long run, consistent with a prudent degree of risk is essential in this context. A prudential and efficient debt management strategy, taking into account the government debt profile in terms of maturity, currency composition and interest rate risk exposure is important for the sustainability of the budget, debt, and overall financial stability. 2. Medium-Term Debt Management Strategy (MTDS) is a plan that the government intends to implement over the medium-term (three to five years) in order to achieve a composition of the government debt portfolio that captures the government’s preferences with regard to the cost-risk tradeoff. The risks include refinancing/rollover risk, market (interest rate) risk, currency risk, etc.1 An MTDS provides a framework within which the authorities can make informed choices on how the government’s financing requirement should be met, while taking due account of constraints and potential risks. MTDS comprising of objectives, various benchmarks and portfolio indicators, and yearly issuance plan provides requisite direction to the debt management operations. Its articulation imparts information, transparency, and certainty and enables investors to plan their investments efficiently. 3. In emerging market and developing economies (EMDEs), the government is the largest borrower in its currency and remains continuously in the market. Therefore, it needs to avoid any opportunistic and time inconsistent strategy that even while succeeding in lowering the cost of borrowings in the short-run ends up increasing the cost of borrowings in the long run. The transparency in government's market borrowing operations is an important factor that determines its cost of borrowing and hence, maintaining continuous communication with the market becomes critical. The strategy also focuses on appropriate consultative process between debt management, monetary, fiscal, and financial regulatory authorities to facilitate proper functioning of public debt markets. Objectives of Debt Management Strategy 4. The objective of debt management strategy is to mobilise borrowings at low cost over medium to long-term subject to prudent levels of risk in debt portfolio. The debt structure must be stable and sustainable to ensure financial stability across time periods. Other objectives are to promote deep and liquid financial markets while providing benchmarks for pricing financial assets and maintain consistency with other macro-economic policies including monetary policy. The overall objective of the government debt management policy is to meet Central Government’s financing need at low cost and supporting development of a well-functioning and vibrant domestic bond market2. Indian approach 5. Debt management strategy is presently articulated and disclosed in Reserve Bank’s Annual Report and the Status Paper on Government Debt by the Ministry of Finance. In line with international sound practices, there is merit in articulating an explicit MTDS (for three year period; to be reviewed annually and rolled over for the next three years), dovetailed to our medium term fiscal framework in a consolidated document. MTDS is prepared for a period of three years, i.e., 2015-16 to 2017-18. This document will be reviewed annually and the projections will be carried forward on a rolling basis for the ensuing three years. 6. The document is organized as follows: Chapter II will provide a brief debt profile of the Government of India. Chapter III consists of risk analysis and management strategy. MTDS scenario analyses are provided in the Appendix. Scope of DMS 7. Internal debt of the Central Government constituted 92.9 per cent of public debt for 2014-15 (RE). Marketable instruments (dated securities and Treasury Bills) constituted 91.1 per cent of internal debt (84.6 per cent of public debt and 73.7 per cent of total liabilities) and are expected to remain at high proportion in the medium term. External public debt is negotiated bi-lateral and multilateral debt which has remained fairly constant for past five years and is not actively managed. In view of the foregoing, to begin with, the scope of debt management strategy is restricted to active elements of domestic debt management i.e., marketable debt of the Central Government only. Over time, the scope would be progressively expanded to cover the entire stock of outstanding liabilities including external debt as well as General Government Debt including SDL.
Chapter II
Debt Profile of Central Government: Current Status and Strategic Objectives Macroeconomic Environment 8. As reported in IMF’s World Economic Outlook (October 2015), global growth for 2015 is projected at 3.1 per cent, marginally lower than the growth in 2014. While growth in the advanced economies (AEs) is expected to witness a gradual pick-up, emerging market and developing economies (EMDEs) may slowdown. Global acivity is expected to gather some momentum in 2016. AEs reaped the benefit through easy financial conditions, neutral fiscal policy in the euro area, lower fuel prices, and improving labour market conditions. Growth slowdown in the EMDEs reflected structural bottlenecks, tighter external financial conditions, lower commodity prices, rebalancing in China, and economic distress related to geopolitical factors. Increased volatility in global financial markets has been creating challenges for the EMDEs. Both the AEs and EMDEs are faced with downside risks of increased financial market volatility, disruptive asset price shifts, lower potential output growth, geopolitical uncertainty and lower commodity prices. Uncertainty over the timing of the rate increase by the US Fed remain an immediate possible trigger for volatility in global financial markets and consequent capital outflow and exchange market pressures in EMDEs. 9. As per the recent revisions in the National Account Statistics (Base: 2011–12), economic growth in India is estimated to have improved to 7.2 per cent during 2014–15 from 6.9 per cent 2013-14. As stated in the Fifth Bi-monthly Monetary Policy Statement, 2015-16 (December 2015), the outlook for growth is improving gradually. On an assessment of the evolving balance of risks, output growth for 2015-16 is projected at 7.4 per cent. 10. The Monetary Policy Framework Agreement signed by the Government of India and the Reserve Bank in February 2015 has shaped the stance of monetary policy. Accordingly, the Reserve Bank will stay focused on ensuring that the inflation moderates durably, with Consumer price index (CPI) inflation targeted at 6 per cent by January 2016 and at 4 per cent by the end of 2017-18. Although the target for end-2017-18 and thereafter is defined in terms of a tolerance band of +/- 2 per cent around the mid-point of 4 per cent, it will be the Reserve Bank’s endeavour to keep inflation at or close to this mid-point, with the extended period provided for achieving the mid-point mitigating potentially adverse effects on the economy. Inflation based on all India CPI remained at 5.9 per cent during 2014-15 and remained below 6 per cent during 2015-16, so far. Central Government Debt Profile 11. Central Government's public debt consists of internal and external debt. Internal debt of the Central Government (Rs.52,78,217 crore, 37.4 per cent of GDP for 2015-16 (BE)) consists of fixed market borrowings, viz., dated securities and Treasury Bills. Dated securities (Rs. 44,17,787 crore, 31.3 per cent of GDP) accounted for 78.09 per cent of public debt while Treasury Bills (Rs. 4,20,365, 3 per cent of GDP) accounted for 7.43 per cent. The other items in internal debt are 14-Day Intermediate T-Bills (Rs. 86,816 crore), securities against small savings (Rs. 2,84,848 crore), securities issued to international financial institutions (Rs. 38,347 crore), compensation and other bonds (Rs. 9,160 crore) and special securities issued against Post Office Life Insurance Fund (POLIF) (Rs. 20,894 crore) which together constituted 7.8 per cent of public debt. External debt (Rs.3,79,331 crore, 2.7 per cent of GDP) constituted 6.70 per cent of the public debt of the Central Government. External debt is from multilateral agencies such as IDA, IBRD, ADB, etc. and small proportion of external debt originates from official bilateral agencies. There is no borrowing from international private capital markets. The public debt is predominantly internal and largely consists of fixed tenor and fixed rate market borrowings. The public debt increased by 157 per cent between 2008-09 and 2015-16 (BE) due to the measures taken by Government of India (GoI) to support the growth momentum against the backdrop of the global financial crisis (Table 2.1). It can be seen that nearly 93 per cent of the Government’s public debt is internal reflecting stable and adequate domestic sources of financing. Around 91 per cent of the internal loans are marketable debt borrowed at the cost which is determined by the market interest rate. | Table 2.1 Central Government Debt | | (Rs crore) | | | 2010-11 | 2011-12 | 2012-13 | 2013-14 | 2014-15 (RE) | 2015-16 (BE) | | 1 | 2 | 3 | 4 | 5 | 6 | 7 | | Public Debt (A+B) | 2945992 | 3553519 | 4096570 | 4615250 | 5142284 | 5657548 | | A. Internal Debt | 2667115 | 3230622 | 3764566 | 4240767 | 4775900 | 5278217 | | Marketable Debt (i)+ (ii) | 2283720 | 2860805 | 3360932 | 3853594 | 4351684 | 4838152 | | (i) Dated Securities | 2148851 | 2593770 | 3061127 | 3514459 | 3961381 | 4417787 | | (ii) Treasury Bills | 134869 | 267035 | 299805 | 339134 | 390303 | 420365 | | B. External Debt | 278877 | 322897 | 332004 | 374483 | 366384 | 379331 | | Source: Status Paper on Debt, DEA, MoF, GoI. | Cost of Borrowings 12. The weighted average coupon of outstanding debt stock of GoI are given in the Table 2.2 below. In spite of increased borrowings over the years, the weighted average coupon has remained broadly stable. The ratio of interest payments (IP) to revenue receipts (IR) also show a secular decline. The centre’s IP/RR was placed at 36.9 per cent in 2013-14 as compared to 53.4 per cent in 2001-02 (GoI, 20143). | Table 2.2: Borrowing Cost of Internal Debt | | Year | Weighted average coupon (%) of outstanding stocks | | 1 | 2 | | 2010-11 | 7.81 | | 2011-12 | 7.88 | | 2012-13 | 7.97 | | 2013-14 | 7.99 | | 2014-15 | 8.09 | 13. It is the endeavor of the debt manager to reduce cost over the medium to long-term as cost minimization attempted over the short-term may create sub-optimal debt structures with elevated refinancing risks. Reduction in cost is sought to be achieved over the medium-to-long run by formulating appropriate issuance strategy and developing financial markets. The borrowing needs are estimated and market borrowing programme is undertaken in a timely fashion to reduce the opportunity cost. Steps taken for lowering cost of borrowings also include planned issuance and offer of appropriate mix of instruments to cater to investor preferences. In line with international sound practice, transparency and predictability in borrowing plans (the issuance calendar for market borrowings is announced in advance for each half year with details of the quantum to be borrowed each week, maturity buckets, etc.) has ensured cost effectiveness. Risk Analysis 14. The sovereign debt portfolio is exposed to rollover risk, interest rate risks, creditor-concentration risks and currency/exchange rate risks, which needs to be identified, analyzed and managed. A popular method of managing such risks is by using strategic benchmarks. Rollover Risk 15. The rollover risk mainly encompasses the possibility of rolling over debt at relatively higher cost and in extreme circumstances, failure to rollover debt completely/ partially. Increasing share of short-term debt to the total debt reflects the rise in rollover risk. The rollover risk is more relevant in case of public debt as Governments, especially in EMDEs, generally have large fiscal deficit and they rollover the debt due for redemption during the year. Thus, high amount of rollover could pose a potential risk especially when market conditions are fragile. 16. In India, rollover risk is managed by elongating maturity, limiting short-term debt issuances and placing issuance limits for annual maturity bucket and individual security. Such limits are periodically reviewed keeping in view the macroeconomic environment and repaying capacity of the GoI. 17. The rollover risk could be gauged by analyzing metrics such as redemption profile, residual maturity and average time to maturity. Redemption Profile 18. The redemption profile of the Central Government’s market debt reveals that redemptions are at elevated level in less than 10 years maturity buckets (Annex Table 1 and Chart 2.1). 19. Outstanding market debt is concentrated in 5-10 years bucket, which at end of the March 2015 [maturities 2015-16 onwards] constituted 30.35% of total dated securities portfolio. However, this metric has moderated from 35% in 2013 to 31.53% in 2014 and again further to 30.35% in 2015 reflecting concerted effort of the Reserve Bank in elongation of maturity (Table 2.3). Securities maturing in 1-10 years maturity buckets constitute 58.59% of the total portfolio as of end-March 2015 as compared with 61.46 percent as of end-March 2014. As a result of our strategy of elongating the maturity profile of outstanding debt, maturity in 10-20 year bucket formed 21 per cent to 28 per cent between 2011 and 2015. | Table 2.3: Maturity Profile of Outstanding Central Government Dated Securities* | | (per cent of total) | | Maturity Bucket | End-March 2011 | End-March 2012 | End-March 2013 | End-March 2014 | End-March 2015 | | 1 | 2 | 3 | 4 | 5 | 6 | | Less than 1 year | 3.41 | 3.50 | 3.10 | 3.95 | 3.65 | | 1-5 Years | 25.54 | 26.70 | 27.90 | 25.99 | 24.59 | | 5-10 Years | 34.09 | 34.70 | 35.00 | 31.52 | 30.35 | | 10-20 Years | 21.42 | 22.00 | 22.90 | 25.20 | 28.32 | | 20 years and above | 15.53 | 13.10 | 11.20 | 13.34 | 13.09 | | * Without special securities. | 20. While including special securities, the share further rises to 33 per cent. Thus, the redemption of the special securities is bunched during the years 2020-2027 (Chart 2.2 and Annex Table I). 21. The high concentration of outstanding debt in less than 10 years maturity bucket can be attributed to: (i) large issuance of short-term securities during crisis period (2008-10) when markets conditions turned fragile and demand for long-term securities dwindled significantly; and (ii) a major chunk of the market borrowing programme being completed through 10 years security over the years as this maturity is most liquid point on the yield curve. 22. Residual Maturity Analysis shows that the share of short-term debt (less than 1 year) in GoI’s outstanding market debt has come down significantly in recent years. If the special securities are included in the analysis, then the share of short-term debt is 3 per cent as at end-March 2015. At the same time, the share of maturity between 1-5 years in outstanding market debt moderated from about 26 per cent as on end-March 2011 to about 25 per cent as on end-March 2015. Including special securities, the share was about 23 per cent as on end-March 2015. Weighted Average Maturity / Average Time to Maturity 23. A relatively high weighted average maturity (WAM) of debt [also referred to as average time to maturity (ATM)] would result in a lower share of debt rolled over in a year. Elongation of maturity of the portfolio is preferred strategy to limit rollover risk. Strategy of elongation of maturity has been followed since 2010-11. The WAM of outstanding stock of Indian Government bonds declined in wake of issuance of short tenor bonds in the aftermath of financial crisis. As a result, WAM of Central Government’s market debt that had come down from 10.59 years as on end-March 2008 to 9.60 years on March-end 2012, however, again increased to 10.23 years on end-March 2015 (Table 2.4 and Chart 2.3) indicating low / very modest rollover risk. | Table 2.4: Weighted Average Maturity (in years) | | Year | Issuances during the year | Outstanding as on end-March | | 1 | 2 | 3 | | 2010-11 | 11.62 | 9.64 | | 2011-12 | 12.66 | 9.60 | | 2012-13 | 13.50 | 9.67 | | 2013-14 | 14.22 | 10.00 | | 2014-15 | 14.67 | 10.23 |
24. International comparison shows that India is among the countries having high ATM of domestic debt. Based on this indicator, rollover risk does not pose a major challenge for debt management in near future. Share of Short-term Debt 25. The percentage of short-term debt4 increased from 3.41 per cent at end-March 2011 to 3.65 per cent at end-March 2015 [3.57 per cent on end-March 2011 to 3.47 per cent on end-March 2015 (including special securities)] (Chart 2.4). 26. With inclusion of T-Bills [i.e. the short-term securities (91, 182, 364 DTBs)], the percentage maturing in the next 12 months has broadly declined from about 12 per cent in 2011-12 to about 11 per cent in 2014-15. (Table 2.5). The share of short-term debt to total debt is not very high and poses low rollover risk. | Table 2.5: Short-term debt | | (Rs. crore) | | Year | Dtd sec mat in next 12 months (incl. sp. Sec) | Total o/s of dtd sec (incl sp. Sec) | T-Bills O/S during the year | Total redemption in next 12 months (incl. T-Bills) | Total O/s (dtd sec. + sp. Sec + T-Bills) | % mat in next 12 months (dtd. Sec + sp. Sec + T-Bills) | | 1 | 2 | 3 | 4 | 5 | 6 | 7 | | 2010-11 | 84275 | 2362437 | 133574 | 217849 | 2496011 | 8.73 | | 2011-12 | 96679 | 2795156 | 267000 | 363679 | 3064920 | 11.96 | | 2012-13 | 95259 | 3256477 | 299764 | 366443 | 3556241 | 11.11 | | 2013-14 | 142400 | 3716495 | 339766 | 395023 | 4056261 | 11.89 | | 2014-15 | 144366 | 4158157 | 349624 | 482166 | 4507781 | 10.96 | 27. Thus, it may be concluded that the average time to maturity (ATM) has increased and remained at elevated level suggesting that rollover risk does not pose a challenge. However, the analysis of the redemption profile and residual maturity shows increased concentration in less than 10 years maturity bucket and it could create some stress in terms of cost going forward. Thus, the concentration risk may be addressed by switches/ buybacks in a phased manner. Market Risks 28. Market risks are generally associated with movements in interest rates and exchange rates, which impact the interest cost and repaying capacity. Market risks of outstanding debt of the Central Government have been analyzed with respect to interest rate changes and cost of market borrowing through indicators such as fixed to floating rate debt ratio, average-time to re-fixing, percentage maturing in next 12 months and percentage of re-fixing in next 12 months. 29. Fixed–Floating Rate Debt Ratio: Variety of instruments have been introduced to cater to the preferences of different investors. Banks and financial institutions prefer to invest in floating rate bonds (FRBs) for their duration management while insurance companies, provident funds, pension funds prefer to buy long-term bonds, zero coupon bonds and inflation indexed bonds (IIBs) for their liability management. Floating rate instruments carry interest rate risks on re-fixing. In India, though a variety of instruments, such as, fixed rate conventional bonds, FRBs, Zero Coupon Bonds, Capital Indexed Bonds (CIBs) have been issued, the contribution of linkers (FRBs, IIBs, etc.) has remained small (floating rate debt constitutes around 0.55% of marketable debt at end-March, 2015), thereby limiting interest rate risk in the debt portfolio (Table 2.6). | Table 2.6: Floating Rate Instruments | | (Rs. crore) | | Year | Total Borrowings | Floating Rate | | FRBs | IIBs | | 1 | 2 | 3 | 4 | | 2010-11 | 4,37,000 | 3,000 | - | | 2011-12 | 5,10,000 | 5,000 | - | | 2012-13 | 5,58,000 | 0 | - | | 2013-14 | 5,69,500 | 0 | 6,500 | | 2014-15 | 5,92,000 | 0 | 0 | Average Time to Re-fixing 30. The average time to re-fixing (ATR) indicates the exposure of the outstanding portfolio to the interest rate changes. The ATR of the Central Government’s market debt increased marginally from 9.95 years as on end-March 2014 to 10.19 years as on end-March 2015, indicating decrease in interest rate risk. Percentage Maturing 31. Another measure of interest rate risk is the amount of debt maturing in the next 12 months as percentage of outstanding amount. As mentioned earlier, the percentage of outstanding market debt maturing in next 12 months has broadly declined. This trend indicates that the magnitude of debt that needs to be funded at current interest rates is lower. This indicator is further expanded by including Floating Rate Bonds (FRBs) in the maturing amount to display the trend in percentage of outstanding debt due for re-fixing in the next 12 months. This indicator will reflect extent of market debt exposed to interest rate changes. The percentage of outstanding dated securities (including special securities) due for re-fixing in next 12 months has come down from about 4.95 per cent on end-March 2011 to about 4.17 per cent on end-March 2015 (Chart 2.5). 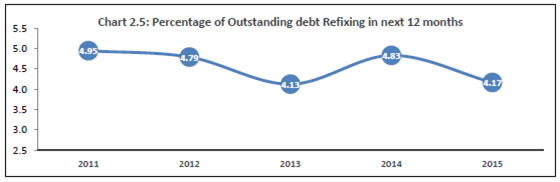 32. Including Treasury Bills issuances, the amount exposed to the interest rate risk as a percentage of outstanding amount (including special securities) has decreased from 13.09 per cent as on end-March 12 to 11.6 per cent as on end-March 2015 (Table 2.7). | Table 2.7: Percentage Re-fixing in 12 Months | | Year | Securities to be re-fixed (dt sec+FRBs+IIBs) | Securities to be re-fixed as % of total O/s | Securities to
be refixed
(including T-Bills) | Securities to be re-fixed (incl. T-Bills) as % of total O/s | | 1 | 2 | 3 | 4 | 5 | | 2010-11 | 116931 | 4.95 | 250505 | 10.04 | | 2011-12 | 133966 | 4.79 | 400966 | 13.09 | | 2012-13 | 134359 | 4.13 | 434123 | 12.21 | | 2013-14 | 179645 | 4.83 | 519411 | 12.81 | | 2014-15 | 173216 | 4.17 | 522840 | 11.60 | Creditor-Concentration Risk / Sudden Stop Risk 33. An important feature of investor profile of the G-Sec market is the dominance of domestic investors and limited foreign investor participation. The ability of domestic market to finance government operations is a source of strength of the debt portfolio which is insulated from the currency risk. Strategy framework is geared towards continued issuance to domestic investors while focusing on widening the investor base. Investment limits for the Foreign Portfolio Investors (FPIs) had been enhanced in a phased manner to US$ 30 billion in G-Sec. In Sep 2015, RBI announced Medium Term Framework (MTF) for a more predictable regime for investment by FPI in Govt. Securities The limits are apportioned to different categories of investors with preference towards long-term stable investors and investments in longer maturities keeping in view the sensitivity of foreign investors to global macro-economic / financial factors and possible sudden reversals, which could potentially impact the systemic stability. Participation of foreign investors in the domestic bond markets also needs to be examined in the light of our policy stance relating to calibrated approach to capital account convertibility and the possibility of interest rate and exchange rate volatility due to reversal of capital flows. 34. The domestic investor base is dominated by commercial banks in short to medium tenor securities and by insurance companies and provident funds at the long end. However, the share of the commercial banks has been declining over the years. With the entry of co-operative banks, regional rural banks, pension funds, mutual funds and non-banking finance companies, the institutional investor base has been reasonably diversified. For further diversifying the investor base, especially in context of calibrated reduction in mandated investments in form of Statutory Liquidity Ratio (SLR), efforts to improve demand from new investors, such as, pension funds and retail investors are being taken. Several steps are taken to promote retail participation, such as, enabling non-competitive bidding in primary auctions to enable non-institutional investors to participate in auction, introduction of odd lot5 trading, improving trading of G-Sec on stock exchanges; mandating retail6/ mid-segment7 targets for primary dealers, web-based trading access to gilt account holders, etc. (Table 2.8) are being put in place. The process of developing the retail and mid-segment investor base will be continued to maintain stable demand for G-Sec from varied investor groups. | Table 2.8: Ownership Pattern of GoI Dated Securities (% to total) | | Category | Mar 2008 | Mar 2014 | Mar 2015 | | 1 | 2 | 3 | 4 | | Commercial Banks | 51.26 | 44.46 | 43.30 | | Non-Bank PDs | 0.34 | 0.11 | 0.31 | | Insurance Companies | 24.78 | 19.54 | 20.87 | | Mutual Funds | 0.79 | 0.78 | 1.89 | | Co-operative Banks | 3.22 | 2.76 | 2.62 | | Financial Institutions | 0.41 | 0.72 | 2.07 | | Corporates | 3.48 | 0.79 | 1.25 | | FIIs | 0.52 | 1.68 | 3.67 | | Provident Funds | 6.38 | 7.18 | 7.58 | | RBI | 4.78 | 16.05 | 13.48 | | Others | 4.38 | 5.92 | 2.96 | Currency / Foreign Exchange Risk 35. Currency /Foreign Exchange risk relates to vulnerability of the debt portfolio to depreciation or devaluation in the external value of the domestic currency, and thereby increase in the government’s debt servicing cost. 36. Achieving appropriate and stable mix of domestic and foreign currency debt in portfolio is essential for stability of debt portfolio. Raising debt in foreign currency could be cost effective and provide a wide and varied investor base. A country with large foreign currency denominated liabilities is, however, exposed to “currency/exchange rate risks” which could impact macro-economic stability. Further, dependence on foreign currency debt could mean sharp volatility in interest rate and market volumes linked to the uncertainty of external events. 37. As a conscious strategy, issuance of external debt (denominated in foreign currency) is kept very low in India and external debt as percentage of Central Government’s public debt has come down from around 12 per cent in 2006-07 to around 7.5 per cent during 2014-15 (Table 2.9). The external debt in Indian context is entirely bilateral and multilateral loans. | Table 2.9: India’s Internal and External Debt | | (Rs. crore) | | Year | Internal Debt | External Debt | Public debt | External Debt as % of Public Debt | | 1 | 2 | 3 | 4 | 5 | | 2010-11 | 26,67,115 | 2,78,877 | 29,45,992 | 9.5 | | 2011-12 | 32,30,622 | 3,22,897 | 35,53,519 | 9.1 | | 2012-13 | 37,64,566 | 3,32,004 | 40,96,570 | 8.1 | | 2013-14 | 42,40,767 | 3,74,483 | 46,15,250 | 8.1 | | 2014-15 (RE) | 47,75,900 | 3,66,384 | 51,42,284 | 7.1 | | 2015-16 (BE) | 52,78,217 | 379331 | 5657548 | 6.7 | | Source: Status Paper on Debt, DEA, MoF, GoI. | 38. To sum up, market risk analysis reveals that investor base is stable and diversified. The debt structure of the country is placed prudently on various risk parameters. To continue with the low risk debt structure and to attain the debt management objectives of low cost, the MTDS needs to be adopted, which is detailed in the next chapter.
Chapter III
Medium-Term Debt Management Strategy [2015-18] 39. In the backdrop of a low risk portfolio with reasonable cost, MTDS will continue the strategy being followed hitherto, for maintaining the low risk and sustainable debt structure while ensuring that Government of India's financing needs are appropriately met. The development of the government securities market will continue to be the important strategic objective in medium-term. Debt management strategy would be based on three broad pillars viz., low cost, risk mitigation and market development. 40. For the years 2015-16 to 2017-18 debt strategy, it is assumed that economy will record moderate to reasonable growth, a moderation in inflation as per the path projected by Reserve Bank and financial stability. Notwithstanding global uncertainties, Indian economy is expected to remain resilient due to favourable domestic macroeconomic factors backed by stable growth with low inflation. Scenario analysis about the projected debt structure in the medium-term as per baseline scenario is presented in the Appendix along with results of stress test on the baseline scenario. Raising Debt at Low Cost 41. Low cost is sought to be achieved over medium to long-run by formulating appropriate issuance strategy while at the same time developing the financial market. The borrowing requirements are estimated and the said amounts are borrowed by issuance of borrowing calendar thereby reducing the opportunity cost. Proper demand estimation, planned issuance and offer of appropriate instruments would aid in lowering costs. 42. In India, the issuance calendar for market borrowings is announced in advance for each half year with details of the quantum to be borrowed each week, maturity buckets, etc. Around five days prior to the auction, individual securities along with their issuance size is notified to public. This strategy of sharing information about debt management has enhanced transparency of debt management operations and ensured successful completion of borrowings in non-disruptive manner at a reasonable cost. This practice will be continued during the MTDS period. 43. In order to meet the demand for the government bonds, borrowings are planned keeping in view the investment preferences/horizons of various investors. Although the share of the commercial bank has declined in recent years, they remain the predominant investors in G-Sec. As commercial banks remain largely interested in short/medium tenor bonds, there is a substantial issuance in this tenor. Longer tenor bonds are issued keeping in view demand from insurance companies and provident funds. Recognizing the need for an appropriate debt portfolio structure and mitigation of rollover risk, issuance of short tenor securities (maturing in 10 years constituting nearly 60 per cent of total debt) has been significantly moderated. This strategy would continue during MTDS period. Analyzing the Cost- Risk trade-off of this strategy, though this may increase cost due to issuance in longer tenors, there is substantial risk reduction due to elongation of maturity. The cost of the strategy is expected to be very low / marginal in view of current yield curve. 44. Investor Relations: Investor relations assume critical importance to the successful completion of borrowing programme. The emphasis of investor relations for policy transparency and ensuring proactive dialogue between sovereign debt issuers and investors is fundamental to sound debt management. Regular, proactive investor meetings (primary dealers and other institutional investors) have enabled the Reserve Bank and Government to understand and communicate better with the investors, address concerns and engage in market consultation thereby obtaining valuable inputs for the sovereign debt management. This has made it possible for investors to become better informed about the debt management strategy. This consultative process and proactive investor relations would continue during the MTDS period. Risk Mitigation: 45. The debt portfolio, which is exposed to rollover risk, currency/exchange rate risks, sudden-stop risks and interest rate risks needs to be measured / monitored and managed. 46. Rollover / Refinancing Risk: A conscious strategy of elongating maturity to lessen rollover risk has been adopted. To alleviate the redemption pressures in less than 10 years maturity buckets in future and further moderate rollover risk, the share of securities having a residual maturity of less than 10 years would be brought down to 55% by fiscal year 2020-21 from present level of 58.59% (as at end-March March 2015). This can be achieved by appropriate issuance strategy and undertaking switches/ buybacks from less than 10 years maturity. This would help in reducing the redemption concentration and create space for further issuances that may be needed to meet the demand of market participants interested in this segment. Issuance strategy focusing on moderate issuance in less than 10 year maturity bucket and increasing issuance in 10–14 years tenor, which sees robust demand from banks and other market participants as well as increased issuance of bonds in tenors more than 15 years to cater to needs of insurance companies and provident funds would continue. Issuance of longer tenor bonds beyond 30 years will be undertaken to match demand from insurance companies and provident funds. In October 2015, 40-years bond were issued first time wherein the demand was quite robust. With an objective to smoothen redemptions, switching of short-tenor bonds maturing at proximate years with long-tenor bonds will be undertaken and is expected to reduce rollover risks. To take the process forward, ‘switch calendar’ would be announced with a focus on effective liability management. 47. Currency Risk: Achieving appropriate and stable mix of domestic and foreign currency debt in portfolio is essential. As a conscious strategy, issuance of external debt (denominated in foreign currency) is kept very low in India. The sensitivity of foreign investors to global macro-economic factors, which could trigger possible sudden reversals and potentially impact the systemic stability, would be kept in view. Participation of foreign investor in the domestic bond markets also needs to be monitored in the light of our policy stance relating to calibrated approach to capital account convertibility and the possibility of interest rate and exchange rate volatility due to reversal of capital flows. Taking into account these issues, MTDS would attempt calibrated approach in improving foreign currency debt. 48. Interest Rate Risk: Issuance of variety of instruments of varying features and maturities such as floating rate bonds (FRBs), coupon bonds and inflation indexed bonds (IIBs) to cater to the preferences of different investors would help in achieving debt management objectives. For issuer, floating rate instruments carry interest rate risks on re-fixing. In India, although variety of instruments, such as fixed rate conventional bonds, FRBs, Zero Coupon Bonds, Capital Index Bonds have been issued; the contribution of linkers (FRBs, IIBs, etc.) has remained small, thereby limiting interest rate risk in the debt portfolio. Issuance of floating rate instruments would improve the breadth and width of the G-Sec market and enable market participants to diversify their portfolio. Towards this end, issuance of floating rate instruments will be taken up depending on the market conditions and emergent demand. Strategic Benchmarks 49. A strategic benchmark represents the desired structure or composition of a liability portfolio in terms of characteristics such as interest rate and currency mix and overall maturity. It is a management tool for the government to evaluate its risk tolerance and clarify its portfolio preferences with regard to expected cost, market risk and rollover risks. Overtime, a debt structure has been created that is low on risk and at reasonable cost. The benchmarks that are set for MTDS period are designed to ensure that the debt structure risk remains low. The strategic benchmarks set are as under: Share of Short-Term Debt8 50. The share of short-term debt is set at benchmark of 10 per cent of total debt. As there may be unforeseen developments, which could necessitate higher issuance of short-term paper, a leeway of +/- 3% has been maintained. | Indicator | Benchmark Share of Short- Term Debt (in per cent) | Leeway (in per cent) | | 1 | 2 | 3 | | Domestic Marketable Debt – Short-term | 10 | ± 3 | Average Maturity of Debt 51. In line with the strategy of elongating maturity, the proposed benchmark for average maturity of the debt portfolio is as under: | Indicator | Benchmark (in years) | Leeway (in years) | | 1 | 2 | 3 | | Weighted Average Maturity of Debt | 10 | ± 2 | Issuance Limits 52. To ensure that debt rollover is within manageable levels every year the upper issuance limit for annual maturity bucket and also for individual security in a particular annual maturity bucket are capped. This limit is calculated on the basis of a sustainable debt trajectory, projected increase in debt stock, government’s cash flow imperatives, etc. The limits are periodically reviewed keeping in view the macroeconomic environment and repaying capacity of the Government. In view of large borrowing programme and to ensure supply of securities across the yield curve, the limits could be enhanced incrementally in a calibrated manner as the rollover risks are being addressed through switches. Indexed and Floating Debt 53. Keeping in view of the portfolio diversification benefits associated with issuance of IIBs and FRBs, It is proposed to fix a target share of indexed debt and FRBs subject to market conditions and emergent demand for better investor participation. The proposed benchmark share is as under:- | Indicator | Benchmark Share (in per cent) for issuances during fiscal year | Leeway
(in per cent) | | 1 | 2 | 3 | | Indexed and Floating Debt | 5 | ± 2 | Share of Domestic to External Debt 54. Continuing the strategy to insulate the sovereign debt from currency risks, the share of external debt to total debt would be kept around current levels during MTDS period. This benchmark share may be maintained with a leeway to provide for contingencies and cushion for valuation changes. The proposed benchmark for external debt is as follows:- | Indicator | Benchmark Share
(in per cent) | Leeway
(in per cent) | | 1 | 2 | 3 | | External debt | 8 | ± 3 | Market Development 55. As an efficient market would price debt efficiently i.e. at the lowest possible cost to the Government, a major debt management objective is to improve the efficiency of the Government securities market. Government constantly endeavours to improve the functioning of the G-sec market and augment liquidity. 56. Market liquidity impacts the current yields and thus, it poses a great amount of interest rate risk for the Government debt as borrowing required to finance gross fiscal deficit (GFD) and rollover of the redemption amount happen at the current market yields. The liquidity in G-Sec improved significantly in the last few years as can be seen by lower bid-ask spreads, higher trading volumes, low impact cost and improvement in turnover ratios. 57. Going forward, it would be desirable to further improve the liquidity in G-Sec market and also broad-base the same in order to minimise the interest rate risk emanating from illiquidity premium for Government debt. Measures to improve the liquidity in G-Sec market would include steps to consolidate issuances, further enhance transparency in issuance process to enable investors to plan investments, building critical mass in benchmark issues, etc. Strategically, Primary Dealer system will be effectively used for both primary and secondary market development. It has been proposed to allow PDs for market making in identified semi-liquid securities. Actions to be taken for implementing the Strategy objectives 58. In order to achieve the objectives of the 2015 - 2018 Strategy, the following actions will be taken: -
Carry forward transparent issuance process by providing clear information on borrowing programme to investors and having continuous investor interaction and appropriate consultation; -
To build benchmark issues by issuing significant volumes and take advantage of liquidity premia; -
Elongate the maturity of the debt portfolio; -
Build a balanced maturity profile and supply along the yield curve; -
To issue a variety of instruments such as inflation linked bonds that would help the investors to manage their portfolio more efficiently; -
To undertake switches / buybacks for effective liability management; -
Continue development of domestic investor base and calibrated opening of the government securities market to foreign investors and retail investors; -
Continue passive consolidation with large benchmark issuances and explore for active consolidation through buy-backs / switches/ conversions; -
Diversify the investor base and encourage retail and mid-segment investors participation in G-Sec market.
Appendix MTDS Scenario Analysis Assumptions 1. The MTDS is developed for the period 2015-16 to 2017-18 based on the outstanding GoI market borrowing as on end-March 2015. The key assumptions involved in formulation of the MTDS are as follows: a) The MTDS is prepared for internal debt only as external debt forms a very small component in public debt. Moreover, major part of the sovereign external debt borrowed by the GoI is from multilateral/bilateral agencies, e.g., IDA, World Bank and IMF which does not bear serious risks. Further, India does not issue any sovereign bonds globally. However, in circumstances, which are detrimental to the external sector, the Reserve Bank would manage the external debt in coordination with the GoI. b) The Union Budget for 2015-16, in the Medium Term Fiscal Policy Statement (MTFPS), has provided that Government of India (GoI) would be on the fiscal consolidation path by reducing the GFD to 3.9 per cent of GDP in 2015-16 from 4.1 per cent in 2014-15. As per MTFPS, GFD is targeted for 3.5 per cent in 2016-17 and at 3.0 per cent from 2017-18 onwards. c) Indian economy is expected to gain momentum from 2015-16 onwards facilitated by pick-up in economy activity supported by monetary policy easing by the Reserve Bank. Nominal GDP is expected to grow by 11.5 per cent, both in 2014-15 and 2015-16. With gradual growth acceleration and under assumptions of continuing price stability, the growth rate of the GDP at current market prices during 2016-17 and 2017-18 is assumed to be around 12.2 per cent and 12.4 percent respectively (MTFPS, Union Budget 2015-16). d) Borrowing cost in the domestic market is expected to be lower in 2015-16 due to reversal in the interest rate cycle. e) Switches of Rs. 30,000 crore are expected to be conducted in 2015-16 and Rs. 50,000 crore each in 2016-17 and 2017-18. f) Domestic inflation as measured by combined CPI inflation is expected to follow the inflation targeting path adopted by the Reserve Bank. The CPI inflation has been pegged at under 6 per vent by January 2016, with the goal for 4 per cent from 2016-17 onwards, with band of +/- 2 per cent. g) Exchange rate risk is assumed to be nil/negligible as the GoI market borrowing is fully from the domestic market in terms of Indian rupee. 2. Net market borrowing as a proportion of GDP is expected to fall from 33 per cent in 2014-15 to 31 per cent in 2017-18 reflecting fiscal consolidation (Table A1). | Table A1: Borrowing (Baseline) Assumption | | (Rupees crore) | | Year | GDP Growth (%) | GFD/GDP (%) | Wtd. Avg. Cost (%) | Gross Borrow
(Rs. cr) | Repayment | Net Market Borrowing | | 2013-14 | 13.6 | 4.4 | 7.98 | 563,500 | | 476397 | | 2014-15 | 11.5 | 4.1 | 8.08 | 592,000 | 130251 | 504374 | | 2015-16 | 11.5 | 3.9 | 7.83 | 600,000 | 144366 | 486193 | | 2016-17 | 12.2 | 3.5 | 7.68 | 631,982 | 173330 | 498652 | | 2017-18 | 12.4 | 3.0 | 7.53 | 642,190 | 206774 | 480416 | Note:
(1) Market borrowing is for GoI dated securities above one year.
(2) GDP at market prices is assumed to grow by 11.5% each year till 2015-16 and at 12.2 per in 2016-17 and 12.4 per cent in 2017-18 (MTFPS, Union Budget 2015-16).
(3) Gross market borrowing is calculated based on the fiscal deficit target envisaged in the MTFPS. | Demand Assessment 3. Banking sector holds the maximum portion of the outstanding Government dated securities. Banks’ holding of G-Sec has come down in the recent past, which may partly be attributed to reduction in SLR (from 23 per cent to 22.5 per cent w.e.f. fortnight beginning June 14, 2014). The SLR was further reduced by 50 bps each in August 2014 and February 2015 to 21.5 per cent of their NDTL. RBI will allow this to be lowered to 20.5 per cent by March 2017. Notwithstanding reductions in SLR, it is expected that there would be reasonable demand in the medium term as credit offtake remains lower. 4. The cash flows of insurance companies, mutual funds, pension funds, etc. have improved in the recent past reflecting upturn in economic activity. Based on the past trends, it has been presumed that premium collections by life insurance companies would remain higher in the ensuing years which are expected to increase by about 10 per cent. Going by past trend (share in G-Sec at around 20 per cent), insurance companies would have a reasonable demand for G-Sec in the medium-term. Borrowing Strategy 5. Borrowing strategy has been prepared in such a manner that the maturity profile is elongated to reduce redemption pressures in the near term. As a result, no market borrowing has been proposed in the 0-5 year time bucket. Market borrowing in the 5-9 years bucket has been proposed to reduce from 19.4 per cent to total in 2014-15 to 15.5 per in 2017-18 (Table A2). As there is high demand for securities in the 5-14 years bucket, the proportion of borrowing in this bucket is not reduced to avoid disruptions in the borrowing programme and its impact on pricing of securities. Strategy for market borrowing in the 15-19 years bucket has been increased from 16.6 per cent in 2014-15 to 18.0 per cent in 2017-18. Borrowing in the 20 years and above segment is assumed to increase from 18.8 per cent in 2014-15 to 20.0 per cent in 2017-18. | Table A2: Borrowing Strategy | | (per cent to total) | | Maturity Bucket | 2013-14 | 2014-15 | 2015-16 | 2016-17 | 2017-18 | | Less than 5 years | 0.4 | 0.0 | 0.0 | 0.0 | 0.0 | | 5-9 years | 24.5 | 19.4 | 16.5 | 16.0 | 15.5 | | 10-14 years | 41.8 | 45.3 | 44.5 | 44.0 | 43.5 | | 15-19 years | 16.5 | 16.6 | 19.0 | 19.5 | 20.0 | | 20 years and above | 16.9 | 18.8 | 20.0 | 20.5 | 21.0 | | Total | 100.0 | 100.0 | 100.0 | 100.0 | 100.0 | MTDS and Debt Sustainability 6. The above mentioned market borrowing strategy would lead to an increase in average time to maturity (ATM) from 14.9 years in 2014-15 to 16 years in 2017-18 (Table A3). Debt-to-GDP would fall from 32.9 per cent in 2014-15 to 31 per cent in 2017-18. The ratio of interest expense to GDP is projected to decline from 2.7 per cent in 2014-15 to 2.3 per cent in 2017-18. MTDS exercise points to the fact that if the medium-term fiscal policy path announced in the Union Budget 2015-16 is strictly followed, then there could be an improvement in the debt sustainability indicators. | Table A3: Debt Sustainability Indicators (Baseline Scenario) | | (per cent) | | Year | Debt / GDP (%) | Avg. Time to Maturity (years) | Interest / GDP (%) | | 2013-14 | 32.7 | 14.2 | 2.6 | | 2014-15 | 32.9 | 14.9 | 2.7 | | 2015-16 | 32.7 | 15.6 | 2.6 | | 2016-17 | 32.0 | 16.0 | 2.5 | | 2017-18 | 31.0 | 16.4 | 2.3 | 7. Alternative strategies have been formulated under two different scenarios. The first scenario assumes that Indian economy would grow at a higher pace than that projected in the MTFPS reflecting reduction in the policy rate by the Reserve Bank while the second scenario assumes adverse economic conditions and corrective counter cyclical measures. It may be mentioned that such scenarios have been built up for the purpose of showing the outcome in case of positive and adverse scenarios, which are based on certain assumptions. However, the baseline scenario is expected to be somewhat closer to the reality. In the first scenario, nominal GDP is assumed to grow at the rate of 13.5 per cent, 14.0 per cent and 14.5 per cent respectively in 2015-16, 2016-17 and 2017-18 (Table A4). Under this scenario, the fiscal path is expected to be the same as envisaged in the MTFPS. A higher GDP would prompt for higher borrowing requirement to finance the fiscal deficit. However, borrowing strategy is assumed to be the same as envisaged in the baseline scenario. | Table A4: Assumptions (Scenario I) | | Year | GDP Growth (%) | GFD/GDP (%) | Wtd. Avg. Cost (%) | Gross Borrowing (Rs. cr) | | 2013-14 | 13.6 | 4.4 | 7.98 | 563,500 | | 2014-15 | 11.5 | 4.1 | 8.08 | 592,000 | | 2015-16 | 13.5 | 3.9 | 7.58 | 604,635 | | 2016-17 | 14.0 | 3.5 | 7.33 | 659,070 | | 2017-18 | 14.5 | 3.0 | 7.08 | 682,936 | 8. Such an optimistic scenario of a very high GDP, however, would improve the sustainability indicators as those compared with the baseline scenario due to adherence to the fiscal correction path (Table A5). Debt-to-GDP ratio would improve from 32.9 per cent in 2014-15 to 29.7 per cent in 2017-18. Interest payments/GDP ratio also improves from 2.7 per cent in 2014-15 to 2.1 per cent in 2017-18. | Table A5: Sustainability Indicators (Scenario I) | | Year | Debt / GDP (%) | Avg. Time to Maturity (years) | Interest / GDP (%) | | 2013-14 | 32.7 | 14.2 | 2.6 | | 2014-15 | 32.9 | 14.9 | 2.7 | | 2015-16 | 32.1 | 15.7 | 2.4 | | 2016-17 | 31.1 | 16.2 | 2.3 | | 2017-18 | 29.7 | 16.4 | 2.1 | 9. The second scenario assumes adverse economic conditions where economic growth slips below the projections in the MTFPS and inflation remains higher than the target. Consequently, the Reserve Bank would opt to follow monetary policy tightening to tame inflationary expectations. Such a scenario may lead to slippage in the fiscal correction path as envisaged in the MTFPS due to imposition of counter cyclical measures leading to higher market borrowing (Table A6). Requirement of a higher quantum of borrowing from the market to meet the high fiscal deficit may lead to higher cost. As a result, weighted average cost is assumed to grow from 8.08 per cent in 2014-15 to 9.58 per cent in 2017-18. | Table A6: Assumptions (Scenario II) | | Year | GDP Growth (%) | GFD/GDP (%) | Wtd. Avg. Cost (%) | Gross Borrowing (Rs. cr) | | 2013-14 | 13.6 | 4.4 | 7.98 | 563,500 | | 2014-15 | 11.5 | 4.1 | 8.08 | 592,000 | | 2015-16 | 10.0 | 4.3 | 8.58 | 638,239 | | 2016-17 | 10.5 | 4.5 | 9.08 | 766,246 | | 2017-18 | 11.0 | 4.8 | 9.58 | 914,306 | 10. In such a scenario of a very low GDP growth and high interest rate environment, the ratio of interest payments to GDP could exceed three per cent (Table A7). Debt-to-GDP ratio would increase from 32.9 per cent in 2014-15 to 33.7 per cent in 2017-18 reflecting higher order of borrowing vis-à-vis GDP growth. Interest payments/GDP ratio would increase from 2.7 per cent in 2014-15 to 3.1 per cent in 2017-18. However, sustainability indicators remain comfortable in such an adverse scenario. | Table A7: Sustainability Indicators (Scenario II) | | Year | Debt / GDP (%) | ATM (years) | Interest / GDP (%) | | 2013-14 | 32.7 | 14.2 | 2.6 | | 2014-15 | 32.9 | 14.9 | 2.7 | | 2015-16 | 33.1 | 15.7 | 2.8 | | 2016-17 | 33.2 | 16.2 | 3.0 | | 2017-18 | 33.7 | 16.4 | 3.1 | 11. Sustainability of India’s public debt has also been ascertained by the IMF and other empirical studies. According to IMF’s Article IV Consultation Staff Report (March 2015), India’s public debt remains sustainable given manageable interest rate costs and expected recovery in the economy’s growth rate. While India faces relatively low risks to debt sustainability under the baseline, but it could be vulnerable to slower real GDP growth and a contingent liability shock emanating from future bank capital injections and liabilities of the electricity distribution companies. Moreover, the captive domestic investor base is likely to mitigate the impact of any real interest rate shocks. A recent study by Kaur and Mukherjee (2012)9 found that debt position in India is sustainable in the long-run while examining data for the period 1980-81 to 2012-13. Appendix Table I: Issuance scope across the maturity buckets
(As on December 7, 2015) | | (Rs. crore) | | Maturity Bucket | Residual Maturity | Outstanding G-Sec. | | G-Sec. | Special | Total | | 1 | 2 | 3 | 4 | 5 | | 2016-17 | 1 | 2,23,330 | 0 | 2,23,330 | | 2017-18 | 2 | 2,56,774 | 0 | 2,56,774 | | 2018-19 | 3 | 2,43,478 | 0 | 2,43,478 | | 2019-20 | 4 | 2,50,000 | 0 | 2,50,000 | | 2020-21 | 5 | 2,48,000 | 4,100 | 2,52,100 | | 2021-22 | 6 | 2,83,846 | 17,400 | 3,01,246 | | 2022-23 | 7 | 3,10,465 | 23,168 | 3,33,633 | | 2023-24 | 8 | 2,36,500 | 45,026 | 2,81,526 | | 2024-25 | 9 | 2,15,000 | 62,446 | 2,77,446 | | 2025-26 | 10 | 1,85,688 | 40,464 | 2,26,152 | | 2026-27 | 11 | 2,84,878 | 6,200 | 2,91,078 | | 2027-28 | 12 | 1,77,680 | 0 | 1,77,680 | | 2028-29 | 13 | 1,16,000 | 0 | 1,16,000 | | 2029-30 | 14 | 83,000 | 0 | 83,000 | | 2030-31 | 15 | 1,51,885 | 0 | 1,51,885 | | 2031-32 | 16 | 90,687 | 0 | 90,687 | | 2032-33 | 17 | 1,79,957 | 0 | 1,79,957 | | 2033-34 | 18 | 78,000 | 0 | 78,000 | | 2034-35 | 19 | 72,350 | 0 | 72,350 | | 2035-36 | 20 | 52,000 | 0 | 52,000 | | 2036-37 | 21 | 86,000 | 0 | 86,000 | | 2037-38 | 22 | 0 | 0 | 0 | | 2038-39 | 23 | 13,000 | 0 | 13,000 | | 2039-40 | 24 | 0 | 0 | 0 | | 2040-41 | 25 | 90,000 | 0 | 90,000 | | 2041-42 | 26 | 90,000 | 0 | 90,000 | | 2042-43 | 27 | 90,000 | 0 | 90,000 | | 2043-44 | 28 | 79,472 | 0 | 79,472 | | 2044-45 | 29 | 71,000 | 0 | 71,000 | | 2045-46 | 30 | 39,000 | 0 | 39,000 | | 2055-56 | 40 | 3,000 | 0 | 3,000 | | Total | | 43,00,987 | 1,98,804 | 44,99,791 |
|