Financial market stress in China and monetary policy dilemmas in advanced economies, amidst a fragile global recovery, have led to increased uncertainty in the global economy. While the centrality of the US dollar seems to be getting more entrenched in global financial market activity, the weakness in emerging market currencies is hurting global trade and growth as also corporate performance. Keeping in view the structural shifts in financial markets in the recent years, there is a need to balance the demand for financial market innovations apparently for enhancing market liquidity with their implications for market disruptions and hence financial stability. On the domestic front, amidst slowing global growth and trade, output growth recovery is expected to be gradual with growth in private final consumption expenditure being still held back by weaknesses in the rural economy and fresh investment being affected by low capacity utilisation. In the corporate sector, the level of profitability, leverage and debt servicing capacity continue to cause concern with their attendant adverse impacts on the industrial sector, notwithstanding some improvement observed in corporate performance during the first half of the current financial year. Global backdrop 1.1 Developments in China, dilemmas faced by the US Federal Reserve (Fed) with regard to a shift in its monetary policy stance and sluggish global trade growth have been major concerns that policy makers around the world have been grappling with since the publication of the previous Financial Stability Report (FSR) by the Reserve Bank in June 2015. Further, the European Central Bank (ECB)’s promise to further its quantitative easing (QE) programme1 and similar action expected from Bank of Japan (BoJ), given the euro bloc’s fragile recovery and faltering Abenomics, could trigger unintended currency wars despite an understanding evolved at the G-20. However, in its recent policy review, ECB extended its QE programme to March 2017 without expanding the same and reduced interest rates on the deposit facility to another historic low. The BoJ, in the meanwhile, didn’t immediately go ahead with further QE amidst tight labour market. While the first Fed rate hike since 2006, eventually effected on 16th December 2015, did not appear to have caused any major immediate impact on financial markets, its effects will need to be seen in the light of the developments on the real economy front as also the response of the markets, going ahead, especially to the emerging divergence in policy stance in major advanced economies. In any case, the emerging dynamics in global markets do call for a discerning look at the distinction between “risk” and “uncertainty” (Box 1.1). 1.2 In the meanwhile, despite the fact that developments in China on the renminbi front have been quite influential in market gyrations around the world, the centrality of the US monetary policy stance and the US dollar seems to be getting more entrenched in global financial market activity (Charts 1.1 and 1.2). The inclusion of renminbi in the Special Drawing Rights (SDR) basket, could prompt some reserve allocations, going forward. 1.3 The signal in October 2015 of an imminent rate hike from the Fed came at a time when the increasing divergence between what policy makers were thinking and what the markets were expecting had been adding to potential instability in financial markets. For the markets in particular, the easy monetary policies across the world, along with increasing market liquidity have also increased potential liquidity risks along the impending tightening cycle and the purveyors of financial stability across the world cannot afford to be agnostic about this. On the other hand, such indications will also help when the ‘secular stagnation’ hypothesis is getting entrenched in the market psyche which may accentuate potential asset price bubbles, especially given the enhanced positive correlations amongst asset classes2 which are likely to magnify contagion, if the vulnerabilities play out. For the Fed raising interest rates when the US inflation is way below the 2 per cent target, would also have meant reducing inflationary expectations. ‘Forward guidance’ which in fact is meant for moderating uncertainty in the markets is going to be a challenging task for central banks around the world. The Bank for International Settlements (BIS) feels that monetary policy should be targeted not at equilibrium in the real economy, but at equilibrium in the financial sector3, an acknowledgement of the emerging dynamics between the real and the financial sectors. Box 1.1: In search of some old wisdom When current wisdom does not offer solutions to extant problems, old wisdom can sometimes be helpful. For instance, the global financial crisis compelled us to take a look at the Minsky’s financial instability hypothesis which posited the debt accumulation by non-government sector as the key to economic crisis. As part of his work, Minsky identified three types of borrowers - the “hedge borrowers” (those who could meet their debt obligations – both principal and interest through current cash flows from investments), “speculative borrowers” (those who could service their debts, that is – pay only the interest but had to roll over the principal periodically through cash flows from current investments) and “Ponzi borrowers”(whose current cash flows were insufficient to meet debt obligations but borrowed on the faith that an appreciation in the asset values could take care of such obligations). The dominance of the Ponzi borrowers can cause disruptions in the financial system when asset prices stop rising. Coming to the post-crisis scenario, with ultra-easy monetary policies and massive asset purchases by central banks in developed nations, while the global financial system seems to be stabilised, the sluggish growth and low inflation have been worrying. Can old wisdom offer an answer to this? Lawrence Summers’ revival of Alvin Hansen’s ‘secular stagnation’ hypothesis tried to explain the situation through the argument that with the zero lower bound on nominal interest rates and excess savings it may be difficult to bring the economy back to full employment for many years. Bernanke countered this argument by considering an international dimension stating that secular stagnation in any one open economy is unlikely to last. On the other hand, Rogoff’s “debt supercycle” view argues that growth trends might prove higher once deleveraging and borrowing headwinds subside. In other words, unlike secular stagnation, the debt super cycle is not forever. Drawing a parallel between the Swiss National Bank’s decision earlier this year when it took the markets by surprise by dropping the currency peg and now the recent turn of events in China, especially the decision to shut the markets, the focus of policy makers in emerging economies probably needs to turn to another old wisdom: Frank Knight’s distinction between risk and uncertainty – in the sense that risk can be priced and hedged while uncertainty cannot be. In ‘Risk, Uncertainty and Profit’, Knight distinguishes among three different types of probabilities viz., ‘a priori probability’ (odds of rolling any number on a die), “statistical probability” (which is dependent on empirical evaluation) and “estimates” (where the data that exist do not lend themselves to statistical analysis). References: Minsky, H (1992), ‘The Financial Instability Hypothesis’, Working Paper No 74, Levy Economics Institute of Bard College, May. Hansen, Alvin (1939), ‘Economic Progress and Declining Population Growth’, The American Economic Review, Vol. 29, No. 1, pp. 1-15, March. Summers, Lawrence (2014), ‘U.S. Economic Prospects: Secular Stagnation, Hysteresis, and the Zero Lower Bound’, Business Economics, Vol 49, No 2, National Association for Business Economics, April. Bernanke, Ben (2015), “Why are interest rates so low, part 2: Secular Stagnation”, Ben Bernanke’s Blog, Brookings, March 31 (available at: http://www.brookings.edu/blogs/ben-bernanke/posts/2015/03/31-why-interest-rates-lowsecular-stagnation). Rogoff, Kenneth (2015), “Debt supercycle, not secular stagnation”, CEPR’s Policy Portal, April 22 (available at: http://www.voxeu.org/article/debt-supercycle-notsecular-stagnation). 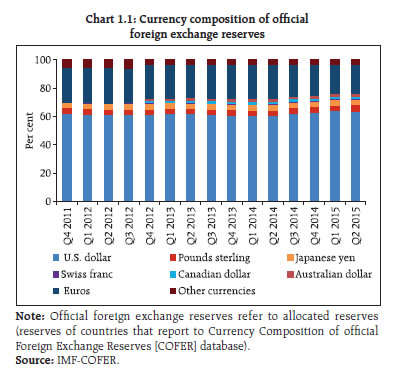
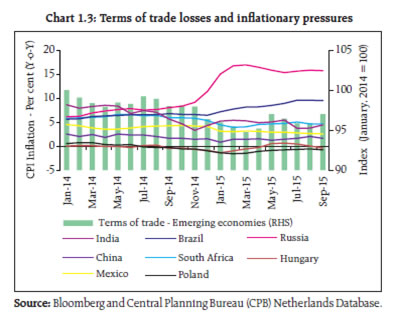
Sluggish global trade 1.4 The sluggish trend in global trade could also be due to structural changes in global supply chains even as the focus is shifting to on-shoring. Some research indicates that weakness in emerging market currencies, whether as a result of currency wars or not, is hurting global trade by reducing imports without any commensurate benefits to their exports. Instead, broadly, the currency devaluations have led to terms of trade losses for emerging economies4 (Chart 1.3) and to inflationary pressures in some countries. 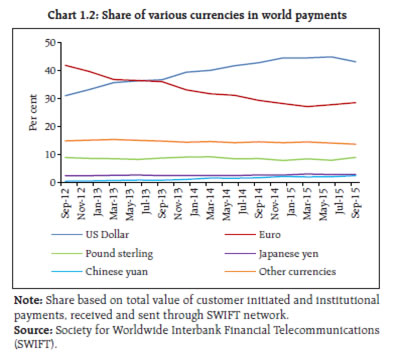
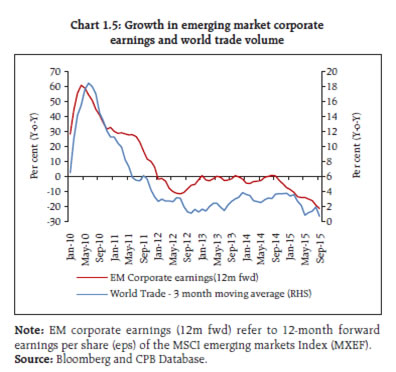
Weakening growth in emerging market and developing economies (EMDEs) 1.5 At the moment, it seems more likely that current estimates of global growth rates will be brought down further, even as the EMDE-AE growth differential is at its lowest point since the global financial crisis (Chart 1.4). Moreover, given the correlation between growth in world trade and corporate earnings, the sluggish trade growth is likely to have an impact on corporate earnings in EMDEs (Chart 1.5). Continuance of benign outlook for oil prices 1.6 The end of the commodity super cycle may be shifting spending power to economies with higher marginal propensity to consume. In the meanwhile, the US shale industry has been experiencing financial strain. Consequently, American firms are now allowed to swap some oil with Mexico which will impact the gap between the price of domestically produced oil as against global market price. The Iran nuclear deal is likely to add more embargoed oil to the glut. However, this benign outlook for oil carries the risk of complacency for countries that import significant portions of crude oil as misaligned fiscal priorities and rising oil intensity of aggregate demand in these countries may lead to twin deficits, which they are historically prone to. Structural changes in financial markets have increased uncertainty 1.7 Uncertainty emerges from the fact that financial markets have changed structurally over the last few years. While that need not be a concern in general, regulators will continue to face challenges in balancing demands for financial market innovations that are pushed through in the name of ‘enhancing market liquidity’ and the impact of such innovations on financial stability through market disruptions. Recent episodes of flash crashes in markets are an indication of how technology and automated computer programmes or high frequency trading5, have changed the functioning of markets and have created inequality with the retail investors increasingly marginalised in modern markets. According to a joint report6 by leading US regulators that went into the last October’s flash crash in US treasuries, ‘the change from a dealer-dominated market to one by electronic trading platforms might entail severe bouts of volatility that coincide with significant strain in liquidity’. Meanwhile the US financial regulator, the Commodity Futures Trading Commission (CFTC), has indicated that it will address risks of high speed trading probably through order limits and “kill switches”7. 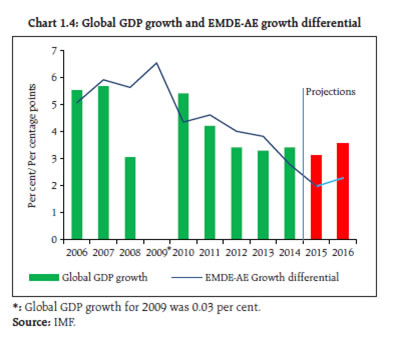
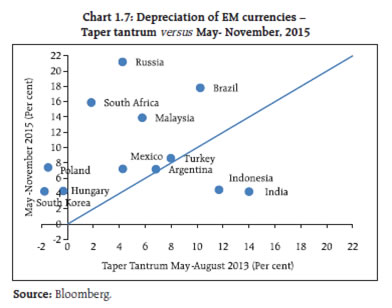
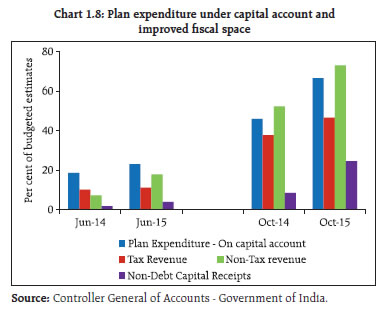
Domestic macro-economic challenges Improved fundamentals amidst challenges 1.8 Despite improved macro-economic fundamentals (Chart 1.6) and resilience compared to its peers (Chart 1.7) - given the challenges for the rupee to maintain external competitiveness on the one hand and manage inflationary pressures and requisite capital flows on the other - sluggishness in domestic demand and private investment call for higher public investment at a time when government is committed to fiscal consolidation. While capital expenditure is getting more traction along with higher collections of tax and non-tax revenues as well as non-debt capital receipts during the current financial year (so far) compared to last year (Chart 1.8), fiscal manoeuvering faces limitations given the increasing demands on revenue expenditure and inability to meet public sector divestment targets. Carrying out important economic reforms in tune with market expectations will be highly beneficial to the ecnomy amidst global uncertainties. Implementation of Goods and Services Tax (GST) is an immediate necessity so as to enable India to move towards its potential growth rate. The global headwinds and the attendant risks will continue to pose concerns for India thereby, requiring initiation of suitable measures to control the country specific idiosyncratic risks, keeping in view the volatile financial markets and delicate market sentiments. 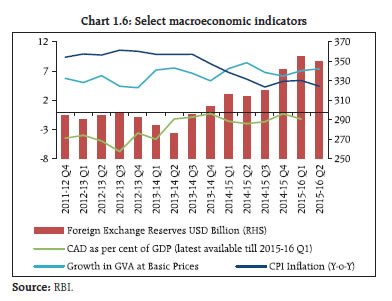
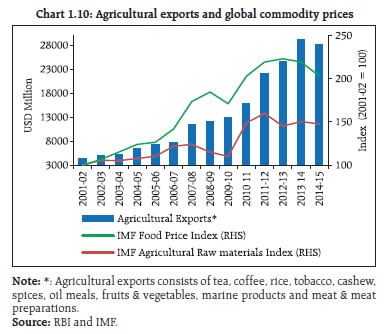
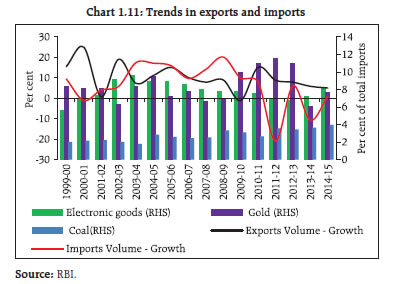
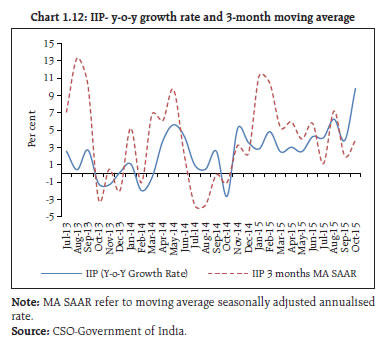
1.9 Output growth is hampered primarily by sluggish growth in private final consumption expenditure8 (PFCE) (Chart 1.9) which is held back, among other factors, by weaknesses in agricultural GVA growth even as the decline in commodity prices is taking its toll on agricultural exports (Chart 1.10). 1.10 Also, the weakness in external demand has adversely affected exports even though the current account deficit (CAD) as a percentage of GDP has remained at comfortable level. Falling exports, however, could be a concern amidst global developments such as the Trans Pacific Partnership9, as also the depreciation of renminbi. Specifically, growth in export volumes has remained weak in recent years and it turned negative in recent months even though a free trade agreement10 has been in operation with the ASEAN countries, since 2010, indicating the role of currency competitiveness among Asian EMDEs (Chart 1.11). On the imports front, significant benefits have accrued on account of fall in international crude prices and reduction in gold imports, though the steady rise in imports of electronic items11 presents a case for boosting the domestic electronics industry. 1.11 On account of weakness in domestic and external demand, manufacturing growth as indicated by the index of industrial production (IIP) growth has been tepid even though the recent high growth of 9.8 per cent (y-o-y) in October 2015 (five year high), partly influenced by base effects, indicates signs of revival (Chart 1.12), Similarly, capacity utilisation in the Indian manufacturing sector has largely been on a declining trend since 2011-12. 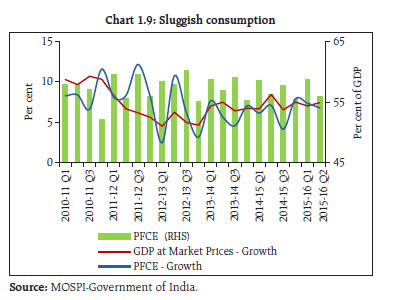
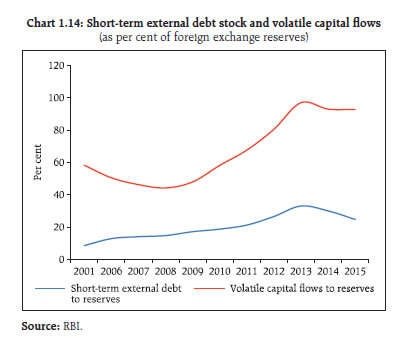
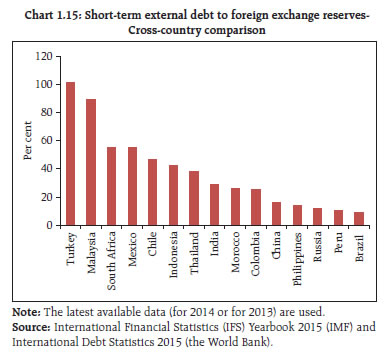
1.12 Amidst sluggish domestic and external demand, excess capacity by itself (in certain industries) is not necessarily an indication of weakness in demand. A case in point is the Indian electricity sector where it was the inability of Discoms12 to pay for the power produced that left a paradoxical situation of excess capacity impacting the financials of power producers and their financiers. The recent debt restructuring package for the discoms -Ujwal Discom Assurance Yojana (UDAY)-, will essentially be shifting the stress from financial institutions to the state governments, though the initiative would instil financial discipline at the sub-sovereign level, especially in ensuring recovery of user charges. Current and capital account balance 1.13 Buoyant remittances (private transfers) have supplemented the lower crude oil prices in reducing the current account deficit and lower but still significant capital flows have resulted in a sizeable capital account surplus (Chart 1.13). While the ratio of short-term external debt and volatile capital flows (together) to forex reserves has been moderating (Chart 1.14), India occupies a median position in terms of certain other external vulnerability measures (Charts 1.15 and 1.16). However, attracting the desired quantum and types of capital flows for financing the current account deficit will require continuous thrust on structural reforms, an unambiguous policy stance, especially in tax matters, and an improvement in ease of doing business. 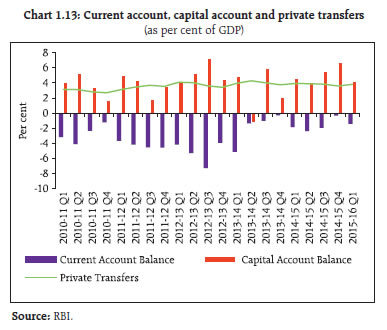
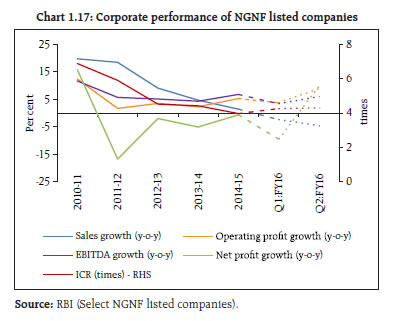
Corporate sector Current trends 1.14 An analysis of the performance of the corporate sector using select non-government nonfinancial (NGNF)13 listed companies for the period 2010-11 to 2015-16 (Chart 1.17) indicates that after deterioration in the first quarter of 2015-16, critical performance parameters such as operating profit, EBITDA14, net profit and interest coverage ratio (ICR)15 showed improvement in the second quarter. 1.15 The profitability of NGNF listed companies16 which had declined in the second half of 2014-15 marginally picked-up in the first half of 2015-16, while the solvency ratio17 displayed significant improvement. The debt servicing capacity, measured by ICR, also improved in the first half of 2015-16. The corporate leverage, measured by debt to equity ratio (DER)18 remained around the same level during the period September 2014 to September 2015 (Table 1.1). 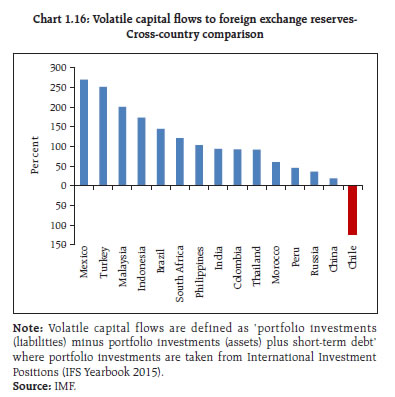
Corporate leverage Trend 1.16 The proportion of companies in the sample, either with negative net worth or DER >=2 (termed as ‘leveraged’ companies) increased over last three half years from 18.4 per cent in September 2014 to 19.4 per cent in September 2015, whereas their share in the total debt of all companies in the sample marginally declined to 30.5 per cent in September 2015 from 33.8 per cent in March 2015 (Table 1.2). 1.17 Similarly, the proportion of companies among the leveraged companies with DER>=3 (termed as ‘highly leveraged’ companies) increased from 13.6 per cent in September 2014 to 15.3 per cent in September 2015, while the share of debt of these companies in the total debt increased from 22.9 to 24.9 per cent (Table 1.2). Debt servicing capacity 1.18 An analysis of the current trends in debt servicing capacity and leverage of weak companies was undertaken using a select sample19 of NGNF listed companies. For this analysis, the ‘weak’ companies were defined as those having ICR <1. Companies with DER >= 2 were classified as ‘leveraged’20. The ‘leveraged weak’ companies are those with DER >= 2 or negative net worth among the weak companies. 1.19 The analysis shows that 15.8 per cent of companies were weak in the select sample in September 2015. The DER of these weak companies decline marginally from 1.8 in second half of 2014-15 to 1.7 in the first half of 2015-16. The share of debt21 of these weak companies constituted 27.3 per cent of total debt. The leveraged weak companies were 2.4 per cent in the sample and accounted for 11.8 per cent of the share of total debt. The number of companies and share in total debt for both weak as well as leveraged weak companies increased in 2014-15, but declined marginally in the first half of 2015-16 (Chart 1.18). | Table 1.1: Select financial ratios of performance of NGNF listed companies (2014-15 and 2015-16) | | | Half-year ended Sep-2014 | Half-year ended Mar-2015 | Half-year ended Sep-2015 | | Net profit to average* total asset (per cent) | 2.6 | 1.9 | 2.6 | | Solvency ratio (per cent) | 13.8 | 12.1 | 14.5 | | Debt to equity ratio | 0.38 | 0.39 | 0.38 | | Interest coverage ratio (number of times) | 5.8 | 4.9 | 5.4 | | Interest payment** to average* borrowings (per cent) | 10.1 | 10.1 | 10.3 | Note: * Average is based on outstanding opening and closing positions for the half year.
** Annualised interest payment is used.
Source: RBI (Half-yearly statements of select NGNF listed companies). |
| Table 1.2: NGNF listed companies: Tail risk in corporate leverage | | (per cent) | | Leverage | Number of companies
(as percentage of total companies) | Share of debt to total debt | | Sep'14 | Mar'15 | Sep'15 | Sep'14 | Mar'15 | Sep'15 | | Negative Net worth or DER >= 2 | 18.4 | 19.0 | 19.4 | 31.8 | 33.8 | 30.5 | | Negative Net worth or DER >= 3 | 13.6 | 14.2 | 15.3 | 22.9 | 23.0 | 24.9 | | Source: RBI (Half-yearly statements of select NGNF listed companies). | 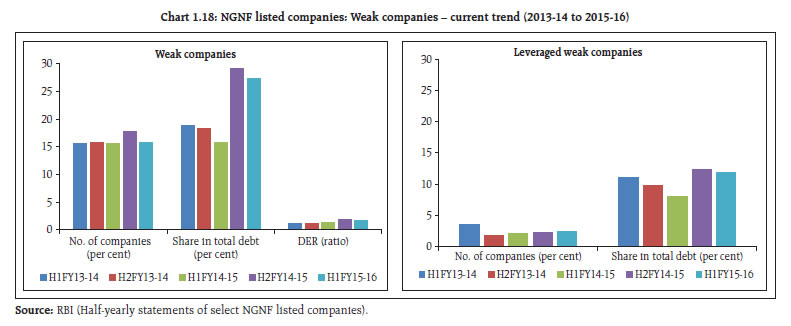
1.20 A risk profile of select industries as at end September 2015 showed that iron and steel, construction and power industries had relatively high leverage as well as interest burden22 (Chart 1.19). 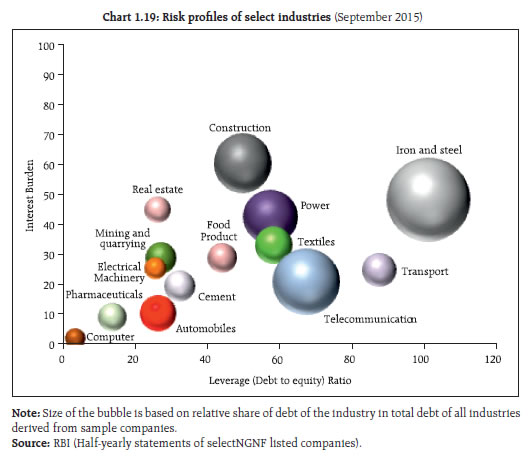
Financial health: Based on large database 1.21 A more detailed analysis of the corporate sector’s performance using a large sample23 during the period from 2011-12 to 2013-14 (latest available) indicated that the strain observed in the beginning of the period continued to cause concern.24 Profitability of public limited companies exhibited a declining trend whereas it improved marginally in the case of private limited companies though profitability of large25 private limited companies declined. In general, leverage ratios indicated increasing trends, especially among small companies, while the same declined in the case of medium and large private limited companies (Chart 1.20). 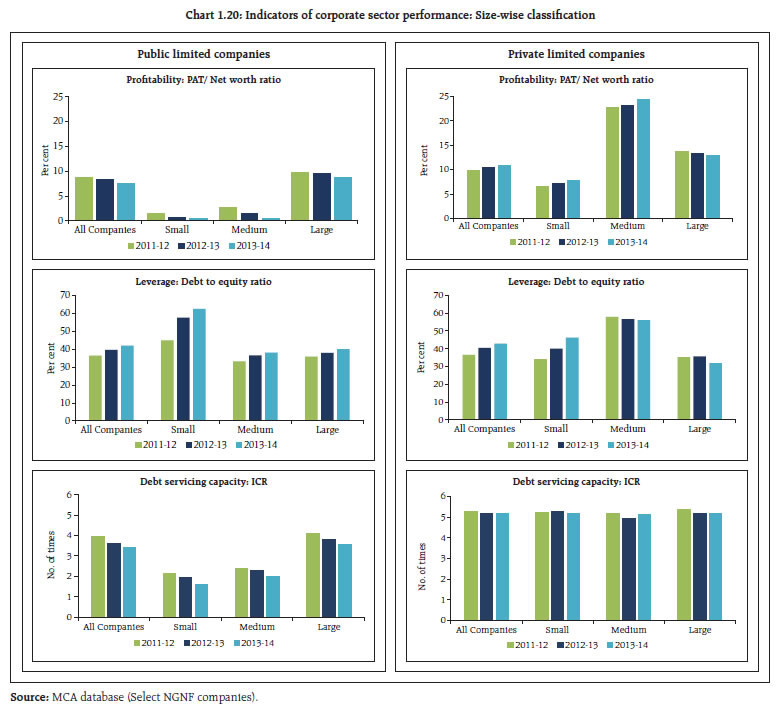
1.22 Debt servicing capacity measured in terms of the ICR declined in the case of public limited companies. Among the private limited companies, ICR of medium sized companies increased, though the same declined marginally in the case of small companies. ICR remained unchanged in the case of large private limited companies (Chart 1.20). Debt servicing capacity and leverage 1.23 An analysis was undertaken using MCA data to identify the weak and levereged weak companies and their share in total debt and bank borrowings (Chart 1.21). 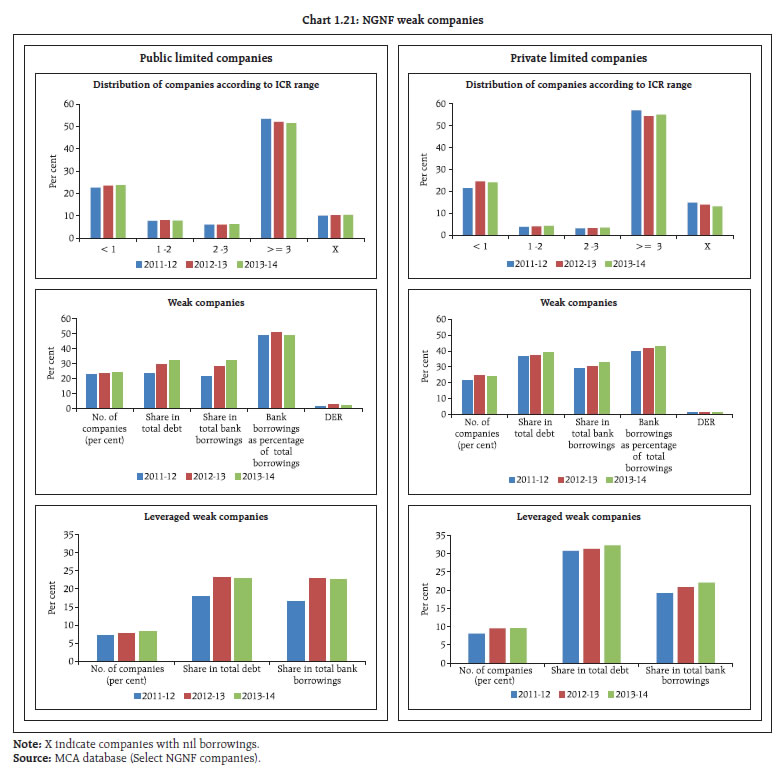
1.24 The analysis shows that 4,635 (23.8 per cent) public limited companies and 61,557 (24.1 per cent) private limited companies were weak in the respective select sample in 2013-14. The DER declined from 3.0 in 2012-13 to 2.2 in 2013-14 in the case of public limited companies, while the same declined from 1.5 to 1.4 in the case of private limited companies. The proportion of bank borrowings in total borrowings was about 49 per cent for public limited companies and 43 per cent for private limited companies. The share of bank borrowings of the weak public limited companies constituted 32.1 per cent of total bank borrowings of the group. Similarly, the share of bank borrowings of weak private limited companies out of total bank borrowings of all private limited companies stood at 32.5 per cent in 2013-14. In the case of public limited companies, the share of bank borrowings of leveraged weak companies in total bank borrowings was 22.6 per cent. For private limited companies, the share of bank borrowings in the case of leveraged weak companies was 22.8 per cent. Impact on bank credit 1.25 The leveraged weak companies with lower debt servicing capacity and high leverage may put pressure on the already deteriorated asset quality of bank loans in adverse situations. The credit extended by scheduled commercial banks (SCBs) to all NGNF companies was about 32.4 per cent of total bank credit as at end March 2014. Therefore, the overall impact26 on account of assumed default by weak NGNF companies could be about 10.4 per cent of total bank credit of SCBs. The impact could be about 7.3 per cent in case of assumed default by leveraged weak NGNF companies (Table 1.3). However, a portion of bank credit to these companies could already be a part of the existing stressed advances (non-performing advances or restructured standard advances) of banks. 1.26 In this context it is pertinent to note that this position is based on MCA data of 2013-14 and the analysis of latest available data for a smaller sample (select NGNF listed companies) for 2014-15 and the first and second quarters of 2015-16 indicate that profitability measured in terms of ‘operating profit’, ‘EBITDA’ as well as ‘net profit’ showed marginal improvement as discussed earlier in the chapter (para 1.14). Table 1.3: Impact of weakness in debt servicing capacity of NGNF companies on bank credit
(Share of bank credit in total bank credit of scheduled commercial banks) | | (per cent) | | | Mar-12 | Mar-13 | Mar-14 | | All NGNF companies | 31.9 | 31.5 | 32.4 | | Weak companies | 7.4 | 9.0 | 10.4 | | Leveraged weak companies | 5.5 | 7.1 | 7.3 | | Source: Basic statistical returns of scheduled commercial banks in India (BSR) and MCA database (Select NGNF companies), |
|