The global economic outlook is clouded by the ongoing war in Europe and the pace of monetary policy tightening by central banks in response to mounting inflationary pressures. The Indian economy is facing spillovers from global conditions but remains on the path of recovery. The financial system remains resilient and supportive of economic revival. Banks as well as non-banking institutions have sufficient capital buffers to withstand sudden shocks. High inflationary pressures, external spillovers and geopolitical risks warrant careful handling and close monitoring. Introduction 1.1 Shock waves from the war in Ukraine and retaliatory economic and financial sanctions have jolted the global economy, already beleaguered by successive waves of the COVID-19 pandemic, the quickening pace of monetary policy normalisation and the associated surges of volatility in global financial markets. Global growth is slowing, and downside risks weigh on the outlook. As the fallout of the war reverberates through commodity markets, price pressures have soared from elevated levels and broadened, threatening to unhinge inflation expectations and trigger second order effects, disrupt international trades and dent consumer and business confidence. Meanwhile, the resurgence of COVID-19 infections in several parts of the world is likely to prolong supply chain bottlenecks, exacerbating the strains that have been persisting over the past two years. Overall, for the global economy, stagflation concerns seem to be transitioning from a risk scenario to a baseline scenario. 1.2 Adverse macrofinancial loops are surfacing with the tightening of financial conditions and spikes in volatility. Across emerging and developing economies, debt distress is rising as external funding conditions turn austere, compounded by currency depreciation and drainage of reserves as investors shun them as an asset class and fly to the safe haven of the relentlessly strengthening US dollar (USD). In financial markets, volatility has risen in bond markets and patches of illiquidity are evident amidst hardening of yields and instances of inversion of yield curves. Corporate bond spreads are also rising, approaching median levels seen during the global financial crisis. In commodity markets too, dollar funding shortages and liquidity mismatches rose in response to margin requirements by central counterparties (CCPs) as commodity prices head north. 1.3 The Indian economy appears to have weathered the third wave of the pandemic associated with the Omicron variant, although the war in Ukraine is now casting a long shadow on the outlook. While the end-May 2022 data release of the National Statistical Office (NSO) points to real GDP and major supply side categories in 2021-22 exceeding their pre-pandemic 2019-20 levels, high-frequency indicators present a mix picture. Urban demand appears to be on a firmer footing than rural demand, although the outlook for the latter is brightening with the prospects of a normal south-west monsoon predicted by Indian Meteorological Department (IMD) and Skymet. Consumption demand is gradually recovering, with some evidence of the demand for contact intensive services regaining traction, especially transportation and hospitality. Investment activity is also picking up but remains incipient at this stage. Exports of merchandise and services are robust and the sustained increase in non-oil, non-gold imports attest to the strength of underlying demand. 1.4 Turning to domestic financial developments, equity markets have seen some recent corrections, although valuations remain stretched. The amount of foreign portfolio outflows has been offset by investments from domestic institutional investors. Domestic bond markets are experiencing global spillovers from hardening bond yields abroad and volatile international crude prices, besides rise in policy rates and bearish sentiment driven by a large government borrowing programme. While the Indian rupee (INR) has been subjected to bouts of downward pressure, it has emerged among the better performing currencies relative to peers. Among financial institutions, banks have reduced gross non-performing asset (GNPA) ratio through recoveries, write-offs and reduction in slippages. Capital and liquidity buffers have been built up well above regulatory requirements, including by accessing markets, and SCBs taken together are seeing a modest return to profitability. These developments have catalysed the growth of bank credit to double digits, tracking nominal GDP growth. Non-banking financial companies (NBFCs) have also benefited from regulatory dispensations, including the congenial financial conditions engendered by the Reserve Bank’s monetary and liquidity operations. 1.5 Overall, global financial stability risks have risen since the publication of the December 2021 Financial Stability Report (FSR), while domestic macroeconomic and financial developments appear to have decoupled and posted a modest improvement. The near-term outlook remains uncertain, overcast with the overwhelming geopolitical conditions and their highly uncertain evolution. Against this backdrop, this chapter analyses macrofinancial risks arising from global developments in Section I.1 and possible spillovers to the domestic economy in Section I.2. The chapter concludes with important findings of the Reserve Bank’s latest Systemic Risk Survey conducted in May 2022. I.1 Global Backdrop I.1.1 Macrofinancial Developments and Outlook 1.6 Global economic prospects have deteriorated markedly since the December 2021 issue of FSR as the economic and financial ramifications of the war and sanctions take their toll. As recently as January 2022, the International Monetary Fund (IMF) had projected global growth at 4.4 per cent in 2022, half a percentage point lower than its October 2021 forecast. In April 2022, it expected the shock of the war to interact with the monetary tightening, financial market volatility, the pandemic, and unequal vaccine access to cause global growth to decline to 3.6 per cent in 2022 from 6.1 per cent in 2021. Both AEs and emerging market and developing economies (EMDEs) are expected to lose pace by 1.9 percentage points and 3.0 percentage points, respectively1. Global trade volume is now expected to slow down from 10.1 per cent in 2021 to 5.0 per cent in 2022, mainly because of moderation in merchandise trade, since services trade is likely to remain subdued. Inflation would be pushed up in the range of 2.6 percentage points for AEs and 2.8 percentage points for EMEs (Charts 1.1 and 1.2). Inflation all around is now expected to stay elevated for longer than earlier anticipated. In most EMDEs, rising food prices and shortages of essential commodities have exposed vulnerable sections of society to food insecurity and erosion of livelihood. 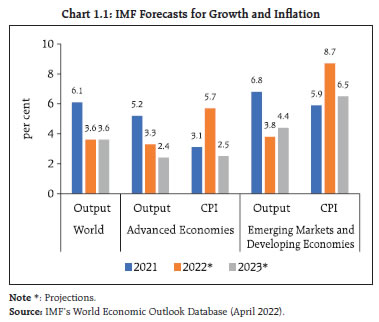 1.7 EMDEs are likely to be at the receiving end of geopolitical spillovers, in spite of being bystanders. Worryingly, rising interest rates will tighten external financing conditions heterogeneously, but all of them remain vulnerable to a generalised flight of capital to safety. Those with large debt overhang will face pressure on budgets and debt servicing. Scarring effects are large for EMDEs due to human capital and investment losses that will keep output below the pre-pandemic trend till 2026 (Chart 1.3). 1.8 Reflecting the uncertainty surrounding the course of the war, persistence of inflation and the future path of the pandemic, global uncertainty has surged (Chart 1.4), which by itself, could reduce global growth by 0.35 percentage points2.
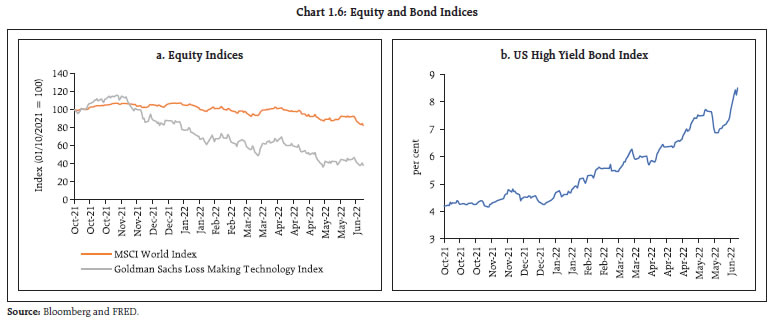
1.9 In addition to the humanitarian crisis, multiple headwinds are impacting the global economy and the international financial system: a terms-of-trade shock that is deleterious for commodity importers; tightening of global financial conditions; repricing of EME assets and consequent flight of capital; and pressures on exchange rates that amplify already persistent inflation. Going forward, the risks are large and to the downside – the possible escalation of war; social unrest due to shortages; resurgence of the pandemic; slowdown in growth in one of the major economies and climate conditions overshooting the Paris Agreement goals. 1.10 As the normalisation of monetary policy, i.e., rate hikes and quantitative tightening (QT) in response to hardening inflationary pressures get synchronised, global financial conditions are likely to tighten significantly, as already being seen in yields across the US and other major AEs. In particular, the US 10-year treasury yield rose by 168 bps (as on June 16, 2022) since end-December 2021 (Chart 1.5). 1.11 The rise in nominal and real yields have resulted in a sell-off in equity markets - technology stocks taking the biggest hit - with concomitant widening of spread on high-yield bonds (Charts 1.6 a and b). 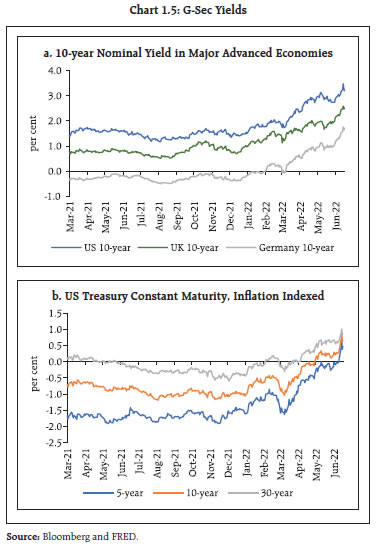
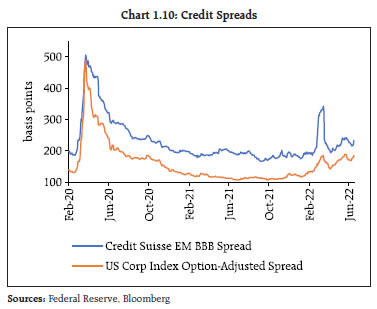
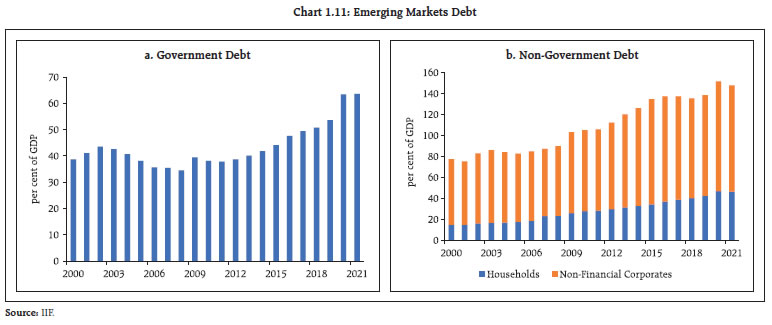
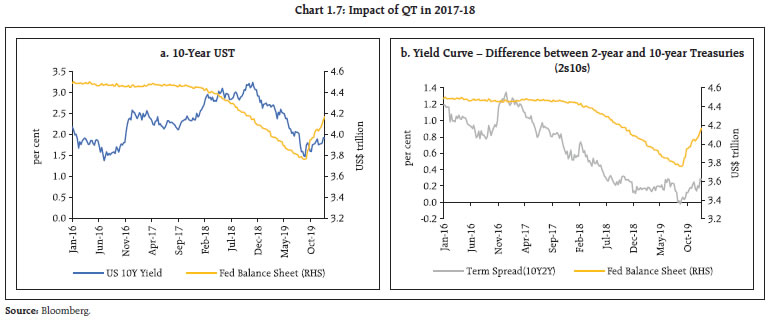 1.12 The impact of QT on financial markets and the economy at large is still unfolding. While policymakers have a handle on the implications of interest rate changes, there is less precision on the effects of increase or decrease in asset holdings by central banks, especially when thresholds are less precisely defined. Traditionally, central bank balance sheet policies influence the economy through three channels: signalling, duration risk and portfolio rebalance. The signalling channel influences the future path of interest rates while the duration risk channel influences term premia and the portfolio rebalance channel affects the supply of securities, which, in turn, impact the yields on close substitutes. Just as Quantitative Easing (QE) increases liquidity in the hands of investors and reduces the liquidity premium on the most liquid bonds, QT would decrease reserves and increase demand for safe assets in a period of increased risk aversion, which may partly offset the supply of treasuries, as witnessed in 2018-19 (Chart 1.7). The scale of QT envisaged now has no precedent and its working through the financial system is uncertain, with the possibility that it may induce further volatility in securities markets. 1.13 Signs of stress in short-term dollar funding are also emerging. With the announcement of sanctions, the Forward Rate Agreement – Overnight Indexed Swap (FRA-OIS) spread – a measure of how expensive or cheap it will be for banks to borrow in the interbank market relative to the risk-free rate – has widened, along with spreads on non-financial commercial paper (Chart 1.8). 1.14 Another key barometer of funding strains in markets, viz., cross-currency swaps, has also tightened in the wake of the war (Chart 1.9), although the repeat of the “dash-for-cash” witnessed in March 2020 is not evident so far. 1.15 Reflecting the increase in risk aversion and impact of monetary policy tightening, corporate bond spreads in the US and in EMEs have widened despite some moderation in June 2022, as valuations increasingly reflect a weak economic outlook (Chart 1.10). 1.16 In sum, synchronised monetary tightening amidst heightened geopolitical tensions poses several financial stability risks: sell-offs of financial assets and market dislocations, especially since central banks may be constrained in their use of tools to address market dysfunction; rise in interest rates and increase in debt servicing costs with debt levels at record highs; and, higher borrowing costs for governments, wider deficits and rollover risks. I.1.2 Other Global Macrofinancial Risks 1.17 New stresses have exposed vulnerabilities in hitherto unknown corners of the financial system. Global macrofinancial conditions pose heightened challenges for policy authorities in both AEs and EMEs and threaten to disrupt financial stability. A. Debt Distress in EMEs 1.18 The economic and financial fallout of the pandemic required active and large fiscal support, which pushed up sovereign debt levels of EMEs significantly (Chart 1.11 a and b). While easy financial conditions and the recovery from the pandemic had helped these countries to sustain such high debt levels up to early 2022, the risk of a debt crisis has risen substantially in recent times, driven by the deteriorating external environment for low-income developing economies and economies that have a high share of dollar-denominated debt. The likely erosion of risk appetite and tighter financial conditions could increase debt-servicing costs at a time when their ability to generate foreign exchange to service debt appear to be more constrained. From a financial stability perspective, higher debt levels in the face of macroeconomic shocks can increase the probability of default. Deleveraging could lead to reduction in aggregate demand, amplifying shocks to the financial system into a systemic shock. 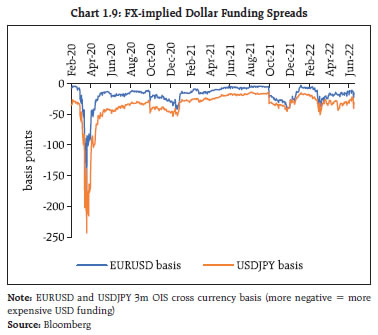
 B. Sovereign Debt Holdings and Bank Balance-sheet Nexus 1.19 As banks’ holdings of sovereign debt increased in EMEs (Chart 1.12), it has deepened the so-called sovereign-bank nexus3 as governments depend on banks for financing of sovereign bonds and banks rely on government securities for investment, for meeting regulatory requirements, and as collateral to obtain funding from central bank and others. 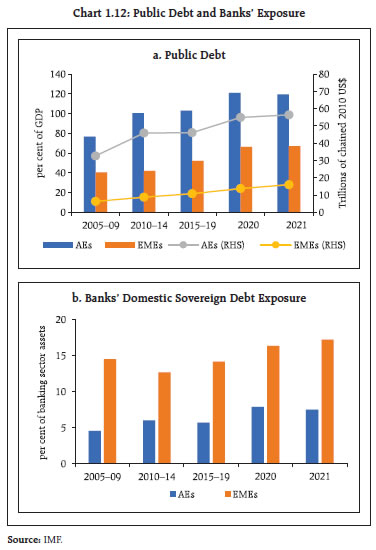 1.20 With the sovereign credit outlook deteriorating in several emerging markets, the nexus between sovereign debt holdings and bank balance sheets poses risks to macro-financial stability. Hardening of government bond yields in the face of additional borrowing could result in mark-to-market losses for banks. This could potentially reduce their lending and adversely affect overall economic activity, especially in countries with high fiscal vulnerability and less capitalised banking systems. If banks’ appetite to hold sovereign debt diminishes in such a scenario, it could trigger negative feedback loops through multiple channels. Other potential channels of risk highlighted by the IMF4 include: (i) reduction in bank soundness and potential for lending to the economy; (ii) diminished ability of governments to support banks in times of stress due to deteriorating government finances; and (iii) headwinds to economic recovery as monetary tightening adversely impacts corporate profitability and increases credit risk for banks. 1.21 The IMF’s recommended policy response to mitigate risks include: (i) fiscal discipline and strengthening of medium-term fiscal frameworks to build resilience; (ii) preserving bank capital resources to absorb losses; (iii) conducting bank stress tests by taking into account the multiple channels of the nexus; (iv) examining options to weaken the nexus once the post-pandemic economic recovery takes hold; and (v) fostering a deep and diversified investor base to strengthen market resilience in countries with underdeveloped local currency bond markets. It also favours a more risk-sensitive regulatory and supervisory treatment with appropriate disclosures on all material sovereign exposures. 1.22 Notwithstanding these multiple challenges, banks exhibit resilience as they entered the pandemic with relatively strong balance sheets, supported by better quality capital and higher liquidity buffers. Losses have been modest and, unlike in the global financial crisis (GFC) when banks deleveraged and cut back on lending, global bank lending remains strong, and the underlying robustness of their solvency and liquidity positions is comforting (Chart 1.13). Market valuations also reflect prices recovering to pre-pandemic levels, even though there has been some moderation in recent period (Chart 1.14).
C. Capital Flows and Exchange Rate Volatility 1.23 The unrelenting ascent of the USD against its AE peers has also contributed to the tightening of financial conditions by triggering a ‘flight-to-home’ bias, especially among passive investors tracking indices (Chart 1.15 a). The USD has now surged to its strongest level in two decades. Even the Japanese Yen (JPY) – usually a safe-haven currency – fell precipitously against the USD as the Bank of Japan reiterated its decision to continue with accommodative monetary policy (Chart 1.15 b). 1.24 Spillovers to EMEs are asymmetric and, in some cases, disruptive, triggering capital outflows (Charts 1.16 a and b). In some EMEs, local currency bond returns turned negative (Chart 1.16 c), equity prices fell (Chart 1.16 d), and CDS spreads widened (Chart 1.16 e), tightening financial conditions (Chart 1.16 f).
1.25 External debt of EMEs witnessed sharp growth in the post-GFC era (Chart 1.17 a). A study of its financing pattern reveals that non-bank financial institutions (NBFIs) are playing an increasing role in their funding (Chart 1.17 b). 1.26 The Financial Stability Board (FSB)5 has examined the prominent role of NBFIs in funding EME external debt. Declines in EME asset prices around the COVID-19 outbreak resulted in sales by foreign investors, large-scale capital outflows and currency depreciation in some jurisdictions. Sizable capital outflows were recorded in circuits which relied more on passive bond funds, while sovereign rating downgrades added to corporate borrowing costs. While EME authorities deployed both standard crisis management tools and new measures, such as large-scale asset purchases, to mitigate pressures in local currency bond markets, these actions did not directly address the underlying vulnerabilities in EMEs. The FSB proposes the following broad policy measures: (i) limit the build-up of non-financial corporate foreign currency mismatches; (ii) further develop foreign currency hedging markets at the domestic and regional levels to manage currency risks; (iii) deepen local currency debt markets and foster a broader domestic investor base; (iv) tackle NBFIs’ vulnerabilities, including those relating to liquidity mismatches in open-ended funds; and (v) facilitate risk monitoring by closing data gaps and enabling timely adoption of policies to mitigate vulnerabilities. D. Risks in NBFIs6 1.27 NBFIs potentially reduce cost of borrowing, diversify investor base and enable risk sharing, but they also pose significant challenges as their financing is generally procyclical, fuelling cross-border spillovers. In recent episodes, the flows through NBFIs unwound rapidly during times of stress, engendering quicker transmission of liquidity shocks across countries. This experience brings to the fore the underlying disquiet in the current phase of tightening of global liquidity conditions (Chart 1.18). Since many of the vulnerabilities in the NBFI sector that emerged during the GFC have also been observed during the pandemic, the increasing role of NBFIs in EME external debt financing requires close monitoring. 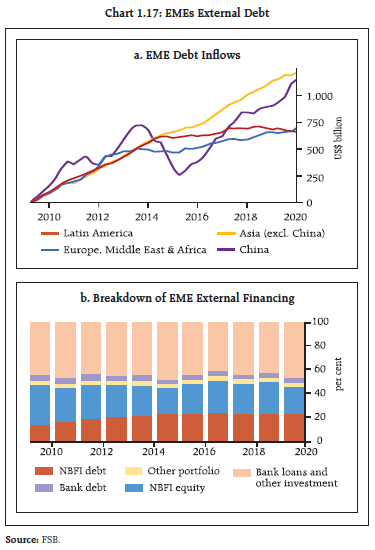 1.28 NBFIs account for nearly half of the total global assets of all financial institutions and their interconnectedness in cross-border business is also rising. The complexity of the network of NBFIs and banks in dollar funding chains with multiple layers of intermediation has the potential to amplify contagion. As NBFIs maintain exposure to debt denominated in both foreign and domestic currencies, they often have unhedged exposure/short-term hedges and significant currency mismatches, unlike banks that refrain from maintaining large open currency positions. NBFI exposures can be upsetting in an event of sharp movements in exchange rates. In addition, unlike banks, they do not have strong regulatory prescriptions for liquidity buffers nor do they have access to central bank liquidity. Any liquidity mismatches, therefore, exposes NBFIs to redemption risks and sudden portfolio reallocations, including reduction in funding from banks. In many cases, NBFIs supersede their own risk assessment with algorithm-driven tracking of indices and credit ratings, which leads to herd behaviour and has the potential to intensify cross-border spillovers. E. Geopolitical Risks 1.29 The war in Ukraine and ensuing sanctions have raised concerns about exposures of banks and non-banks to geopolitical risks. Banks’ direct claims on Russia have been on a decline since 2014 and form only 0.3 per cent of total exposures of European Union banks, which have a dominant share worldwide7. An area of concern is the extent of indirect exposures resulting from derivative transactions and other off-balance sheet exposures, which are difficult to quantify but could be sizeable. Foreign NBFIs had substantial investment in the Russian sovereign and corporate debts and equities in Q4:20218, where high redemption frequency open-ended funds (OEFs) had sizable investments in equities and fixed-income assets, which were predominantly held by US and European funds (Chart 1.19 a and b). Though these exposures have a relatively low share in their total assets, credit and liquidity risks along with difficulty in valuing investments could materialise, depending on the duration of the war. F. Commodity Markets 1.30 The war has exacerbated supply chain disruptions and forced a sharp rise in commodity prices with heightened volatility (Chart 1.20, 1.21 and 1.22). The food price index of the Food and Agricultural Organisation (FAO) reached its peak in March 2022: though it has moderated marginally during April and May 2022, it remained 29.2 per cent higher on an y-o-y basis. Both energy and non-energy prices have surged, and supply is especially affected for essential commodities such as crude oil, natural gas, key metals, edible oils and wheat.
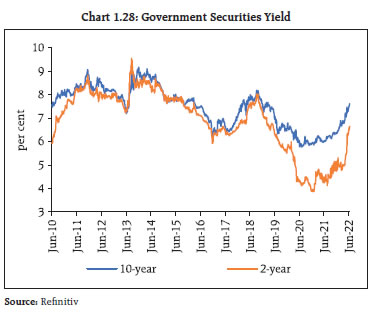
Notwithstanding some recent moderation, prices of many commodities, which reached historical peaks, are expected to remain at elevated levels in the medium term, given the uncertainties around the duration of the war. Second round effects are emanating from rise in prices of substitute commodities, increase in input costs, production shortages and transportation and storage costs as well as the cost of finance. 1.31 Supply issues in the energy sector have become more persistent as investment in the oil sector has moderated in the wake of low prices in past years and the move towards renewable energy. 1.32 As per the World Bank9, energy and non-energy prices are forecast to rise by 50 and 20 per cent in 2022, respectively. Any further outbreak of COVID-19, possibility of moderation in global growth and high uncertainty about future energy demand are considered downside risks for commodity prices. 1.33 Given the high financialisation of commodity markets, investment funds have become core drivers of commodity prices, especially in a period of declining returns on other investments. The assets under such funds have nearly doubled over the last two years to a new high (Chart 1.23). 1.34 In addition to their implications for inflation, high commodity prices pose several risks in terms of the challenges for monetary policy, the health of financial institutions and the integrity and stability of financial markets. Interconnected commodity markets with close linkages between cash and derivatives compel producers, traders and consumers to lock in prices and hedge risks, making the impact of price rises on financial institutions and markets particularly severe. Combined with the broad-based commodity price surge and high shipping costs, some segments of commodity markets are experiencing financing difficulties, with participants exposed to commodity derivative trades facing large margin requirements and liquidity shortages. Since banks provide funding to commodity traders and act as intermediaries in derivative markets, they face higher credit risk as well as increase in hedging costs, which can become a propagation channel for spillovers. While this has prompted market participants in some jurisdictions to seek support from central banks, there is the issue of moral hazard, as provision of central bank liquidity can incentivise commodity traders in taking on excessive risks. Furthermore, the opacity of commodity markets and presence of largely unregulated entities warrant sufficiently higher disclosure standards as threshold for central bank intervention.  1.35 The swiftness of moves to safe assets and surge in initial margin requirements in anticipation of further deterioration in underlying conditions reflects the suddenness and destabilising nature of funding pressures for trading firms. There are also heightened concerns about the impact on financial stability from recent developments in the commodity market. EMEs, in particular, face additional pressures in view of large share of commodities in consumption baskets. G. Cryptoisation and Central Bank Digital Currencies (CBDCs) in EMEs 1.36 Technological advances powered by cryptography and distributed ledger technology (DLT) have led to the rise of new digital assets such as cryptoassets and stablecoins, which generally have no underlying assets and are primarily used for speculative investments. The market value for cryptoassets grew tenfold from early 2020 to late 2021 when it peaked at almost USD 3.0 trillion before recording a sharp decline below US $ 1 trillion in June 2022 (Chart 1.24). 1.37 The risks from cryptoassets to financial stability appear to be currently limited as the overall size is small (0.4 per cent of global financial assets) and their interconnectedness with the traditional financial system is restricted. The associated risks are, however, likely to grow as these assets and the ecosystem supporting their growth are evolving. The risks from stablecoins that claim to maintain a stable value against existing fiat currencies require close monitoring, in particular - they are akin to money market funds and face similar redemption risks and investor runs because they are backed by assets that can lose value or become illiquid in times of market stress. 1.38 Cryptocurrencies, typically created on decentralised systems, are designed to bypass the financial system and all its controls, including Anti-Money Laundering (AML)/Combatting the Financial Terrorism (CFT) and Know Your Customer (KYC) regulations. They are characterised by highly volatile prices. As a sub-class of cryptocurrencies, viz., stablecoins are supposedly less volatile as they are linked to a currency (or similar assets). Currently, the market capitalisation of a total of 19,920 cryptocurrencies trading on 528 exchanges stands at $908.7 billion10, with Bitcoin accounting for 44 per cent of this market capitalisation. The top two cryptocurrencies account for 59 per cent while the top five account for more than three fourths. 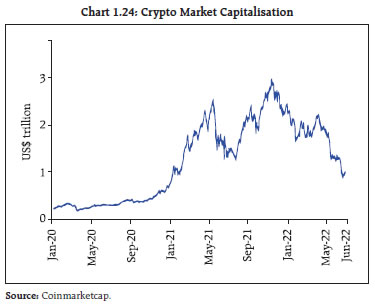 1.39 Cryptocurrencies are not currencies as they do not have an issuer, they are not an instrument of debt or a financial asset and they do not have any intrinsic value. At the same time, cryptocurrencies pose risks. Historically, private currencies have resulted in instability over time and in the current context, result in ‘dollarisation’, as they create parallel currency system(s), which can undermine sovereign control over money supply, interest rates and macroeconomic stability. For developing economies, cryptocurrencies can erode capital account regulation, which can weaken exchange rate management. Furthermore, cryptocurrencies can lead to disintermediation from the formal financial system, impairing financial stability. 1.40 Cryptoassets have gained in popularity in EMEs in recent years, especially in countries with volatile exchange rates. For residents in these countries, cryptoassets pegged to reserve currencies such as USD-linked stablecoins are a convenient tool to avoid capital controls and KYC/AML requirements. While trading of USD-linked stablecoins vis-à-vis some EME currencies has soared since 2020, some EME currencies are also gaining shares in stablecoin trading relative to conventional FX trading. In the extreme case of sharp declines in the purchasing power of local fiat currencies and stringent capital controls, some seek refuge in highly risky cryptoassets such as Bitcoin, which are not pegged to any reserve currency. Although the degree of cryptoisation thus far appears limited, its growth circumvents restrictions on exchange rates and capital controls and limits the effectiveness of domestic monetary policy transmission, posing a threat to monetary sovereignty. Problems with these assets such as price crashes. could spill over to payment systems and adversely affect real economic activity. 1.41 It is in this context that central banks in both AEs and EMEs have become increasingly engaged in projects related to CBDCs – digital money that is denominated in the national unit of account and is a liability of the central bank. In a survey11 conducted by the BIS across EME central banks and published in April 2022, the top motivations for CBDC issuance varied: providing a cash-like digital means of payment in light of reduced cash usage; an increase in private digital payment services; boosting financial inclusion12; strengthening competition among payments service providers (PSPs); increasing efficiency and reducing the costs of financial services13. A majority of central banks considered many of these motivations as jointly important and are developing CBDCs or running concrete experiments. 1.42 Central banks surveyed generally do not foresee offering interest on CBDCs. The view was that a non-interest bearing CBDC is consistent with the objectives of providing a cash-like digital means of payment. At the same time, it can help keep credit disintermediation and the impact on monetary policy in check depending on the design of CBDC. As noted by the US Federal Reserve14, however, CBDC could serve as a close substitute for commercial bank deposits, and potentially disintermediate banks and exacerbate runs on them as holders can convert deposits into CBDCs. Shift away from deposits to CBDCs could potentially decrease credit availability or increase credit costs. A majority of central banks in the BIS survey are uncertain about imposing limits on CBDC transactions or balances to counter disintermediation risk. Therefore, it is imperative for every country to work out their own risk mitigation measures while designing a CBDC. I.2 Domestic Macrofinancial Risks 1.43 Since the release of the December 2021 FSR, the recovery in domestic economic activity, which had lost some momentum with the onset of the Omicron-driven third wave of the pandemic, has been gaining traction in spite of the globally overwhelming geopolitical shock of the war in Ukraine. While there has been a rise in COVID-19 infections in some parts of the country since the second fortnight of April, close to 90 per cent of the adult population is fully vaccinated with total vaccination doses having crossed 196 crore by June 21, 2022. The pace of vaccination of children below 18 years is rising and precautionary doses of COVID-19 vaccines are being made available to all those who are eligible. With mobility rising beyond pre-pandemic levels in terms of people, goods and services, India is learning to cope with COVID-19. Turning to the impact of the war, the immediate consequence has been a surge in domestic inflation with spillovers to financial markets. The Indian economy has, however, remained resilient so far on the strength of its own macro-fundamentals. Although real GDP growth slowed from 5.4 per cent in October-December 2021 to 4.1 per cent in January-March 2022 - taking the annual growth in 2021-22 to 8.7 per cent from 8.9 per cent in the NSO’s second advance estimates - more recent high-frequency indicators of economic activity suggest that momentum has picked up in the first quarter of 2022-23 in a broad-based manner. Barring the uncertainty surrounding the future path of the pandemic and the war, incoming data have brightened the outlook. 1.44 Turning to an assessment of risks from financial developments since the December 2021 FSR, financial markets in India experienced bouts of volatility in 2022, so far. Initially, they were fuelled by global spillovers through the expectations channel about the likely pace and magnitude of monetary policy normalisation by systemically important central banks. As the quarter progressed, they were amplified by country-specific factors such as the third wave of Omicron infections, inflation concerns and elevated crude prices. The strengthening of the USD and net foreign portfolio investment (FPI) outflows were other factors that had large country-specific effects. By the close of February 2022, the war took over, producing sudden and large adjustments in risk assessment across the world, surges of volatility, elevated levels of crude and other commodity prices - which reached levels not seen in 15 years. 1.45 The sharp rise in crude oil prices has adversely impacted domestic inflation and the rise in prices of petroleum products will have second round effects on prices of various goods and services. The Reserve Bank’s estimates show that a 10 per cent rise in crude oil price above USD 100 per barrel could increase domestic inflation by 30 bps and reduce GDP growth by 20 bps respectively15. Since February 2022 policy, the Reserve Bank had revised GDP growth downward by 60 bps and inflation upward by 220 bps primarily because of the rise in Indian basket of crude oil price – as on June 16, 2022, it rose to USD 117.2 per barrel from USD 73.3 per barrel in December 2021. 1.46 Amongst financial intermediaries, the banking sector, buffered by regulatory dispensations provided by the Reserve Bank during the pandemic, built up risk absorbing capacity through capital raising, including, from the market and profit retention. With gross non-performing assets (GNPA) ratios down to their lowest levels in six years and a modest return to profitability, bank credit growth is in double digits after a long hiatus. NBFCs have mobilised to fill the space opened up by risk aversion among banks through the greater part of 2021-22. In the microfinance sector, customer protection and harmonising regulations with other financial intermediaries has assumed priority from a financial stability perspective. Another set of macro financial risks in the financial stability monitor is in the leveraging of technology to facilitate digital penetration and consumer orientation towards a “less cash” society - credit, settlement and cyber risks as well as those associated with innovations. In the payments space, enhancing awareness about digital payments and extending the outreach of payment systems across India and beyond will warrant targeted literacy programmes and intervention strategies. Going forward, the introduction of a CBDC in India in conformity with the stated objectives of monetary policy, financial stability and efficient operations of currency and payment systems will engage attention. 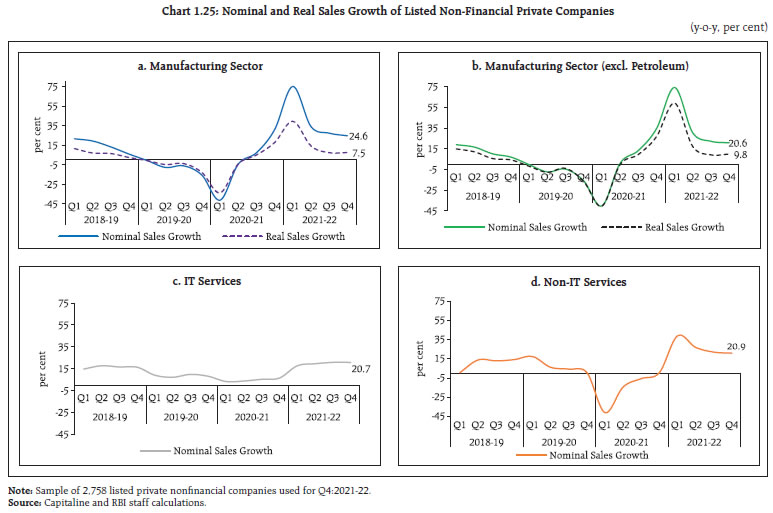 I.2.1 Corporate Sector 1.47 In H2:2021-22, the Indian corporate sector witnessed healthy sales growth reflecting sustained recovery in demand condition of manufacturing sector. The rise in sales of manufacturing companies was partly aided by price increase, but real sales also recorded robust year-on-year and sequential increase. (Chart 1.25 a and b). Information technology (IT) companies exhibited pandemic proofing and maintained strong growth while non-IT services companies are on a recovery (Chart 1.25 c and d). 1.48 Rising input costs fueled a 35 per cent increase in raw material expenses of manufacturing companies. Accordingly, they exercised pricing power and passed these costs through to selling prices, as reflected in healthy operating profit margins. IT and non-IT service sector companies were able to maintain their operating profit margins despite staff costs rising by 23 per cent and 16 per cent, respectively (Chart 1.26). 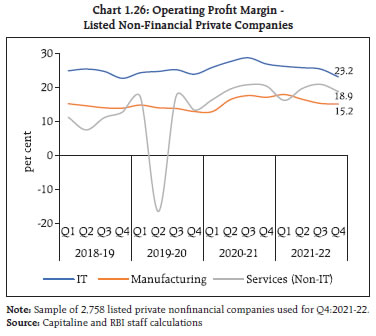 1.49 In H2:2021-22, leverage of listed private manufacturing companies as reflected in debt-to-equity and debt-to-asset ratios eased further from the peak in H2:2019-20 and from the uptick in H1:2021-22 (Chart 1.27 a). The declining share of fixed assets in total assets pointed to the capex cycle remaining subdued. On the other hand, the share of cash holdings (including balances with banks and highly liquid investments) in total assets increased, indicating corporate preference towards cash buffers rather than investing in capacity expansion or new projects (Chart 1.27 b). 1.50 Retained earnings, reduction in fixed assets and trade payables were the major sources of funds, which were deployed for buildup of inventories, trade receivables, financial investments as well as cash holdings. Also, as activities have picked up, corporates are borrowing more long term and their reliance on short term borrowings have come down. I.2.2 Government Securities and Corporate Bond Markets 1.51 Overall, the benchmark 10-year G-sec yield hardened by 116 basis points (bps), between end- December 2021 and June 16, 2022, to 7.62 per cent, mainly reflecting global developments interspersed with domestic factors (Chart 1.28). Concomitant with the rise in yields, the weighted average cost of government borrowing rose by 72 bps to 6.96 per cent during January-May 2022 compared to April-December 2021, while the weighted average maturity declined to 16.31 years from 16.91 years during the same period. 1.52 Global spillovers from elevated crude prices, hawkish signals from systemically important central banks and a rise in US treasury yields has imparted a tightening bias to G-sec yields in India from September 2021. By the end of December 2021, the benchmark 10-year yield had risen almost monotonically through Q3:2021-22 to close at 6.45 per cent, up by 23 bps from end-September 2021 levels. 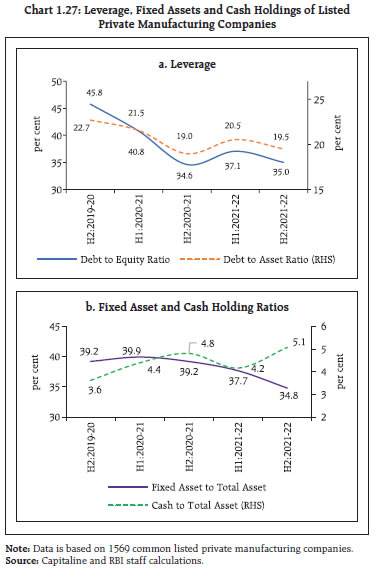
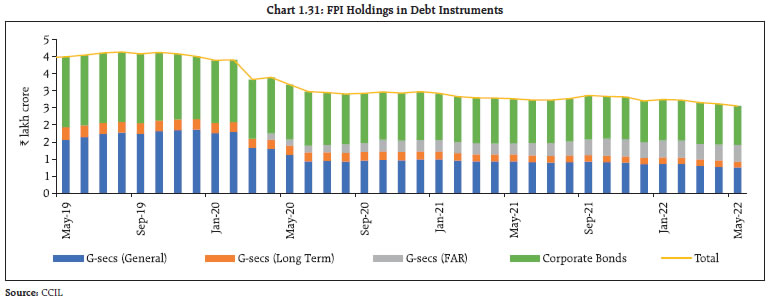
 1.53 Global cues continue to impart bearish sentiments and by mid-January 2022 the benchmark yield was at a two-year high. Domestic developments also provided upside to yield movements. Rising cut-offs and devolvements on primary dealers (PDs) also contributed to a hardening bias in yields. G-sec yields continued to move upwards through February 2022 in spite of the issue of a new 10-year benchmark (6.54 GS 2032). The yield curve steepened in the 8-10 years maturity segment. While switch operations of ₹1.2 lakh crore had provided a temporary respite, the announcement in the Union Budget 2022-23 of a borrowing programme of ₹14.95 lakh crore impacted sentiment and the ensuing sell-off pushed the 10- year benchmark on the Budget day to 6.83 per cent. The status quo monetary policy announcement of February 10 and cancellations of primary auctions followed by rejections of bids on specific securities did assuage market nervousness. Thereafter, the shock of the war in Ukraine took over and dispelled the calm. A tightening tendency set in alongside the surge in international crude and commodity prices. Nevertheless, the borrowing programme of the Union Government for 2021-22 was completed in the weekly auction in the primary segment on February 25, 2022. 1.54 Although the benchmark yields softened in the second half of March with the easing of crude prices, it surged with the release of the Union Government’s borrowing programme on April 4, especially in response to frontloading for the first half of the year. To help banks manage their investment portfolios, the limit under the held-to-maturity (HTM) category was expanded on April 8, but this did not contain the rise in yields over the rest of the month. On May 4, 2022, the benchmark yield hardened to an intra-day high of 7.42 per cent, with the policy rate hike bringing about an upward shift in the yield curve, especially at the short end in response to the repricing of shorter-term securities with the introduction of the standing deposit facility (SDF) by the Reserve Bank. The G-sec yields hardened further in response to the 50 bps increase in policy rate in India and aggressive policy response of major central banks to persistence of high inflation (Chart 1.29 a and b). 1.55 Besides the projected borrowing requirement indicated in the Union Budget 2022-23, larger repayment obligations of ₹3.08 lakh crore during 2022-23 as compared to ₹2.86 lakh crore in the previous year continue to weigh on the evolution of yields (Chart 1.30). At the short end, more frequent rollover of treasury bills, the stock of which has increased to ₹9.99 lakh crore as on June 10, 2022 from ₹4.24 lakh crore in March 2020, may tighten market conditions going forward. Portfolio rebalancing in respect of EME exposure of foreign investors remains a contingent risk to market conditions (Chart 1.31). 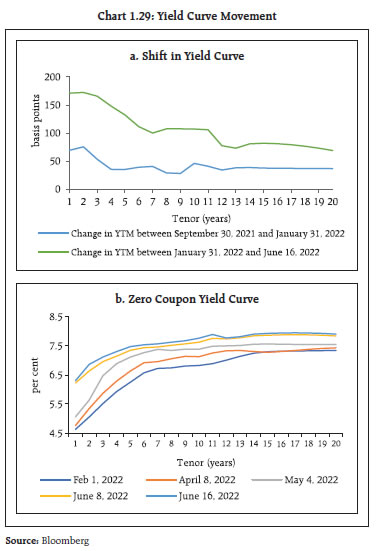 1.56 In 2022-23 and over the medium term, financial risks associated with the profile and underlying dynamics of public debt would impinge on the functioning of debt and fixed income markets. At the end of March 2021, the outstanding debt of general government (Centre and States) peaked at 89.4 per cent of GDP and is expected to remain at elevated levels until 2025-26. This will likely sustain a rising supply of issuances to the market, imparting pressure on yields and consequent crowding out of the private sector from the financial resources envelope. In 2021-22, the weighted average yield of G-Sec issuances increased by 49 basis points over the previous year. Going forward, yields may continue to reflect risk premia, with spillovers on to the private sector through higher financing costs. While the interest rate and growth rate differential (r-g) has generally remained favourable during the last three decades (excluding the COVID-19 period), the normalisation of monetary policy operations worldwide may limit this advantage. A credible debt management strategy would, therefore, involve a reduction of primary deficits or generation of modest surpluses to ensure debt sustainability. 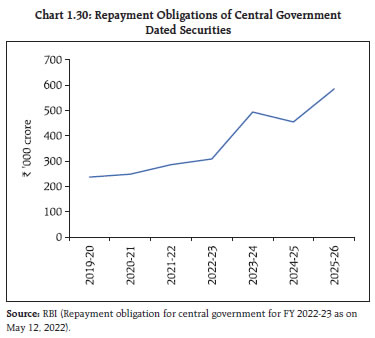
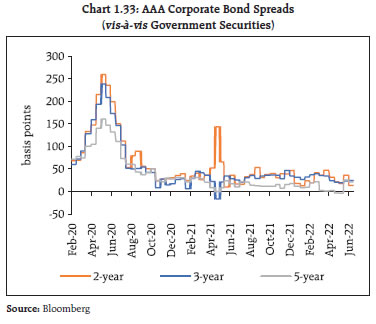
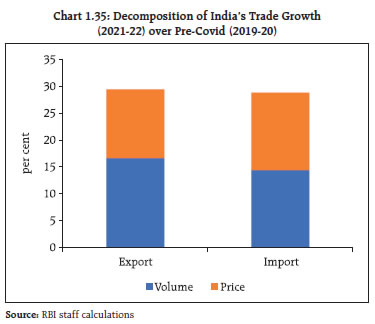
 1.57 Trading activity in the government securities market, which has been picking up since mid- March 2022, moderated in May-June 2022, alongside interbank and client turnover in overnight indexed swap (OIS) market (Chart 1.32 a and b). 1.58 In the corporate bond market, financial conditions remained easy, with spreads narrowing through 2021-22 in response to the Reserve Bank’s monetary and liquidity operations. The compression in spreads occurred across rating segments. AAA-rated corporate bonds were priced at the same level as risk-free government securities, with spreads turning negative on occasions (Chart 1.33). There was a decline in turnover, however, as primary issues decreased with private placements being overwhelmingly preferred alongside a reduction in investments by foreign portfolio investors. Since January 2022 corporate bond yields have hardened, tracking movements in G-sec yields, though lower issuances have capped upward pressures. In the aftermath of the war, the bearish sentiment in the G-sec market is being reflected in the corporate bond market across maturities and ratings. As on June 16, 2022, the yield on 3-year AAA-rated corporate bonds was 7.40 per cent, 141 bps up from end-March 2022. I.2.3 External Sector Developments and Foreign Exchange Markets 1.59 India’s external sector has remained resilient during the pandemic. As the recovery in domestic economic activity gathered pace and strength and found expression in rising import demand, the current account balance moved from a surplus of 0.9 per cent of GDP in 2020-21 to a deficit of (-)1.2 per cent in 2021-22, as the trade deficit widened. While export performance was robust, surging prices of commodities, especially crude oil, delivered a terms-of- trade shock to the trade deficit in addition to the pressure from domestic demand; both oil and non-oil trade accounts recorded higher deficit (Chart 1.34 and 1.35). 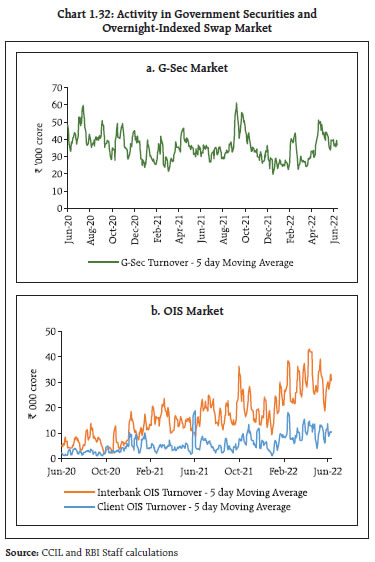
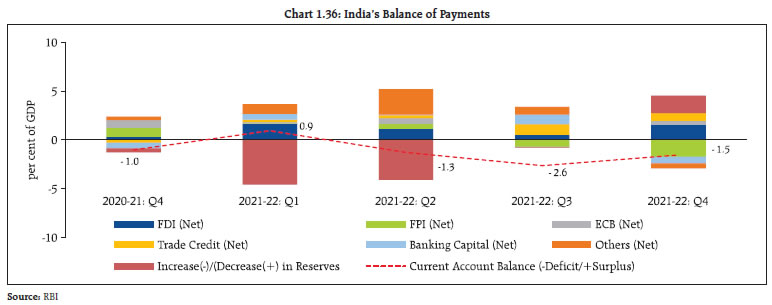
 1.60 Impediments to supply chains, availability of key raw materials and intermediates and logistics disruptions notwithstanding, India’s exports of merchandise and services performed robustly, providing an offset to widening trade deficit and an increase in net investment income payments (Chart 1.36). A renewed pick-up in remittances, after a pandemic imposed hiatus also tempered the widening of current account deficit in the financial account. Foreign direct investment (FDI) remained a stable source of external funding, with rising outward FDI turning out to be a noteworthy feature of balance of payments developments in 2021- 22. FDI amounted to USD 38.6 billion in 2021-22, marginally lower than the record level of USD 44.0 billion in 2020-21. 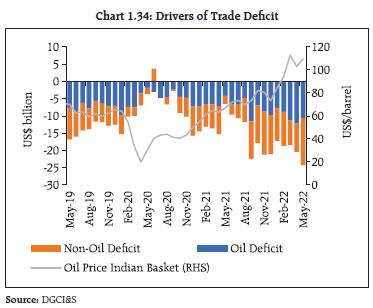
 1.61 At the same time, portfolio flows have become increasingly risk averse with flights to safety impacting EMEs as an asset class (Chart 1.37). While short-term trade credits surged in line with imports, net inflows under external commercial borrowings (ECB) amounted to USD 12.8 billion in 2021-22 as against net outflow of USD 4.0 billion in the previous year. 1.62 Non-resident deposits ebbed in response to tightening external financial conditions and the depreciation of the INR. Foreign currency non-resident (banks) {FCNR(B)} deposits have generally recorded outflows in every quarter since early 2020 (Chart 1.38). As a result, the share of foreign currency denominated NRI deposits in Q4:2021-22 has declined to 12.2 per cent from 18.6 per cent during the last two years and they are denominated in USD (74 per cent), followed by Pound sterling (11 per cent) and Japanese Yen (10 per cent). 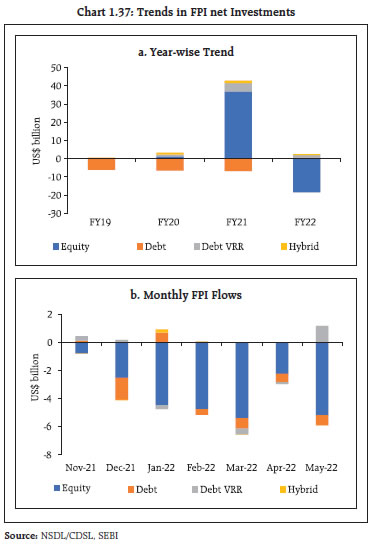
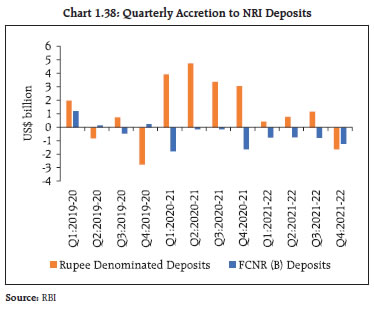
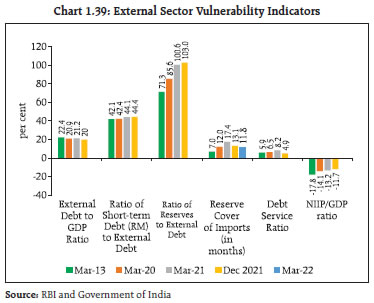 1.63 During 2021-22, foreign exchange reserves increased by USD 30.3 billion on account of net inflows of ECB and improved banking capital, and sizable net FDI. As on June 17, 2022, foreign exchange reserves declined to USD 590.6 billion from a peak of USD 642.5 billion on September 3, 2021, which is equivalent to nearly 10 months of imports projected for the current financial year, thereby providing sufficient buffer against external shocks. As a result of the accumulation of large foreign exchange reserves in recent years, various external vulnerability indicators show marked improvement vis-à-vis the taper tantrum period. This augurs well for mitigating external risks and global spillovers (Chart 1.39). 1.64 The INR, which was trading range bound before the knock-on effects from global geopolitical spillovers, experienced some volatility and depreciated by 5.7 per cent against the USD during the calendar year 2022 so far (up to June 29) (Chart 1.40). On a financial year basis, the depreciation of the INR was lower at 3.9 per cent. The INR has, however, turned out to be one among the stable currencies relative to peers in the period since the war (Chart 1.41). 1.65 Heighted global uncertainty from the geopolitical conflict, surge in crude oil prices and monetary policy tightening by systemically important central banks have weighed heavily on the INR in 2022 relative to the preceding year. The USD-INR exchange rate touched an all-time low of 78.98 on June 29, 2022, as recession fears and risk-off sentiment spread worldwide. The INR has, however, shown resilience relative to previous episodes of volatility, trading close to its long-term trend (Chart 1.42).
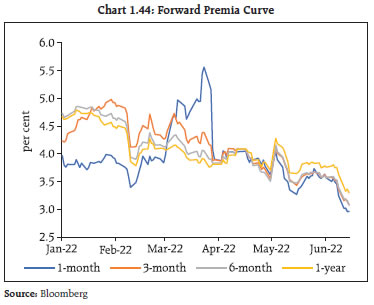
1.66 The 1-month implied volatility of the USD-INR started increasing by end-February 2022 (Chart 1.43 a). Risk reversal (RR16) also increased during the same period. The RR came down subsequently from a high of 2.18 in March 2022 to 1.16 on June 16, 2022 (Chart 1.43 b). 1.67 Along with the spot market, volatility was also observed in the forward market, with a general softening in the forward premia across tenors along with sharp spikes in near-month tenors. The hedging cost for firms as reflected by one-year forward premium declined from 4.6 per cent at end-December 2021 to 3.3 per cent on June 16, 2022 (Chart 1.44). 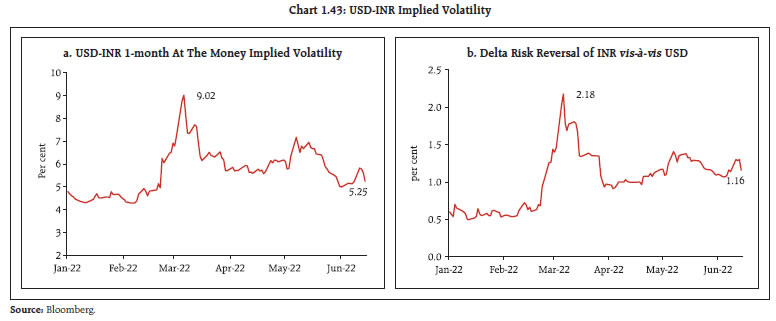
 1.68 Among the components of India’s external debt liabilities, commercial borrowings and deposits of non-resident Indians (NRIs) together constituted nearly 60 per cent of India’s external debt followed by short-term trade credits account (18 per cent) (Table 1.1). Net ECB17 amounted to USD 12.8 billion during 2021-22. Nearly 80 per cent of the ECB are denominated in US dollars and 5 per cent each are denominated in Euro and Japanese yen. A predominant component (56 per cent) of ECB loans are hedged (Table 1.2). Private sector borrowers have a larger share of hedged loans. Also, certain unhedged loans, where borrower’s earning is in foreign currency (e.g., shipping companies), retain natural hedge. | Table 1.1: Outstanding External Debt | | | Dec-20 (USD billion) | Per cent of Total External Debt | Dec-21 (USD billion) | Per cent of Total External Debt | | Multilateral | 68.1 | 12.0 | 71.5 | 11.6 | | Bilateral | 30.5 | 5.4 | 30.7 | 5.0 | | IMF | 5.7 | 1.0 | 23.2 | 3.8 | | Export Credit | 6.5 | 1.1 | 5.6 | 0.9 | | Commercial Borrowing | 212.5 | 37.4 | 226.4 | 36.8 | | NRI Deposits | 140.5 | 24.7 | 141.9 | 23.1 | | Rupee Debt | 1 | 0.2 | 1 | 0.2 | | Short-Term Debt | 103.5 | 18.2 | 114.6 | 18.6 | | Of which, Short-Term Trade Credit | 99.6 | 17.5 | 110.5 | 18.0 | | Total External Debt | 568.3 | 100.0 | 614.9 | 100.0 | | Source: Department of Economic Affairs, Ministry of Finance, GoI |
| Table 1.2: Hedging of ECB* loans | | (As on March 31, 2022) | | Description | Amount (USD million) | | A. ECB - Total outstanding | 179,994 | | B. ECB - INR denominated | 16,721 | | C. ECB – FDI Companies’ borrowings from foreign parent | 27,879 | | D. ECB – Non-Rupee and non-FDI [= A-B-C] | | | of which: | 135,394 | | (a) Public sector companies | 56,614 | | (b) Private companies and others | 78,780 | | E. Hedging details of non-Rupee non-FDI ECB (i.e., D above) | | | (i) Hedging declared on registration during April 2019-March 2022 | | | of which: | 40,641 | | (a) Public sector companies | 7,669 | | (b) Private companies and others | 32,972 | | (ii) Other past loans reported hedged by borrowers | | | of which: | 15,628 | | (c) Public sector companies | 8,975 | | (d) Private companies and others | 6,653 | | F. ECB – Unhedged {D-(E1+E2)} | 79,125 | | G. Percentage share of unhedged ECB {(F)/(A)*100} | 44.0 | * includes Foreign currency convertible bonds (FCCBs) and Rupee denominated bonds (RDBs)
Source: RBI | I.2.4 Domestic Equity Market 1.69 Domestic equity indices had made significant gains during 2020 and 2021, outperforming peers on the back of better growth prospects. Developments in 2022 have, however, unsettled market sentiments and increased risk aversion, with the war triggering a broad-based sell-off. In line with corrections underway in stock markets in major economies, sentiments in Indian equity markets have turned bearish and have registered negative returns, with the BSE Sensex decreasing by 11.6 per cent and Nifty 50 declining by 11.5 per cent between end-December and June 16, 2022. (Chart 1.45). 1.70 Spillovers from the global risk-off sentiment have triggered FPI outflows from EMEs, including India. After record inflows of ₹2.76 lakh crore in 2020-21, Indian equities witnessed selling pressures from foreign institutional investors (FIIs) for the eighth consecutive month up to May 2022 with the total net outflow of ₹1.3 lakh crore in 2021-22 and cumulative net outflow of ₹66,809 crore in April and May 2022. Sustained buying interests from domestic institutional investors (DIIs), however, supported the market, capping losses (Chart 1.46 and 1.47). 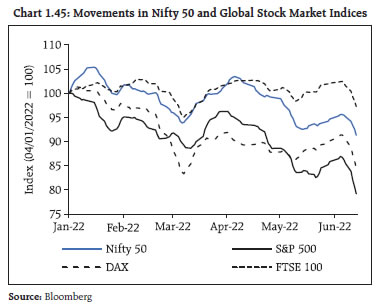
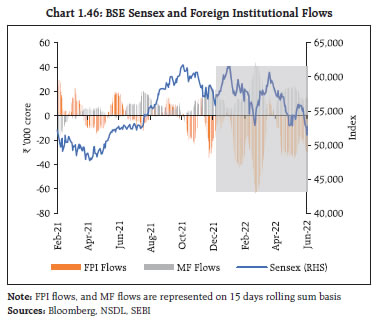
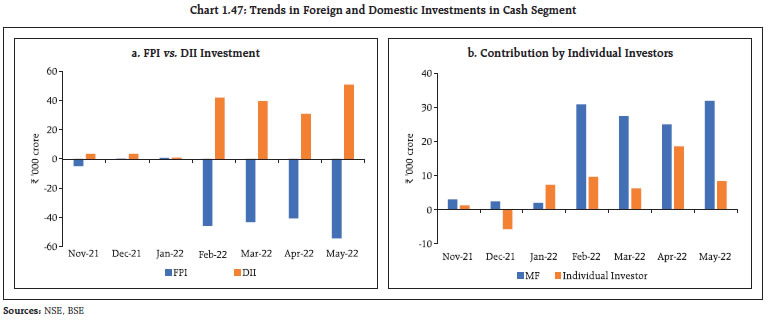 1.71 Until the recent correction, equity market valuations remained rich, with the 12-month trailing price-to-earnings (PE) of the BSE Sensex well above its 10-year average of 22.4, before falling to 20.8 by mid-June 2022. The 12-month forward PE multiple, however, is still above emerging and developed market peers (Chart 1.48 a and c). Market capitalisation was 1.12 times GDP, above its 10-year average of 0.79 (Chart 1.48 b). Moreover, bond-equity-earnings- yield ratio (BEER) - a measure of relative attractiveness of equities vis-à-vis bonds - dipped below its long-term average of 1.61 (Chart 1.48 d). 1.72 The easing of pandemic related restrictions and brightened prospects of economic recovery led to a slew of Initial Public Offerings (IPOs) in 2021- 22. Corporates raised the highest ever funds through IPOs in 2021-22, amounting to ₹1.11 lakh crore, with many new age tech companies/start-ups getting listed.. During November 2021 to May 2022, seven start-up IPOs were listed, raising ₹38,170 crore, with an average oversubscription rate of 40 times and 4 of them registered gains on the day of listing (Table 1.3). Their post-listing performance has, however, moderated significantly. Also, at end-May 2022, six of the eight start-ups listed during 2021-22 were trading at a loss as compared to their listing prices. | Table 1.3: Fund Raising through IPOs | | Particulars/IPO Types | Main Board IPOs excluding start-up IPOs | Start-up IPOs in 2021-22 | Start-up IPOs during Nov-21 to May-22 | | Number | 43 | 8 | 7 | | Total Capital Raised (₹crore) | 66,300 | 45,309 | 38,170 | | Average No. of times oversubscribed | 55.73 | 41.91 | 39.49 | | Average of same day listing gains | 34.84 | 19.9 | 15.9 | | Source: SEBI | 1.73 Individual investors’ participation in stock exchanges has increased significantly since the onset of the COVID-19 pandemic and registration of new investors on exchanges is reaching beyond metropolitan centres and big cities. During January 2020 to May 2022, the number of demat accounts of individuals has increased by 3.4 times in the Central Depository Services Limited (CDSL) and by 1.5 times in the National Securities Depository Limited (NSDL) (Chart 1.49). 1.74 The decline in real returns on fixed income investments, simplification of know your customer (KYC) registration processes, effective use of digital technology and opening of online accounts, enhanced availability of investment information on digital modes and growing public awareness has promoted a widening of the investor base, including first-time investors. The number of retail investors who are actively trading in the stock market is also on the rise (Chart 1.50). I.2.5 Commodity Derivatives 1.75 During November 2021-May 2022, the benchmark domestic commodity derivative indices, viz., MCX iCOMDEX composite increased 19.6 per cent, whereas Nkrishi Index (which was discontinued w.e.f. April 01, 2022) increased by 18.7 per cent. The S&P GSCI and Refinitiv/Core Commodity CRB Total Return Index increased by 33.7 per cent and 33.5 per cent, respectively, during November 2021 – May 2022 (Chart 1.51).
1.76 The iCOMDEX Energy Index increased by 64.4 per cent, reflecting the surge in crude oil and natural gas prices during November 2021 - May 2022 (Chart 1.52). 1.77 The aggregate turnover in commodity derivatives (across all exchanges) increased by 13.1 per cent during November 2021 – May 2022 over the corresponding period of the previous year, with energy derivatives being the driving factor (Table 1.4). I.2.6 Mutual Funds 1.78 Assets under management (AUM) of open-ended mutual funds, both debt and equity, have grown by 65 per cent since the onset of the pandemic and stood at ₹26.5 lakh crore in May 2022 (Chart 1.53). 1.79 Investors’ preference for safe assets in recent times is reflected in the rising share of liquid assets in aggregate holdings of debt mutual funds Chart 1.54). | Table 1.4: Segment-wise Aggregate Turnover (Futures + Options) | | (₹ crore) | | FY Period/ Turnover | Agri. | Bullion | Energy | Metals | Total Turnover | | 2020-21 (Nov-May) | 3,61,452 | 28,52,001 | 12,84,388 | 10,32,174 | 55,30,015 | | 2021-22 (Nov-May) | 2,30,137 | 19,14,647 | 34,09,005 | 6,98,747 | 62,52,536 | | Change (per cent) | -36.3 | -32.9 | 165.4 | -32.3 | 13.1 | Note: Turnover includes Futures + Option turnover wherein Option Turnover is based on Notional value.
Turnover of Index Futures at MCX and NCDEX added in the respective sector.
No trading activity was observed in gems and stones segment in all exchanges during the period.
Source: MCX, NCDEX, BSE, National Stock Exchange (NSE), Indian Commodity Exchange Ltd. (ICEX) |
1.80 The share of overnight mutual funds in the total debt AUM of open-ended schemes have risen from 6.1 per cent in November 2021 to 9.3 per cent in May 2022 (Chart 1.55). 1.81 Incorporated entities and high net worth individuals (HNIs) continue to dominate the investor profile of open-ended debt funds, accounting for more than 90 per cent of their total AUM and over 60 per cent share in equity funds (Chart 1.56 and 1.57). 1.82 Lower-rated corporate bond holdings of mutual funds have been moderating since early 2021 and the decline has been particularly sharp during H2:2021-22 (Chart 1.58).
1.83 The share of equity funds held for longer duration (beyond one year) has gradually declined in favour of holdings up to one year (Chart 1.59 and 1.60). I.2.7 Banking Stability Indicator18 1.84 The banking stability indicator, which presents an overall assessment of changes in underlying conditions and risk factors that have a bearing on the stability of the banking sector, showed improvement in soundness, efficiency and market risk dimensions in H2:2021-22 (Chart 1.61). The improvement in the soundness indicator reflects enhanced capital buffers as CRAR rose by 18 bps to 16.7 per cent. Although the liquidity risk indicator deteriorated marginally during H2:2021-22 due to decline in the liquidity-coverage ratio (LCR) from 160.9 per cent to 147.3 per cent in March 2022, the latter remains well above the regulatory requirement of 100 per cent. Asset quality and profitability indicators remained broadly unchanged during 2021-22.
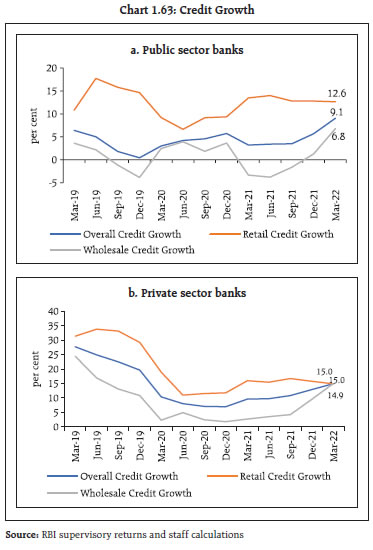
I.2.8 Banking Credit 1.85 As the Indian economy made its way through waves of the pandemic, annual growth in bank credit by scheduled commercial banks (SCBs) reached 13.1 per cent in early June 2022, a rate last recorded in March 2019. The impetus has stemmed from wholesale credit19, which moved to double-digit growth trajectory from a declining profile a year ago. At the same time, retail credit growth remained robust (Chart 1.62). Within the banking sector, private sector banks (PVBs) continue to outpace their counterparts in the public sector in credit growth, both wholesale and retail (Chart 1.63 a and b). 
 1.86 A deeper profiling of bank credit indicates that most of the revival was in the second half of 2021-22, and it has continued during the current financial year so far (Table 1.5). While personal loans remained a dominant component, credit demand from the industrial sector revived after collapsing in 2020-21 as well as in the first half of 2021-22. A significant portion of new industrial loans was extended as working capital loans. Loan growth to private corporate sector turned positive after two successive years of decline and deleveraging. | Table 1.5: Incremental Growth in Credit by SCBs (excl. RRBs) | | (Amount in ₹ ‘000 crore) | | | 2019-20 | 2020-21 | 2021-22* | | Full year | Full year | Full year | Second half | | A. Economic Sector | | | | | | i) Agriculture | 11 | 113 | 166 | 114 | | ii) Industry | 28 | -115 | 149 | 234 | | iii) Transport operators | -3 | 5 | -2 | 0 | | iv) Professional and other services | 53 | -10 | 51 | 85 | | v) Personal Loans | 388 | 335 | 466 | 338 | | of which, Housing Loan | 182 | 162 | 201 | 145 | | vi) Trade | 108 | 113 | 51 | 90 | | vii) Finance | 79 | 50 | 191 | 190 | | viii) Others | -60 | 29 | 75 | 66 | | B. Organisational Sector | | | | | | i) Public Sector | 137 | 58 | 228 | 244 | | ii) Private Corporate Sector | -71 | -95 | 170 | 288 | | iii) Households Sector – Individuals | 511 | 433 | 655 | 470 | | iv) Household Sector – Others ** | 6 | 122 | 73 | 92 | | v) Others (MFIs, NPISHs, NRIs and cooperatives) | 21 | 3 | 22 | 23 | | C. Type of Loan Account Wise | | | | | | i) Working capital loans | 32 | -88 | 222 | 278 | | ii) Term loans | 569 | 588 | 823 | 751 | | iii) Cards | 43 | 15 | 41 | 33 | | iv) KCC | 0 | 20 | 9 | 9 | | v) Export credit | -19 | 6 | 22 | 23 | | vi) Import credit | 0 | -1 | 0 | 0 | | vii) Other miscellaneous | -19 | -20 | 31 | 22 | | Total credit | 605 | 521 | 1,148 | 1,116 | * Data pertaining to March-2022 are provisional.
** 'Others' within household sector include proprietary concerns, partnership firms, Hindu undivided families.
Source: Basic Statistical Returns, RBI | 1.87 Importantly, banks’ balance sheets remain robust, with non-performing assets (NPAs) on a decline for both wholesale and retail loans, and capital buffers remain adequate (Chart 1.64 a). The decline in risk-weighted assets continues, indicating that banks are still careful about the risk profile of borrowers in a dynamic environment characterised by considerable uncertainty (Chart 1.64 b). I.2.9 Interest Rate Risk in Banking Book 1.88 The shift of banking sector towards the external benchmark linked lending rate (EBLR) based pricing of loans has improved the pace and extent of monetary policy transmission20 (Table 1.6). 1.89 Most banks have chosen the Reserve Bank’s repo rate as their external benchmarks. Under the EBLR regime, the shift in interest rate cycle will have a quicker impact on both deposit and lending rates of banks; their investment portfolios would also undergo revaluation. 1.90 A survey of select banks (five PSBs and five PVBs) showed that 20 per cent of the loan book linked to EBLR has reset frequency less than the underlying benchmark (Table 1.7). This may expose banks to basis risk. Moreover, over a third of the advances are at fixed rates in the case of PVBs, which may experience unrealised losses through reduction in the NPV of future cash flows in a rising interest rate cycle and reduce their economic value of equity (EVE). PSBs, which have larger share of MCLR-linked loans may also be exposed to erosion in EVE as their deposit and lending rates are sticky and change less frequently than market interest rates (Chart 1.65) 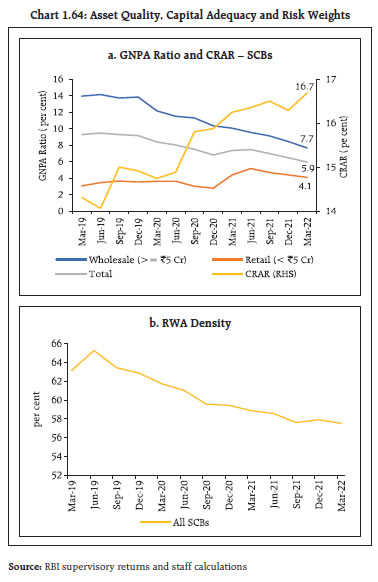
| Table 1.6: Share of Floating Rate Linked Outstanding Rupee Loans of SCBs: Interest Rate Benchmarks | | (per cent to Total) | | Bank Group | Base Rate | MCLR | External Benchmark | | Sep-19 | Mar-20 | Mar-21 | Dec-21 | Mar-22 | Sep-19 | Mar-20 | Mar-21 | Dec-21 | Mar-22 | Sep-19 | Mar-20 | Mar-21 | Dec-21 | Mar-22 | | Public sector banks (11) | 14.6 | 11.9 | 7.8 | 6.6 | 6.0 | 83.1 | 79.5 | 68.7 | 61.4 | 57.7 | 0.4 | 4.8 | 20.3 | 28.3 | 32.7 | | Private sector banks (21) | 8.3 | 6.8 | 3.9 | 3.0 | 2.7 | 86.7 | 75.5 | 53.0 | 39.9 | 35.9 | 4.6 | 17.5 | 43 | 57 | 60.8 | | Foreign banks (42) | 6.8 | 5.2 | 2.7 | 1.7 | 1.3 | 67.3 | 56.7 | 30.7 | 24.8 | 23.5 | 25.7 | 37.9 | 66.6 | 73.3 | 73.9 | | SCBs (74) | 12.5 | 10.2 | 6.4 | 5.3 | 4.7 | 83.8 | 77.7 | 62.8 | 53.1 | 49.2 | 2.4 | 9.3 | 28.6 | 39.2 | 43.6 | Note: Figures in parentheses refer to the number of banks. Data are provisional and subject to change. Figures in the table do not add upto hundred because residual loans are linked to BPLR.
Source: Individual bank submissions and staff calculations | I.2.10 Wholesale Bank Credit 1.91 An analysis of the funded amount of obligors in the “companies” category, which accounts for 85.5 per cent of the total funded amount to wholesale obligors, shows that credit absorption by public sector undertakings (PSUs) remains robust. The decline in credit to non-PSU cohorts during 2019-20 and 2020-21 has reversed, largely driven by PVBs’ lending (Table 1.8). 1.92 SCBs exposures to the private non-financial corporate sector grew, with higher rated companies recording 10.13 per cent loan growth during 2021-22 (Table 1.9). | Table 1.7: Share of Gross Advances Linked to Tenure of Interest Benchmark | | (per cent) | | Aggregate Loan amount (as a per cent of Advances) | MCLR | External Term Benchmark(s) | Other Benchmark(s) | Fixed Rate | | ≤ Interest Benchmark tenor | > Interest Benchmark tenor | ≤ Interest Benchmark tenor | > Interest Benchmark tenor | ≤ Interest Benchmark tenor | > Interest Benchmark tenor | | PSBs | 43.8 | 0.2 | 19.0 | 16.5 | 6.2 | 0.0 | 14.3 | | PVBs | 11.4 | 5.3 | 16.7 | 25.3 | 0.5 | 4.2 | 36.5 | | SCBs | 30.8 | 2.3 | 18.1 | 20.0 | 3.9 | 1.7 | 23.2 | Note: Sample of ten banks (five PSBs and five PVBs)
Source: Individual bank submissions and staff calculations |
| Table 1.8: Growth in Wholesale Credit | | (y-o-y, per cent) | | | PSU | Non-PSU | | Mar-20 | Mar-21 | Mar-22 | Mar-20 | Mar-21 | Mar-22 | | PSB | 19.50 | 5.39 | 15.09 | -4.10 | -8.97 | 0.01 | | PVB | 45.06 | 60.02 | 8.99 | -0.78 | -6.13 | 13.49 | | PSB+PVB | 21.96 | 11.65 | 14.09 | -2.84 | -7.86 | 5.35 | | Source: CRILC and RBI staff calculations |
| Table 1.9: Growth in Wholesale Credit to Non-PSU Non-Financial Companies | | (y-o-y, per cent) | | | Mar-20 | Mar-21 | Mar-22 | | AA and above | 15.83 | -15.03 | 10.13 | | Other Investment Grade | -5.06 | -6.17 | -0.17 | | Below Investment Grade | -15.75 | 3.96 | 0.50 | | Unrated/NA | -5.85 | -9.88 | 12.63 | | Total | -3.83 | -7.36 | 5.89 | | Source: Prime Database, CRILC and RBI staff calculations | 1.93 A size-wise disaggregation of wholesale credit also points to increase in banks’ exposure in all categories in Q4:2021-22, except for the category of loans above ₹5,000 crore, which has remained flat (Chart 1.66). 1.94 Mirroring wholesale credit movements, banking sector exposure to private NBFCs/housing finance companies (HFCs) also increased in H2:2021- 22. Most of the incremental credit was to top rated entities (Chart 1.67). 1.95 The general pickup in financing requirements in the real sector was facilitated by improvement in long term ratings upgradation, which is also evident from aggregate mobilisation of funds through market instruments (Chart 1.68 and Table 1.10). | Table 1.10: Aggregate Mobilisation of Funds | | (₹ ‘000 crore) | | Quarter-end Outstanding Amount under | Mar-20 | Sep-20 | Mar-21 | Sep-21 | Mar-22 | | Commercial Paper (CP) | 345 | 362 | 364 | 371 | 352 | | Corporate Bonds | 3,254 | 3,406 | 3,613 | 3,701 | 4,017 | | ECB | 1,242 | 1,211 | 1,241 | 1,291 | 1,358 | | Wholesale Credit | 5,582 | 5,410 | 5,507 | 5,492 | 6,079 | | Total | 10,423 | 10,389 | 10,725 | 10,855 | 11,806 | Note: Wholesale credit numbers are for PSBs, PVBs and FBs combined based on CRILC
Sources: RBI, SEBI and NSDL |
I.2.11 Non-Banking Financial Companies (NBFCs) 1.96 The NBFC sector has a satisfactory capital position and asset quality at the aggregate level. An analysis of commercial paper (CPs) issued by a sample of ten large NBFCs, which accounted for 70 per cent of gross issuances during November 2021 to April 2022, revealed that 69 per cent of issuances were in the 0-30 days tenor. Moreover, 49 per cent of the funds raised were used for IPO financing (Chart 1.69). In the revised regulatory framework for NBFCs issued in October 2021, the Reserve Bank has placed a ceiling of ₹1 crore per borrower for financing subscription to IPOs, with effect from April 1, 2022. Consequently, since December 2021, there has been a sharp decline in IPO funding by NBFCs. The majority of the funds raised through CPs are for working capital or debt repayment. 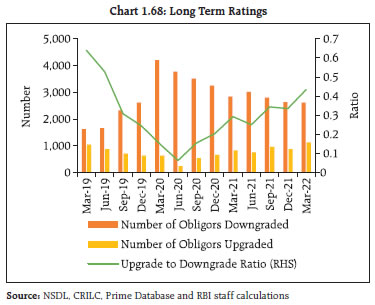
 1.97 The GNPA ratio of the sector (excluding core investment companies) has improved from 6.1 per cent in March 2021 to 5.8 per cent in March 2022. Moreover, Special Mention Accounts (SMAs)21 decreased from 13.3 per cent of total advances in September 2021 to 9.2 per cent in March 2022. Pockets of stress are, however, observed in select NBFC cohorts, viz., NBFC-Factor (21.8 per cent) and NBFC- Investment and Credit Companies (7.9 per cent) (Table 1.11). | Table 1.11: Asset Quality Ratios across NBFC Categories | | (per cent) | | | GNPA | SMA-0 | SMA-1 | SMA-2 | | NBFC - MFI (2.9 %) | Mar-21 | 5.4 | 2.3 | 1.7 | 1.0 | | Jun-21 | 6.1 | 8.8 | 4.4 | 2.4 | | Sep-21 | 5.9 | 4.4 | 2.2 | 1.4 | | Dec-21 | 5.7 | 2.4 | 2.1 | 1.4 | | Mar-22 | 4.7 | 2.1 | 1.5 | 1.3 | | NBFC - Factor (0.1%) | Mar-21 | 25.0 | 13.7 | 1.7 | 1.7 | | Jun-21 | 29.2 | 14.2 | 2.2 | 2.7 | | Sep-21 | 26.0 | 13.8 | 1.5 | 1.1 | | Dec-21 | 27.1 | 13.6 | 2.3 | 0.0 | | Mar-22 | 21.8 | 11.7 | 1.3 | 0.0 | | NBFC - ICC (51.6 %) | Mar-21 | 8.0 | 7.5 | 3.2 | 3.1 | | Jun-21 | 9.6 | 8.2 | 4.5 | 3.9 | | Sep-21 | 9.0 | 7.2 | 3.9 | 3.3 | | Dec-21 | 9.0 | 6.6 | 3.6 | 2.9 | | Mar-22 | 7.9 | 6.1 | 3.3 | 2.3 | | NBFC - IFC (44.2 %) | Mar-21 | 3.9 | 5.2 | 1.9 | 2.4 | | Jun-21 | 3.8 | 3.0 | 0.1 | 6.9 | | Sep-21 | 3.8 | 1.9 | 0.0 | 10.9 | | Dec-21 | 4.0 | 0.2 | 0.0 | 3.3 | | Mar-22 | 3.6 | 2.5 | 2.2 | 2.1 | | NBFC-IDF (1.2 %) | Mar-21 | 0.4 | 0.0 | 0.1 | 1.7 | | Jun-21 | 0.4 | 0.0 | 0.0 | 0.6 | | Sep-21 | 0.4 | 0.0 | 0.0 | 0.6 | | Dec-21 | 0.8 | 0.6 | 0.1 | 0.0 | | Mar-22 | 0.3 | 0.0 | 0.1 | 0.4 | | Total | Mar-21 | 6.1 | 6.3 | 2.6 | 2.7 | | Jun-21 | 6.9 | 5.8 | 2.5 | 5.1 | | Sep-21 | 6.5 | 4.7 | 2.1 | 6.5 | | Dec-21 | 6.6 | 3.6 | 1.9 | 3.0 | | Mar-22 | 5.8 | 4.3 | 2.7 | 2.2 | Note: Number in parenthesis indicates percentage share of each category of NBFC to total advances of NBFCs.
Source: RBI Supervisory Returns | I.2.12 Credit flows to the MSME Sector 1.98 The micro, small and medium enterprise (MSME) sector, which was hit hard by the pandemic, is showing signs of revival: aggregate credit to the sector witnessed a strong revival during Q4:2021- 22, supported by significant growth in lending by PVBs (Chart 1.70). The upsurge of domestic demand and pick up in ancillary industries and service units has increased funding requirement of this sector, which provides employment to a large section of the population. 1.99 The Emergency Credit Line Guarantee Scheme (ECLGS22) has played a key role in reviving the MSME sector. Loans amounting to ₹3.32 lakh crore were sanctioned under the ECLGS, till April 30, 2022, of which an amount of ₹2.54 lakh crore was disbursed (₹2.36 lakh crore by SCBs). The drawdown under ECLGS 1.0, 2.0 and its extension comprised over 97 per cent of the total guarantees issued (Chart 1.71).
1.100 PVBs showed greater appetite than PSBs in utilising different ECLGSs, though the number of repeat borrowers remained similar for PSBs and PVBs (Chart 1.72 a and b). 1.101 The aggregate GNPA Ratio (PSBs and PVBs) in the MSME sector has moderated from 11.3 per cent in September 2021 to 9.3 per cent in March 2022. They, however, remain relatively high. Moreover, restructuring of portfolios to the tune of ₹46,186 crore constituting 2.5 per cent of total advances under the May 2021 scheme23 has the potential to create stress in the sector (Tables 1.12 and 1.13). | Table 1.12: MSME Restructuring | | Restructuring Scheme | Aggregate portfolio restructured (₹ crore) | | PSBs | PVBs | | Restructuring- January 2019 scheme | 26,190 | 2,174 | | Restructuring- February 2020 scheme | 5,860 | 1,364 | | Restructuring- August 2020 scheme | 18,232 | 11,027 | | Restructuring- May 2021 scheme | 30,285 | 15,901 | | Source: RBI supervisory returns and staff calculations. |
| Table 1.13: MSME Asset Quality Profile | | (per cent) | | | PSBs + PVBs | | 0 days past due | SMA-0 | SMA-1 | SMA-2 | GNPA | | Mar-21 | 74.0 | 7.3 | 5.7 | 2.2 | 10.8 | | Jun-21 | 72.4 | 8.6 | 3.8 | 3.4 | 11.9 | | Sep-21 | 76.3 | 6.6 | 2.6 | 3.1 | 11.3 | | Dec-21 | 75.4 | 8.8 | 3.1 | 2.3 | 10.4 | | Mar-22 | 79.7 | 6.4 | 3.5 | 1.1 | 9.3 | | Source: RBI supervisory returns and staff calculations. | 1.102 Borrowers who availed ECLGS 1.0 and 2.0 continue to avail extension facilities. Coupled with the higher avail rate (i.e., proportion of MSME borrowers availing ECLGS loans to the total eligible base) among low-rated borrowers and those that had a higher need for credit even before the pandemic, this portends potential stress in banks’ MSME portfolios. 1.2.13 Microfinance Segment 1.103 Aggregate credit to the microfinance sector is expanding steadily and has now exceeded its pre-pandemic levels. Credit provided by all types of lenders are showing signs of stabilisation (Chart 1.73 a, b and c). Importantly, the growth in credit appears to be broad-based as lending to both existing and fresh borrowers is growing.
1.104 The microfinance segment, which witnessed reduction in credit and increase in impairments during the pandemic, is showing signs of revival. Stress in this segment is diminishing, with delinquency levels measured in terms of 30+ dpd (days past due) declining and 90+ dpd remaining steady across lenders in H2:2021-22 (Chart 1.74). I.2.14 Consumer Credit 1.105 Based on inquiry volumes24, the demand for consumer credit, which was consistently trending upwards after the second wave of the pandemic, has moderated in Q1:2022-23 (Chart 1.75). 1.106 The volume of enquiries indicates that loan demand has increased substantially after the second wave of the pandemic across all borrower categories, with home loans and loans against property recording the maximum growth. The moderation in enquiries with banks, NBFCs and HFCs, which began after December 2021 due to the emergence of Omicron continues, but there has been a significant rise in the case of FinTech25 platforms (Chart 1.76).
1.107 The declining trend in the growth in credit for active consumers26 is persisting. (Chart 1.77). 1.108 Inquiry volumes by risk tier shows that loan demand from all categories of borrowers is stabilising (Chart 1.78). The distribution by risk tier27 shows improvement in the customer mix across all category of lenders, except PSBs whose exposure to below-prime borrowers rose marginally (Table 1.14). 1.109 The proportion of portfolios at 90 dpd or beyond, a measurement of impairment in consumer credit, has stabilised across lender categories (Table 1.15). The improvement in credit standards is also reflected in moderation in approval rates (Chart 1.79). | Table 1.14: Consumer Distribution by Risk Tier and Lender Category | | (as a per cent of credit active consumers) | | Score Band | Select NBFCs28 (24) | All NBFCs | All PSBs | All PVT Banks | Industry | | Mar-21 | Mar-22 | Mar-21 | Mar-22 | Mar-21 | Mar-22 | Mar-21 | Mar-22 | Mar-21 | Mar-22 | | Subprime | 29.6 | 25.2 | 33.5 | 28.9 | 29.2 | 30.5 | 18.2 | 16.1 | 28.3 | 27.1 | | Near prime | 24.5 | 23.6 | 25.1 | 23.6 | 26.0 | 25.7 | 17.4 | 16.8 | 23.3 | 22.2 | | Prime | 29.6 | 35.6 | 28.5 | 34.4 | 28.7 | 27.6 | 33.0 | 35.5 | 29.1 | 30.7 | | Prime plus | 14.6 | 14.1 | 11.6 | 11.8 | 11.8 | 11.9 | 21.5 | 21.2 | 14.1 | 14.4 | | Super prime | 1.6 | 1.5 | 1.2 | 1.3 | 4.4 | 4.3 | 9.8 | 10.3 | 5.2 | 5.6 | | Total | 100.0 | 100.0 | 100.0 | 100.0 | 100.0 | 100.0 | 100.0 | 100.0 | 100.0 | 100.0 | | Below Prime | 54.1 | 48.8 | 58.6 | 52.5 | 55.2 | 56.2 | 35.6 | 32.9 | 51.6 | 49.3 | | Source: TransUnion CIBIL | I.2.15 Housing Market 1.110 The housing market in India is becoming organised and is getting increasingly financed by banks for both home buyers as well as builders. During the current phase of the economic recovery, the housing market has also regained momentum driven by a combination of easy financial conditions and supportive policy environment. As a result, housing sales have increased, and new launches have expanded, though there was some hiatus around the emergence of Omicron in Q4:2021-22 (Chart 1.80). Overall, the decline in unsold inventory has helped bring down the inventory overhang29 during the last three quarters of 2021-22 (Chart 1.81). | Table 1.15: Delinquency Levels in Aggregate Consumer Credit across all Product Categories | | (per cent) | | | PSB | PVB | NBFC/HFC | FinTech | | Mar-21 | 4.90 | 2.01 | 3.05 | 3.13 | | Apr-21 | 4.94 | 2.04 | 3.96 | 3.57 | | May-21 | 5.71 | 2.48 | 5.08 | 4.69 | | Jun-21 | 5.52 | 2.63 | 4.57 | 3.69 | | Jul-21 | 5.29 | 2.76 | 4.59 | 4.71 | | Aug-21 | 5.35 | 2.63 | 4.20 | 4.68 | | Sep-21 | 4.87 | 2.22 | 3.64 | 4.83 | | Oct-21 | 5.12 | 1.89 | 3.96 | 4.61 | | Nov-21 | 5.07 | 1.78 | 3.47 | 4.53 | | Dec-21 | 4.85 | 1.97 | 3.23 | 3.58 | | Jan-22 | 4.97 | 2.07 | 2.97 | 3.29 | | Feb-22 | 4.78 | 1.85 | 3.00 | 2.81 | | Mar-22 | 4.45 | 1.40 | 2.34 | 2.26 | Note: based on 90 days past due balances
Source: TransUnion CIBIL |
I.2.16 Systemic Risk Survey30 1.111 In the May 2022 round of Systemic Risk Survey, global spillovers and financial market volatility moved to the ‘high’ risk category. Global growth uncertainty, commodity price movements, geopolitical conditions and monetary tightening in AEs were perceived to be the major drivers of escalation in global risks. The rise in financial market risk was assessed to be emanating from tightening of financial conditions: foreign exchange pressure; interest rate and liquidity tightening; and elevated equity price volatility. The survey respondents assessed that macroeconomic uncertainty, though rising, remained a ‘medium’ risk. Three-fourths of the respondents perceived the war in Ukraine to have a medium impact on the Indian economy as a whole. 1.112 Nearly 44 per cent of the panellists judged that the prospects of the Indian banking sector over a one-year horizon have improved and another 35 per cent expected the same to remain unchanged. Around 38 per cent of the respondents expected marginal deterioration in asset quality of the banking sector over the next three months attributable to factors such as COVID-19 induced regulatory forbearance, improved asset quality recognition, higher input costs, supply chain bottlenecks impacting profit margins of firms and tightening of monetary and liquidity conditions. Most of the panellists expected marginal to considerable improvement in credit demand over the next three months on the back of recovery in GDP growth, higher consumer spending, pick up in manufacturing sector activity, public investment in infrastructure and higher demand for working capital. Summary and Outlook 1.113 The global economy faces downside risks to growth prospects even as inflationary pressures persist. Central banks the world over face the challenges of managing soft landings while maintaining macroeconomic and financial stability. 1.114 Despite bouts of volatility, the global financial system has maintained overall stability. Financial conditions have, however, tightened markedly over the past few months, driven by a combination of increasing risk aversion among market participants in the face of downside risks to the outlook and front-loaded monetary policy normalisation to manage inflation and inflationary expectations. 1.115 The economic cost of the war and sanctions are interacting with monetary tightening, financial market volatility, the pandemic and vaccine access. For EMEs, rising interest rates will tighten external financing conditions and leave them vulnerable to a generalised flight to safety. Those with large debt overhangs will face pressure on budgets and debt servicing. The risks to long term growth prospects remain large and to the downside. 1.116 The Indian economy and the domestic financial system remain strong and resilient in a hostile international environment, supported by robust domestic macroeconomic fundamentals. On the back of adequate capital buffers and improving asset quality levels, the Indian banking system is well positioned to support economic growth, with bank credit growing in double digits after a long hiatus. The non-banking system remains well capitalised. Financial markets, however, are witnessing heightened volatility because of global spillovers. Going forward, preserving macroeconomic and financial stability on a durable basis holds the key to reviving India’s tryst with its longer term growth prospects and developmental aspirations, including its emerging role in the global economy.
|