The COVID-19 pandemic is unprecedented in its pan global impact and the toll it is taking on life and livelihood. Public authorities have also responded on a massive scale to contain its fallout and mitigate its deleterious consequences. In India, financial markets have broadly stabilised in response to fiscal and monetary stimulus. Subdued bank credit shows clear signs of risk aversion. Adequate levels of foreign exchange reserves provide a buffer. Nevertheless, there remains some disconnect between financial market optimism and the weakening of the real economy. The pandemic has the potential to amplify financial vulnerabilities, including corporate and household debt burdens in the case of severe economic contraction. Restarting financial sector reforms on their path of convergence with global best practices and standards while adapting to the specific requirements of India’s developmental strategy should regain focus, going forward. Introduction 1.1 Global economic activity has been brought to a standstill by the COVID-19 pandemic, which is turning out to be unprecedented in its pan global impact and the toll it is taking on life and livelihood. Public authorities have also responded on a massive scale with monetary and fiscal stimuli, health care and administrative measures to contain its fallout and mitigate its deleterious consequences. A key objective of the policy response has been to keep financial markets from freezing up, financial intermediaries unstressed and functioning normally, and the lifeblood of finance flowing, especially to the vulnerable and disadvantaged, while preserving financial stability and restoring strong, sustainable and inclusive growth. 1.2 Against this backdrop, this chapter begins with an overview of global macroeconomic and financial market developments. Section I.1 examines specific challenges posed by the pandemic in the form of sudden stops/reversals in cross border flows, asset market volatility and contagion, and commodity market spillovers. Section I.2 discusses corporate sector resilience, and the evolving dynamics of bank and non-bank financial intermediation. The chapter concludes by drawing on the responses received for the systemic risk survey, conducted periodically by the Reserve Bank of India (RBI). I.1 Global Backdrop I.1.1 Macroeconomic Developments and Outlook 1.3 The first signs of the imminent tectonic shifts that COVID-19 would cause became visible when global financial markets turned increasingly volatile in January 2020 with panic sell-offs, flight to safety and wealth erosion in equity markets across advanced and emerging economies alike. Sovereign bond yields fell to record lows and liquidity stress threatened to stall fixed income markets. Incipient weakening of demand was also reflected in commodity price movements, especially of crude oil, though supply disruptions imparted upside pressure on food prices. As the outbreak spread with an explosive suddenness and speed, lockdowns and social distancing halted economic activity across 200 countries with over 14.3 million infections and 0.6 million deaths at the time of going to press. Sharp reductions in GDP growth in advanced economies(AEs) ranging from (-) 3.4 per cent to (-) 14.2 per cent and in emerging markets (EMs) between 2.9 per cent and (-) 6.8 per cent (year-on-year or y-o-y basis) in Q1:2020 have been exacerbated in the ensuing months by a collapse in manufacturing as reflected in purchasing managers’ indices (PMIs), which have plunged into contractionary territory. Although rates of contraction in output, new orders and employment have eased after April, they are still among the lowest levels registered during the survey’s 22-year history (Chart 1.1). Crude oil prices have recovered after sharp falls in March and the first half of April; Brent crude prices traded above USD 40 per barrel on June 30, 2020, up from the lows of April 2020. 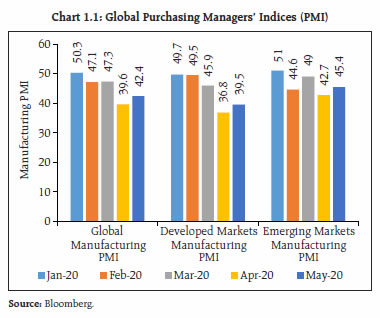 1.4 Meanwhile, according to the United Nations Conference on Trade and Development (UNCTAD), global trade contracted by 7.27 per cent (q-o-q) in value in Q1:2020 and is expected to decline by 27 per cent in Q2 (Chart 1.2). 1.5 In its June 2020 update, the International Monetary Fund (IMF) has projected that global output would contract by 4.9 per cent in 2020, under the baseline assumption of gradual recovery in activity starting in the second half of 2020 (Table 1.1). The OECD has projected a “double – hit” scenario in which a second wave of infections erupts in the later part of 2020; in this scenario, the global economy could contract by 7.6 per cent in 2020. 1.6 Against this backdrop, swift and unprecedented central bank measures have resulted in a turnaround in asset prices, narrowed credit spreads significantly from their earlier peaks and helped improve investor sentiment towards EMs. The pandemic, however, could amplify financial vulnerabilities, including corporate and household debt burdens in the case of severe economic contraction. Globally, banks bracing up for the incidence of bad assets have generally increased their provisions, as a prudential measure. Yet, given the potential adverse impact of asset impairment on banking sector capital and profitability, the Basel Committee on Banking Supervision (BCBS) has endorsed strategies such as forbearance / treatment of moratorium, so long as supervisors make sure that the banks use the flexibility prudently and due disclosures are being made so as to enable market participants to assess the rationale and potential impact of such actions by the banks. In its June 2020 update of Global Financial Stability Report (GFSR), the IMF has warned about tightening of global financial conditions much more than in the baseline scenario. It noted that the recent easing of financial conditions on the back of ‘swift, bold and unprecedented’ policy measures has buoyed up asset prices. Consequently, there is disconnect between financial market optimism and the weakening of the real economy, with sudden risk-on-risk-off shifts in sentiment. This has exposed other financial system vulnerabilities, such as limiting market access for some economies, which are facing refinancing risks. Country authorities have been advised to closely monitor financial vulnerabilities and safeguard financial stability while they engage in repair and revival of the economy. | Table 1.1: Growth Projections | | | 2019 | 2020* | 2021* | | World Output | 2.9 | (-)4.9 | 5.4 | | Advanced Economies | 1.7 | (-)8.0 | 4.8 | | Emerging Market & Developing Economies | 3.7 | (-)3.0 | 5.9 | Note: *Projections.
Source: World Economic Outlook (WEO) Update, June 2020, IMF. | 1.7 Notable amongst potential concerns is that the global economy is more leveraged now than at the time of the global financial crisis (GFC). Global debt has increased across all sectors and stood at USD 255 trillion in Q4:2019. At over 322 per cent of gross domestic product (GDP) (Chart 1.3), global debt is now almost 40 percentage points (USD 87 trillion) higher than it was at the onset of the GFC. The International Institute of Finance (IIF) cautions that if net government borrowing doubles from 2019 levels and there is a 3 per cent contraction in global economic activity (in nominal terms - a bearish outcome relative to the IMF’s projections), the world’s debt pile will surge from 322 per cent of GDP to over 342 per cent in 2020. Thus, in the post COVID-19 world, the challenge will be to engineer a seamless “reverse bail-in” – conversion of financial claims on the real economy into equity. 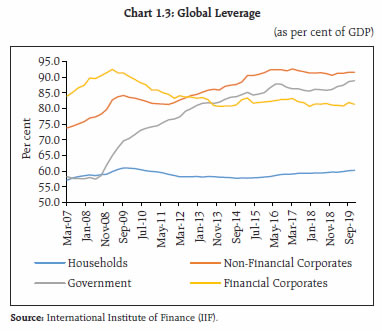 1.8 There has been a major increase in the financial liabilities of emerging markets (EMs) since the GFC: the debt of the 30 major EMs (EM-30) surged from USD 22 trillion in Q4:2007 to USD 71 trillion in Q4:2019. Furthermore, their leverage as a proportion to GDP increased from 147 per cent in Q4:2007 to 220 per cent over the period (Chart 1.4). Foreign currency debt of EM-30 in Q4:2019 reached USD 5.3 trillion of which they will need to refinance USD 0.73 trillion by December 2020. Excluding China, foreign currency debt makes up 20 per cent of EMs’ debt outside the financial sector. By end-2020, global bonds and loans of over USD 20 trillion will fall due for repayment, of which EMs’ share stands at USD 4.3 trillion. I.1.2 Capital Flows and Exchange Rate Volatility 1.9 Cumulative capital outflows since the COVID-19 outbreak are already significantly higher than during GFC and dwarf stress events such as the taper tantrum in 2013 (Chart 1.5); although sentiment has reversed, capital flows are trickling back to EMs albeit with considerable differentiation and reallocation. Any abrupt interruption in capital flows would put EMs at a high risk as their external financing needs are significant in the face of imminent high external debt amortisation. Also, the commodity exporting EMs would face sizeable terms of trade losses. 1.10 Global bond markets are pricing in a prolonged economic slowdown in Europe and a shallow recovery in the US, post the pandemic lockdown. The underlying unease in market sentiment has the potential to cause asset price and exchange rate volatility in EMs, with implication for the real economy. 1.11 Looming over the global financial landscape is the fear of dollar shortage impeding the economic recovery. The October 2019 Global Financial Stability Report highlighted increased cross border portfolio allocation by life insurers in search of yields with a significant share of such assets in USD. Such cross-border portfolio allocation leads to currency and duration mismatches, opening up a new risk transmission channel. The Report also warned that lower for longer yields may prompt institutional investors to seek riskier and more illiquid investments to earn their targeted return. Such risk taking may further lead to build up of financial vulnerabilities among investment funds, pension funds, and life insurers with adverse implication for financial stability. The recent strains in the funding markets on account of runnable money-like liabilities (Table 1.2), necessitated the US Federal Reserve’s (Fed) intervention in the form of repo and swaps. | Table 1.2: US Money Markets | | | Outstanding/ Total Assets
(USD, billion) | Growth, Q4: 2018 - Q4: 2019
(per cent) | Average annual growth
(per cent) | | Total runnable money-like liabilities* | 15,517 | 9.80 | 4.00 | | Uninsured deposits | 5,173 | 6.60 | 10.60 | | Repurchase agreements | 3,998 | 12.50 | 5.90 | | Domestic money market funds** | 3,604 | 18.60 | 4.30 | | Commercial papers | 1,045 | 4.90 | 2.10 | | Securities lending*** | 578 | (-)3.70 | 5.60 | | Bond mutual funds | 4,440 | 16.70 | 9.00 | Note: The data extends through Q4: 2019. Growth rates are measured from Q4 of the year immediately preceding the period through Q4 of the final year of the period.
* average annual growth is from Q4: 2003 to Q3: 2019.
** average annual growth is from Q4: 2001 to Q3: 2019.
*** average annual growth is from Q4: 2000 to Q3: 2019.
Source: Financial Stability Report, May 2020, Board of Governors of the Federal Reserve System. Available at: https://www.federalreserve.gov/publications/files/financial-stability-report-20200515.pdf. | I.1.3 Risk-off Trades and Asset Market Contagion in Emerging Markets 1.12 EM local currency bond portfolio returns are significantly higher relative to September 2018 levels, attributable to extraordinary monetary policy stimulus (Chart 1.6). USD returns have trailed local currency returns in the recent period, raising hedging costs. 1.13 A similar pattern is playing out in the equity portfolio (Chart 1.7). The feedback loop between currency movements and EM flows (reflected in an almost one-for-one correspondence in EM-ETF USD returns and EM equity flows) is, however, being reflected in across-the-board EM asset sell-offs along with sharp EM currency depreciations. Index inclusion may buffer for idiosyncratic risks, but it also entails undesirable volatility in currencies in the wake of sell-offs of EM assets when global spillovers occur. I.1.4 Commodity Market Spillovers 1.14 Meanwhile, amidst sharp pull back in demand, the forward curve for Brent futures has changed from backwardation to contango (Chart 1.8). The April 21, 2020 negative prices reading in West Texas Intermediate (WTI) crude futures point to tight storage conditions but equally benchmark rollover related technical conditions. 1.15 Open interest in Brent options (both Puts and Calls), where calls above the USD 40 strike clearly dominate over puts below a USD 20 strike, implying that the market clearly discounted the possibility of such low crude prices going forward (Table 1.3). | Table 1.3: Brent Options Open Interest | | (as on June 26, 2020) | | | Contracts expiring in | | Sep-20 | Oct-20 | Nov-20 | Dec-20 | | Puts with strike between USD 0 - USD 20 | 13,078 | 4,831 | 1,023 | 34,037 | | Calls with strike greater than USD 40 | 2,59,200 | 60,378 | 25,895 | 4,54,012 | | Source: Bloomberg. | 1.16 In its June 2020 Oil Market Report, the International Energy Agency (IEA) projected global oil demand to fall by 8.1 million barrels/day (mb/d), the largest in history, before recovering by 5.7 mb/d in 2021. In China, oil demand recovered fast in March-April and India’s demand rose sharply in May. On the supply side, record output cuts from Organisation of Petroleum Exporting Countries plus (OPEC+) and steep declines from other non-OPEC producers saw global oil production fall by a massive 12 mb/d in May. To further speed up the market rebalancing, OPEC+ decided on June 6 to extend their historic output cut of close to 10 mb/d through July. 1.17 Demand for industrial metals witnessed severe contraction and their prices have been bearish in the early part of 2020, although the decline is not as severe as that of crude. Unlike oil, where spot market prices are likely to be significantly affected in the short term by inventory overhang, rebalancing in prices for industrial metals is not likely to be susceptible to inventory issues, implying a more robust price rebound if demand rebalances. 1.18 Adverse commodity price shocks can cause financial instability through various channels. First, a decline in commodity prices can impair the ability of commodity exporting countries to meet their international debt obligations, leading to risk-off behaviour affecting EM capital flows as a whole. Second, a contraction in budgetary revenues may induce some of the major commodity exporters to draw down their international balances, potentially impairing international banking sector liquidity. I.2 Domestic Macro-Financial Developments 1.19 On the heels of a prolonged 8-quarter slowdown, GDP growth in India slumped to its lowest level since the GFC to 4.2 per cent in 2019-20, with Q4:2019-20 growth (y-o-y) at 3.1 per cent turning out to be lowest in the history of the current (2011-12 based) GDP series. I.2.1 Recent Macroeconomic Developments 1.20 High frequency indicators point to a sharp dip in demand beginning March 2020 across both urban and rural segments. Domestic economic activity virtually came to a standstill in April 2020; although for several sectors the contraction became less severe from May 2020. Early data arriving for June 2020 indicate some plateauing much below pre- COVID-19 levels. Agriculture and allied activities, however, showed continued resilience on the back of all-time production highs and huge buffer stocks of rice and wheat. Above normal rains predicted for 2020-21 also boded well for agricultural production. PMI (Manufacturing) has also consistently improved from 27.4 in April to 30.8 in May and further to 47.2 in June 2020. For the fiscal year as a whole, there is still heightened uncertainty about the duration of the pandemic. As such, the downside risks to growth remain significant and full restoration in economic activity would be contingent upon the support for robust health infrastructure, recovery in demand conditions and fixing of supply dislocations, in addition to the state of global factors like trade and financial conditions. 1.21 Central Government finances are likely to suffer some deterioration in 2020-21, with fiscal revenues badly hit by COVID-19 related disruptions even as expenditures come under strain on account of the fiscal stimulus. For State finances, the additional burden of lower federal transfers may accentuate downside risks to the outlook. There was a sharp uptick in net borrowings by general government in 2019-20 (Chart 1.9). A number of measures, including enhanced ways and means limits, relaxation of rules governing withdrawals from the Consolidated Sinking Fund (CSF) to ease the redemption pressure on states, and the RBI’s liquidity support measures have so far contained spillovers to bond markets. 1.22 The current account balance turned into a small surplus (0.1 per cent of GDP) during Q4: 2019- 20 on account of lower trade deficit and a sharp rise in net invisible receipts. India’s merchandise exports contracted by 7.6 per cent in H2:2019-20, compared to a contraction of 2.5 per cent in H1. Imports fell by 10.5 per cent in H2:2019-20 after a fall of 5.2 per cent in H1:2019-20 (Chart 1.10). During April-May 2020-21, exports and imports collapsed, with contractions of 47.5 percent and 54.7 per cent (y-o-y), respectively. India’s trade deficit stood at USD 3.1 billion in May 2020, the lowest recorded trade deficit since February 2009. Compared to April 2020, trade deficit narrowed during May with exports in May improving more than imports. 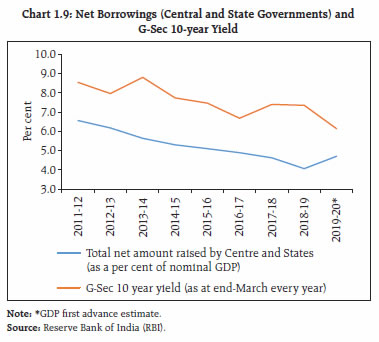
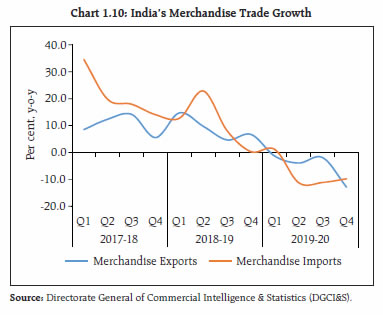 1.23 Foreign portfolio investment (FPI) flows, which registered net inflows up to February 2020, reversed into net outflows since March 2020. During 2019-20, FPIs became net sellers to the tune of USD 3 billion, primarily due to a USD 16 billion sell-off during March 2020 - one of the highest FPI monthly net outflows till date, although FPI flows have shown significant recovery in May and June (Chart 1.11). 1.24 A comparative analysis of portfolio flows to emerging markets vis-à-vis India generally reflects the risk averse behaviour (Chart 1.12). 1.25 In the foreign exchange market, the INR has depreciated relative to peer EM currencies on a year to date basis, although in more recent weeks, it has traded with an appreciating bias and underlying realised volatility has moderated (Chart 1.13). I.2.2 Corporate Sector 1.26 The performance of the private corporate sector deteriorated in successive quarters of 2019- 20 and the contraction during the last quarter was particularly severe due to the COVID-19 pandemic. During the year, nominal sales and net profits of 1,640 listed private non-financial companies declined (y-o-y) by 3.4 per cent [10.2 per cent in Q4:2019-20] and 19.3 per cent [65.4 per cent in Q4:2019-20], respectively, despite the corporate tax rate reduction of September 2019, which brought down the effective tax rate (ratio of tax provision to profit before tax) by nearly 3.0 per cent y-o-y in 2019-20. This poor performance was led by the manufacturing companies, as services sector companies, especially those in the IT sector remained in positive terrain. 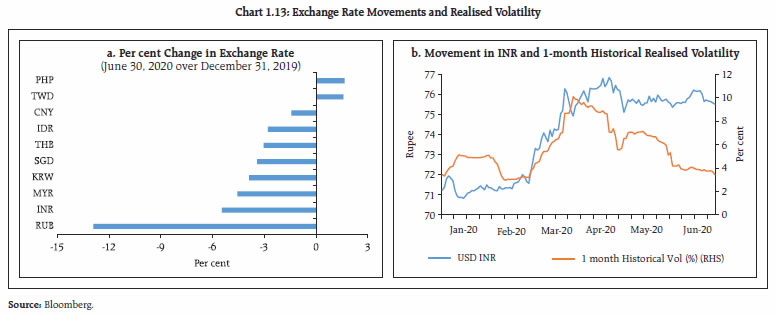 1.27 Deleveraging by the private corporate sector over the recent years stalled during the second half of 2019-20 as leverage ratios (measured by the debt to asset ratio) increased due to higher borrowings1. Incremental borrowings were used towards creating financial assets (loans and advances to subsidiary/ other companies and financial investments) and not for capex formation, as demand conditions remained muted. 1.28 An analysis of a sample of 3,760 listed non-financial firms (68 PSU and 3692 Non-PSU) during 2015-192 shows that Non-PSU companies deleveraged substantively relative to public sector undertakings (PSUs) (Chart 1.14). Notwithstanding this improvement in debt profiles, stagnant operating profit to sales ratios during the period reflect the challenging business environment. The ratio of interest expenses to operating profits for PSUs was lower compared to Non-PSUs. However, despite significant moderation in interest rates, this ratio has remained sticky for both PSUs and Non-PSU companies, indicating interest cost overhang. Both groups also show deteriorating liquidity positions, as measured by the current ratio (Chart 1.14). 1.29 The leverage ratios for a constant sample of 1,488 listed, non-PSU and non-financial firms (Chart 1.15) show that deleveraging among the ‘Others’ category is particularly pronounced, with a correspondingly pronounced deterioration in the current ratio. 1.30 The corporate sector’s credit demand has been modest. Not surprisingly, therefore, SCBs’ credit growth is characterised by a robust but slowing retail credit growth across bank groups, coupled with decelerating wholesale credit growth (Chart 1.16). I.2.3 Loan Moratorium and Bank Credit 1.31 Consequent upon the outbreak of COVID-19 pandemic in India, the RBI had announced regulatory and supervisory measures to inter-alia mitigate the burden of debt servicing and enable the continuity of viable businesses and households. Supervised Entities (SEs) have largely implemented these regulatory relief measures. Nearly half of the customers accounting for around half of outstanding bank loans opted to avail the benefit of the relief measures (Table 1.4). 1.32 Of wholesale credit outstanding3 at the end of March 2020, public sector banks (PSBs) accounted for 62 per cent while private sector banks (PVBs) provided close to 29 per cent. Investment grade borrowers accounted for about 63 per cent of the total credit outstanding; non-government obligors constituted 76 per cent (Chart 1.17). 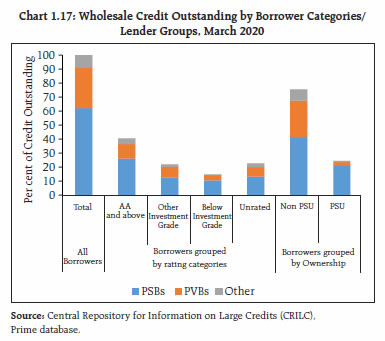 1.33 To place credit growth in 2019-20 in various cohorts in perspective, wholesale credit growth in various borrower categories was analysed over the last 3 years. Among the PSBs, there was a sharp credit contraction across all rating categories except ‘AA and above’ as also among non-PSU obligors. In contrast, PVBs registered positive credit growth across all rating categories and across both PSU and non-PSU obligors, indicating less overall risk aversion compared to PSBs, even as the latter may be trying to improve their risk management practices (Chart 1.18). However, the behaviour of PVBs in the past two quarters is in sharp contrast to their behaviour in the past three years as further analysis ahead shows. 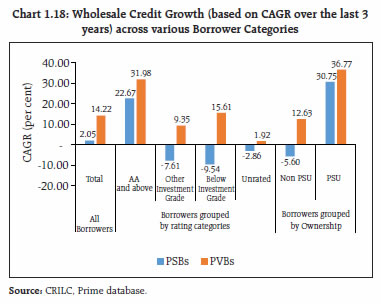
| Table 1.4: Analysis of Loan Moratorium Availed as on April 30, 2020. | | Sector | Corporate | MSME | Individual | Others | Total | | % of total customers | % of total outstanding | % of total customers | % of total outstanding | % of total customers | % of total outstanding | % of total customers | % of total outstanding | % of total customers | % of total outstanding | | PSBs | 28.8 | 58 | 73.9 | 81.5 | 80.3 | 80 | 48.8 | 63.7 | 66.6 | 67.9 | | PVBs | 21.6 | 19.6 | 20.9 | 42.5 | 41.8 | 33.6 | 39.1 | 40.9 | 49.2 | 31.1 | | FBs | 32.6 | 7.7 | 73.3 | 50.4 | 8.4 | 21.1 | 75.8 | 4.8 | 21.4 | 11.5 | | SFBs | 78.8 | 43.7 | 90.5 | 52.3 | 90.9 | 73.2 | 64.6 | 12.3 | 84.7 | 62.6 | | UCBs | 63.4 | 69.3 | 66.5 | 65.5 | 56.8 | 62 | 35.6 | 59.2 | 56.5 | 64.5 | | NBFCs | 39.7 | 56.2 | 60.7 | 61.1 | 32.5 | 45.9 | 37.3 | 41.4 | 29 | 49 | | SCBs | 24.7 | 39.1 | 43.1 | 65.3 | 52.1 | 56.2 | 45.7 | 55.7 | 55.1 | 50 | | System | 30.8 | 41.9 | 45.8 | 65 | 50.4 | 55.3 | 45.7 | 54.6 | 48.6 | 50.1 | | Source: RBI Supervisory Returns. | 1.34 During 2019-20, there was moderation in aggregate credit growth driven by PVBs, reflecting heightened risk aversion as well as muted demand in sluggish macroeconomic conditions (Table 1.5). | Table 1.5: Disaggregated Wholesale Credit Growth (quarter-on-quarter unless mentioned otherwise) | | (per cent) | | | FY:18-19 | Jun-19 | Sep-19 | Dec-19 | Mar-20 | FY:19-20 | | PSBs | 2.61 | -2.58 | -0.33 | -0.91 | 7.13 | 3.08 | | PVBs | 23.79 | -3.15 | 3.82 | 0.25 | 1.37 | 2.19 | | Aggregate | 8.52 | -2.76 | 0.99 | -0.54 | 5.24 | 2.79 | | Source: CRILC. | 1.35 Analysis of credit flow based on ownership revealed that PSU sector was the major recipient. Quarter on quarter flow of credit to non-PSU firms in Q4: 2019-20 was comparable to that in the previous year but PSBs dominated credit provisions in Q4: 2019-20 in contrast to a year ago (Table 1.6). | Table 1.6: Disaggregated Wholesale Credit Growth-based on Ownership | | (q-o-q) (per cent) | | | Dec-18 | Mar-19 | Dec-19 | Mar-20 | | Non-PSU | PSU | Non-PSU | PSU | Non-PSU | PSU | Non-PSU | PSU | | PSBs | -0.96 | 7.35 | -4.34 | 14.83 | -2.03 | 1.84 | 1.38 | 20.78 | | PVBs | 2.36 | 3.73 | 9.38 | 8.41 | -0.70 | 14.17 | -0.89 | 30.15 | | Aggregate | 0.17 | 6.97 | 0.45 | 14.18 | -1.51 | 3.04 | 0.49 | 21.78 | | Source: CRILC. | 1.36 Analysis of credit flow based on rating grades for non-PSU obligors reveals that the rating cohort of AA and above had predominantly accessed credit during Q3 and Q4: 2019-20. The relative lack of access to credit for borrowers rated A and below during this period is common across both PSBs and PVBs. The behaviour of PVBs in respect of rating cohort A and below is in particular contrast to their credit growth profile in 2018-19 (Table 1.7). | Table 1.7: Disaggregated Wholesale Credit Growth in Non-PSU Obligors | | (q-o-q) (per cent) | | | PVBs | PSBs | | Dec-18 | Mar-19 | Dec-19 | Mar-20 | Dec-18 | Mar-19 | Dec-19 | Mar-20 | | AA and above | 3.83 | 6.57 | -0.43 | 5.14 | 2.13 | -0.92 | 0.67 | 7.91 | | A and below | 5.13 | 13.35 | -0.56 | -2.62 | -1.94 | -4.36 | -3.35 | -2.75 | | Unrated | -3.03 | 6.32 | -1.23 | -4.76 | -2.28 | -7.90 | -2.67 | 1.41 | | Source: CRILC, Prime database | 1.37 Analysis based on the days past due (dpd) was undertaken to understand the impact of impairment on credit growth induced by COVID-19. Consistent with previous observations, PVBs show risk averse behaviour in this disaggregation as well, since the only cohort they show positive credit growth in is the unimpaired category in both quarters (Table 1.8). | Table 1.8: Wholesale Credit Growth in various Transition Credit Cohorts | | (q-o-q) (per cent) | | | PSBs | PVBs | | SMA as in March 2020 | Unimpaired as in March 2020 | SMA as in March 2020 | Unimpaired as in March 2020 | | SMA as in December 2019 | 4.7 | 3.2 | -2.9 | -3.7 | | Unimpaired as in December 2019 | 6.5 | 11.2 | -1.4 | 2.4 | Note: Any obligor whose exposure is classified as Special Mention Account (SMA) - 1/2 in any of the lending banks in a given period is labelled SMA exposure. Alternatively, the exposure is labelled unimpaired. Please refer to footnote 7 of Chapter II for further enunciation of SMA categories.
Source: CRILC. | 1.38 An analysis of sectoral allocation of credit shows that sectors with lower credit risk weights have generally dominated credit growth. The central and state PSUs have dominated the credit growth in respect of civil supplies while agriculture and allied services may have been preferred for the priority sector dispensation. Some sectors like generation/ distribution of electricity with relatively lower risk weight and low credit growth may have been experiencing lacklustre demand, though they seem to be picking up recently (Table 1.9). | Table 1.9: Sectoral Credit Growth | | Sector | Growth rate in the last quarter
(per cent) | Growth rate - FY19-20
(per cent) | Average Risk Weight
(per cent)
(as on March 2020) | | Mfg. of fuel products | 49.49 | 29.14 | 47.18 | | Wholesale/Retail services | 11.76 | 8.89 | 104.54 | | Financial Services | 10.20 | 14.07 | 40.80 | | Mfg. Basic Metals and Metal products | 5.27 | -5.25 | 87.66 | | Agriculture & Allied | 4.37 | 1.25 | 121.90 | | Postal, Telecommunication and IT services | 4.10 | 7.61 | 63.90 | | Mining/Oil and gas extraction | 3.31 | -5.93 | 95.92 | | Mfg. of Chemicals, Rubber and Glass | 2.92 | -0.03 | 88.35 | | Mfg. of misc. items | 2.86 | 2.61 | 135.97 | | Generation/Distribution of electricity | 2.84 | -3.87 | 77.39 | | Source: CRILC , Prime database. | 1.39 Analysis of excess liquidity (excess Statutory Liquidity Ratio (SLR) / Liquidity Coverage Ratio (LCR)) of select PSBs4 as also the top-5 PVBs showed that the latter, in general, were not liquidity constrained but were risk averse (Chart 1.19). 1.40 The long-term rating momentum (quarterly upgrades versus downgrades) shows an adverse rating downgrade movement starting in Q3:2018-19 (Chart 1.20). The average risk weights of PSBs and PVBs for their wholesale credit exposures improved from 85 per cent in March 2019 to 81.75 per cent in March 2020, notwithstanding the downward rating momentum. 1.41 A fixed cohort of obligors that was downgraded during April-September 2019 was tracked over a period to look at the evolution of creditworthiness. The incremental delinquency rate of this cohort shows a sharp upward movement in December 2019, implying soft credit conditions even before the pandemic (Chart 1.21). 1.42 The quality of banks’ performing portfolios has implications for credit provisions as also financial stability (Tables 1.10, 1.11 and 1.12). Abstracting from moratorium effects, the share of standard assets (assets with 0 days past due and SMA-0 payment status) in the performing portfolios improved relative to 2017 and 2018. | Table 1.10: SCBs' Performing Portfolios and their Composition | | | Mar-17 | Mar-18 | Mar-19 | Jun-19 | Sep-19 | Dec-19 | Mar-20 | | Standard Asset with 0 dpd and SMA-0 | 85.15 | 86.25 | 95.75 | 94.75 | 94.08 | 94.59 | 93.97 | | Performing but vulnerable (SMA 1/2) | 14.85 | 13.75 | 4.25 | 5.25 | 5.92 | 5.41 | 6.03 | | Source: CRILC. | 1.43 Moreover, the composition of standard assets also shows a relatively larger share of assets rated ‘AA’ and above, implying increasing resilience to shocks (Table 1.11). | Table 1.11: Ratings Distribution of Standard Portfolios of SCBs | | (0 days past due and SMA-0) (as a per cent of the portfolio) | | | Mar-18 | Mar-19 | Jun-19 | Sep-19 | Dec-19 | Mar-20 | | ‘AA’ and above | 39.04 | 45.27 | 45.38 | 46.11 | 45.39 | 47.46 | | Investment grade till rating grade 'A' | 28.55 | 27.41 | 27.23 | 26.49 | 27.17 | 26.04 | | Sub-investment grade | 8.77 | 6.78 | 7.22 | 6.55 | 6.92 | 7.34 | | Unrated | 23.64 | 20.54 | 20.17 | 20.85 | 20.52 | 19.16 | | Source: CRILC, Prime database. | 1.44 The ratings distribution of performing portfolios that are vulnerable (SMA 1 and SMA 2 categories) also throws up ‘AA’ and above as the largest rating grade, implying that not all higher rated obligors are impervious to shocks / risk aversion. I.2.4 Developments in Non-bank Financial Intermediation 1.45 In recent years, mutual funds have generated strong investor appetite, especially among households, as an alternative avenue for financial savings, and this tilt has been shaping the landscape of financial intermediation in India. The net assets under management (AUM) of debt/income oriented mutual fund schemes in India grew by about 70 per cent during 2015-2020 (5 years) to ₹11.80 lakh crore by end-March 2020. Asset management companies, being large net providers of funds to the financial system, impact the funding market in a non-trivial manner. It is in this context that the RBI constituted a special liquidity window for mutual funds (MFs) to mitigate the effects of COVID-19 and to insulate them from the spillovers of the credit risk fund redemption pressures, in the interest of overall financial stability. | Table 1.12: Ratings Distribution of Performing but Vulnerable Portfolios of SCBs (SMA-1 /2) | | | Mar-18 | Mar-19 | Jun-19 | Sep-19 | Dec-19 | Mar-20 | | ‘AA’ and above | 41.89 | 20.72 | 15.65 | 12.79 | 29.38 | 40.44 | | Investment grade till ratings ‘A’ | 26.64 | 24.58 | 17.12 | 24.32 | 20.82 | 13.65 | | Sub-investment grade | 18.54 | 35.29 | 39.84 | 35.21 | 27.05 | 17.54 | | Unrated | 12.92 | 19.41 | 27.39 | 27.69 | 22.76 | 28.37 | | Source: CRILC, Prime database. |
| Table 1.13: Trends in Resource Mobilisation by Mutual Funds (₹ crore) | | Particulars | Oct-19 | Nov-19 | Dec-19 | Jan-20 | Feb-20 | Mar-20 | Apr-June 2020 | | Gross Mobilisation | 14,93,175 | 8,82,234 | 11,50,581 | 11,51,675 | 8,82,288 | 13,12,136 | 26,47,640 | | Redemption | 13,59,693 | 8,27,815 | 12,12,078 | 10,31,527 | 8,84,273 | 15,24,873 | 25,23,561 | | Net Inflows/ Outflows | 1,33,482 | 54,419 | -61,497 | 1,20,149 | -1,986 | -2,12,737 | 1,24,079 | | Assets at the end of Period | 26,32,824 | 27,04,699 | 26,54,075 | 27,85,804 | 27,22,937 | 22,26,203 | 25,48,848 | | Source: Securities and Exchange Board of India (SEBI). | 1.46 Resource mobilisation by MFs suffered from idiosyncratic shocks such as corporate defaults during the second half of 2019-20, with pressure intensifying in March 2020 (Table 1.13). Open ended debt-oriented schemes accounted for net outflows of ₹1,94,900 crore during March 2020. Given this significant volatility, the liquid securities being held in income/debt-oriented schemes are of systemic importance. 1.47 Deployment of debt AUM in government securities as a proportion to total debt AUM has been on an uptrend since March 2019, notwithstanding the dip in March 2020 due to redemption pressure (Chart 1.22). Moreover, the proportion of liquid securities in holdings of debt mutual funds reached an all-time high in April 2020 reflecting risk aversion and liquidity storing. 1.48 Volatility in net asset value (NAV) of three representative schemes shows dislocation in the asset markets induced by the draw down in debt funds in March 2020 (Chart 1.23). Even daily dividend schemes, which are considered relatively risk free, were impacted by the lockdown, as reflected in movements of NAVs. 1.49 There are a few idiosyncratic features of the Indian debt asset management funds which may possibly make such funds more susceptible to runs. The December 2018 edition of the Financial Stability Report (FSR) highlighted the role of non-retail investor dominance in debt funds (in the wake of the IL&FS crisis). Corporates and high net-worth individuals comprise more than 90 per cent of the aggregate assets under management (AUM) for debt funds (Chart 1.24); in sharp contrast, their share in equity funds stands at a more balanced 48 per cent. 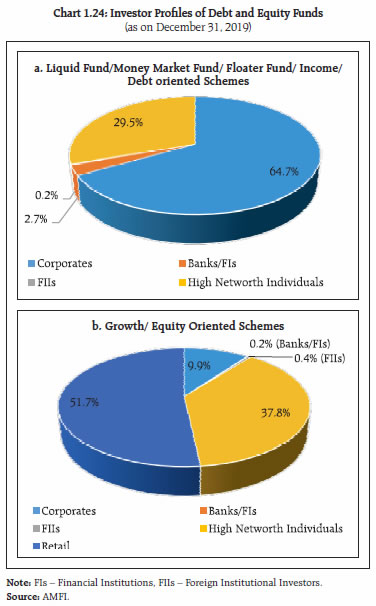 1.50 While expense ratios are capped through regulations, large fund houses have the advantage of spreading their fixed costs over a large AUM to be cost competitive. Hence, corporate dominance in investments may lead to concentration in fund management as smaller fund houses are unable to compete on expense ratios. Between March 2019 and March 2020, the share of the top 5 funds in the total liquid fund corpus increased from 55 per cent to 61 per cent. Moreover, a large fund size is also incentive compatible from an investor point of view, as such funds have significant systemic spill-overs, potentially improving possibilities of bailouts. 1.51 In theory, corporate fleet footedness in terms of exit can be diversified by ensuring that no single investor contributes a disproportionate share of investments to any scheme of a given asset management company (AMC). Extant regulations specify single investor concentration norms for diversifying the investor base. However, when the investor profile is dominated by risk averse investors, as is the case in money market/debt mutual funds, there is a strong possibility of a few corporates distributing their surplus over four/five fund houses and hence exits during times of stress could still be concerted. 1.52 The debt fund management industry is extremely competitive and portfolio performance plays an important role in incremental fund flows. Such behaviour typically masks illiquidity premium as (short-run) excess returns. Excess returns, although substantial, turned negative in the wake of COVID-19 related dislocations (Chart 1.25). Given the recent churn in debt mutual funds, risk appetite of the sector and consequent investment allocation assumes importance. 1.53 Supported by the RBI’s liquidity measures, both Non-Convertible Debentures (NCD) and Commercial Paper (CP) markets are functioning normally notwithstanding the disruption induced by COVID-19 (Charts 1.26 and 1.27).
1.54 CP issuances by financials, however, show a declining tendency, with recent issuances being dominated by non-financial companies (Chart 1.26). 1.55 Ratings dispersion of CPs versus NCDs shows a more varied rating profile in respect of NCDs, notwithstanding their relatively longer tenor of investment, with domination by ‘AAA’/’AA’ rating grades (Charts 1.28 and 1.29).
| Table 1.14: Issuances and Near-term Maturities of CPs and NCDs of Non-financial Non-PSU Obligors | | (₹ crore) | | | Issuances | Maturing | | Mar-20 | Apr-20 | May-20 | Mar-20 | Apr-20 | May-20 | Jun-20 | Jul-20 | Aug-20 | Sep-20 | | ‘AAA’ | 26,100 | 35,865 | 43,310 | 28,044 | 2,732 | 20,225 | 21,840 | 13,820 | 23,354 | 7,026 | | ‘AA’ | 6,440 | 11,064 | 9,720 | 12,928 | 10,312 | 9,789 | 8,337 | 2,747 | 8,176 | 3,631 | | Others | 5,015 | 6,801 | 272 | 9,898 | 12,560 | 3,261 | 7,723 | 6,713 | 1,853 | 6,594 | | Total | 37,555 | 53,730 | 53,302 | 50,870 | 25,604 | 33,275 | 37,901 | 23,279 | 33,383 | 17,251 | | Source: Prime database | 1.56 Near-term maturities in respect of CPs and NCDs show a wide dispersion across rating grades, although maturities in respect of higher ratings dominate (Table 1.14). I.2.5 Housing Market 1.57 With the COVID-19 outbreak, demand and liquidity constraints intensified in the housing sector. House sales and launches, which had declined by 16 per cent and 35 per cent (y-o-y), respectively, during Q3:2019-20 were pulled down by around 26 per cent and 51 per cent, respectively, during Q4:2019-20 (Chart 1.30). 1.58 A nation-wide ebbing of consumer confidence triggered a preference for purchases of completed houses, which adversely affected the sale of under-construction houses. As new house launches plunged, the stock of unsold houses shrank and the inventory overhang (i.e. average number of months required to sell a house) dropped (Chart 1.31). 1.59 Under-construction projects constitute 70- 80 per cent of the unsold inventory. House price growth remained contained in most cities in 2019-20 (Chart 1.32). With the suspension of construction activities across the country from mid-March, completion of under-construction projects is likely to be delayed, constraining new demand. I.2.6 Systemic Risk Survey6 1.60 In the latest systemic risk survey (SRS), all major risk groups viz., global risks, risk perceptions on macroeconomic conditions, financial market risks and institutional positions affecting the financial system were perceived as ‘high’. Within the macroeconomic risks group, risks to domestic growth and the fiscal deficit were perceived to be in the ‘very high’ category, while risks on account of reversal of FIIs/slowdown in FDI, corporate sector vulnerabilities, collapsing real estate prices and household savings were perceived to be ‘high risk’ category. 1.61 About 56 per cent of the respondents opined that the prospects of the Indian banking sector are going to deteriorate considerably in the next one year, as earnings of the banking industry may be negatively impacted due to slow recovery post lockdown, along with lower net interest margins, elevated asset quality concerns and a possible increase in provisioning requirements. The top three sectors identified as adversely affected by the COVID-19 pandemic are: (i) tourism and hospitality; (ii) construction and real estate; and (c) aviation. Their prospects of recovery in the next six months appear bleak. A majority of the respondents opined that higher emphasis on localisation will take precedence over globalisation, going forward, and more regional trade pacts would be preferred. Summary and Outlook 1.62 Overall, there is an unprecedented uncertainty about global growth, though financial markets have broadly stabilised in response to unprecedented fiscal and monetary stimulus. A combination of fiscal, monetary and regulatory interventions in India has kept financial markets from freezing and financial intermediaries functioning normally. Bank credit shows clear signs of risk aversion. Non-bank intermediation, after facing turbulent times, is stabilising as a result of timely and calibrated regulatory interventions. Capital flows are tentatively picking up even as external financing needs remain subdued. Commodity market spillovers, except for oil, remain contained. Adequate levels of foreign exchange reserves provide a buffer. While the uncertainties still remain, restarting financial sector reforms on their path of convergence with global best practices and standards while adapting to the specific requirements of India’s developmental strategy should be the focus, going forward.
|