by V. Dhanya, Gautam and Arjit Shivhare^ India’s commitment to clean energy is anchored around renewable energy sources, though, in the medium run, coal is likely to continue to play a major part. In the fast-changing technological world, the country has followed a multi-prong approach to reduce dependence on fossil fuel, exploring new energy sources like hydrogen and biofuel along with solar and wind power. The shift to clean energy has changed the dynamics in the mining sector with a gradual shift from coal to other critical minerals required to produce renewable energy. The recent global supply chain bottlenecks in the energy sector underscores the necessity of building a cost-effective sustainable and self-sufficient energy system. Introduction The mining sector provides opportunities for economic and social development of an economy, the benefits of which have been different across countries. While some resource-rich countries like Australia and Botswana benefitted from their rich resources, many countries failed to do so, leading to coinage of the term ‘resource curse’. Many reasons were cited for this, the most prominent being the appreciation of the real exchange rate also known as the Dutch Disease syndrome. Recently, renewed interest in sustainable resources and growth following the United Nations Framework Convention on Climate Change (UNFCCC) held in Glasgow, United Kingdom (COP261) has once again brought natural resources to the limelight. As natural resources form the base of both conventional, as well as renewable energy sources, the importance of mineral resources are likely to go up in the case of the latter on sustainability considerations. On the contrary, supply disruptions following the COVID-19 pandemic and geo-political tensions saw deglobalisation and raising concerns of energy security in many parts of the world. Concomitantly, it has also prompted concerns about near monopoly of a limited number of countries for many essential minerals. In this context, natural resources as an input assume importance for the energy security of a country, particularly considering the world’s commitments for sustainable energy sources. India’s transition to net zero emission rests on harnessing renewable energy sources, though in the medium term, coal would continue to play a major role considering the developmental needs of the country. At the same time, sustainable development of renewable energy sources depends on the unhindered availability of mineral resources required for generation of renewable resources. In this study, we examine India’s path to energy security in the backdrop of its commitments to COP26 and its impact on the mining sector for broader energy security. The rest of the article is organised as follows. Section II investigates the major features of COP26 and the status of global warming. It also explains India’s commitments under COP26. Section III explores India’s strategy for achieving net zero emissions and energy security. This section will also make a comparative analysis of strategies followed by various countries in reducing emissions. Section IV examines role of the mining sector in the overall framework of energy security and emission reduction commitments. And Section V concludes with major observations. II. COP26: Commitments and Status COP26 summit saw nearly 140 countries accounting for around 90 per cent of world GDP coming together towards achieving net zero carbon emissions, with India being one of them. The conference put forth ‘new building blocks’ to advance the implementation of the Paris Agreement through actions that can get the world on a more sustainable, low-carbon pathway2. It was the first climate deal to explicitly commit to reducing the use of coal. The pact “Reaffirmed the Paris Agreement on holding the increase in the global average temperature to well below 2 °C above pre-industrial levels and pursuing efforts to limit the temperature increase to 1.5 °C above pre-industrial levels” and “recognised that limiting global warming to 1.5 °C requires rapid, deep and sustained reductions in global greenhouse gas emissions, including reducing global carbon dioxide emissions by 45 per cent by 2030 relative to the 2010 level, and to net zero around mid-century, as well as deep reductions in other greenhouse gases.”3 Carbon dioxide (CO2) forms nearly three-fourth of greenhouse gas (GHG) emissions, and hence reduction in carbon emissions was accorded priority by the Summit. According to (IPCC, 2015) CO2 emissions from fossil fuel combustion and industrial processes contributed about 78 per cent of the total GHG emission increase from 1970 to 2010, with a similar percentage contribution for the period 2000–2010. In the summit, India made a commitment to net zero emissions by 2070. As per India’s commitment to COP26, the country aspires to reduce dependence on fossil fuels. India’s major announcement4 in COP26 includes. -
India will progress towards its non-fossil energy capacity to 500 gigawatts by 2030 -
India will meet 50 per cent of its energy requirements by 2030 with renewable energy -
India will reduce its projected carbon emission by one billion tonnes by 2030 -
India will reduce the carbon intensity of its economy by 45 per cent by 2030, over 2005 levels. -
India will achieve net zero emissions by 2070 Among the various greenhouse gas emitters, energy sector is the major contributor. As per World Resources Institute, energy sector alone contributed to 74.5 per cent of total greenhouse emissions in the world in 2018 within which electricity and heat accounted for 31.9 per cent5. Therefore, a commitment to the reduction of emissions have a direct bearing on the energy sector. A shift to renewable energy is expected to bring-down carbon emission to a large extent. An addition of 100 GW of solar and 60 GW of wind is projected to bring down fuel requirement for coal by 20 per cent and gas by 32 per cent and ultimately reduce CO2 emission by 280 million tonnes (GOI, 2017). Thus, a pre-requisite for achieving net zero emission is a transition towards cleaner energy. Status of Greenhouse Gas Emission Traditionally, developed countries have been the major emitters of greenhouse gases, with industrialisation playing a major role in global warming with economic prosperities. Developing countries like China and India also have emerged as major emitters of CO2 (Karstensen et al., 2020). As of 2021, India is the third largest emitter of carbon dioxide (CO2) in the world after the China and United States (US), emitting 2.7 billion tonnes of CO2 annually. On the other hand, in per-capita terms India’s GHG emission at 1.9 tonnes CO2 per-capita in 2021 is much below the global average of 4.7 tonnes CO2 per person in 2021 (Chart 1). 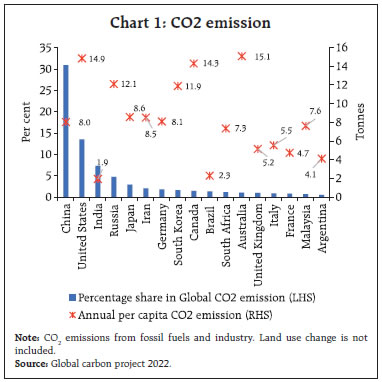 Similar to per capita CO2 emission, India’s carbon emission intensity, measured as the kilograms of CO2 emitted per dollar of GDP, is one of the lowest among major economies (Chart 2). Developed countries, though made a significant improvement in energy efficiency, their high growth phase coincided with high energy intensity. Gains in industrial energy efficiency is the main reason for fall in energy intensity as heavy machinery of manufacturing sector are energy intensive. Further, services sector emerging as the major contributor of GDP has also contributed to fall in emission intensity. India’s emission intensity though has increased over the years, it is lower than most countries and the intensity is also on the decline in recent years (Chart 2). 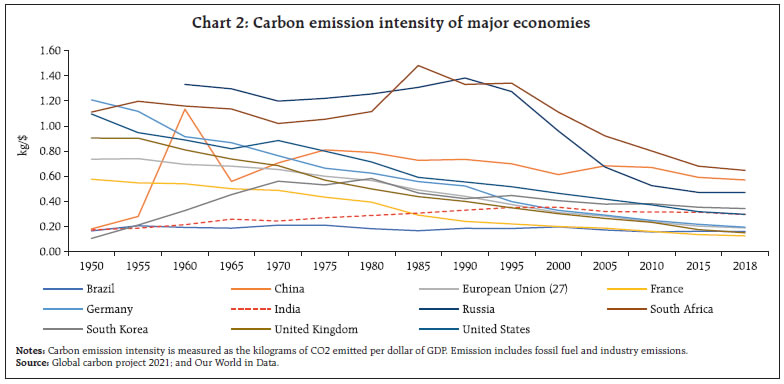 Energy sector is the major emitter of GHG globally. About 80 per cent of global energy needs are met by coal, natural gas and oil within which coal accounts for the major portion. Concomitantly, in terms of emission also, coal has been the major source, accounting for 40 per cent of global CO2 emission. Compared to global average, India’s dependence on coal and emissions from coal are higher (Chart 3a &3b). Emission from coal accounts for 65 per cent of India’s total CO2 emission which is 25 per cent higher than global average. While most countries have recorded a decline in coal usage over the years. China and India have a higher share of coal in their primary energy basket, the former has reduced its share over time. Compared to that India saw marginal rise in the coal’s share in total energy consumption (Chart 4). Coal is the most important fossil fuel in India, it accounts for 55 per cent of India’s energy need which is almost twice as compared to world.
Irrespective of declining share of coal in total primary consumption, China remains the major emitter of GHG from coal use, and its emission from coal increased diabolically after it became part of the WTO in 2001 and increased its share in world manufacturing. India’s emission from coal is also on the rise and is above that of developed as well as other emerging market economies (EMEs) [Chart 5]. Renewables as Major Energy source In the global fight to GHG emission control, renewables play a crucial role. Almost all countries have made ambitious targets for the reduction of fossil fuels anchoring on renewable energy in the COP 26 summit with a significant reduction in the usage of coal (Chart 6). The renewable transition, however, differs across countries, as it depends on geographical location, mineral reserve, technological advancement, etc. For example - renewable transition in Brazil and Canada is led by hydropower, France (Nuclear, and hydro), the UK and Germany (wind and solar), the US (solar, and wind), Italy (solar), and Australia (solar, and wind). Global investment in renewables have far outweighed investment in conventional energy sources. As per World Energy Investment Report 2022, world energy investment is set to rise over 8 per cent in 2022 to reach a total of USD 2.4 trillion, well above pre-COVID (IEA, 2022a). Clean energy investment is expected to exceed USD 1.4 trillion in 2022, accounting for almost three-quarters of the growth in overall energy investment. On the other hand, investment in conventional sources remained below pre-COVID levels and continued to have a downward trend visible since 2015. In India too investment in renewable energy more than doubled in 2021-22 to reach USD14.5 billion6. While the Russia-Ukraine war posed some threats on this path, with many European countries opening many of the closed coal plants, the continued investment in renewable energy sources offers hope to the global emission reduction plans. 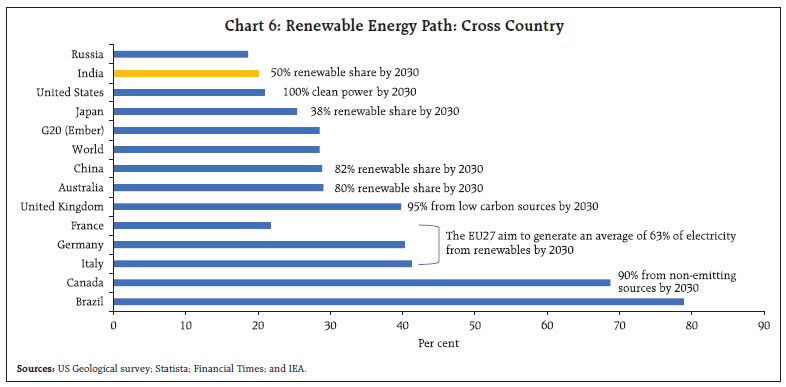 As per World Energy Outlook 2022, global demand for fossil fuels is projected to decline steadily from mid-2020s by around 2 exajoules (EJ) (equivalent to 1 million barrels of oil per day [mboe/d]) every year on average, till (IEA, 2022b). The coal demand is projected to peak in the next few years and oil demand to come down after the mid-2030s. Accordingly, the share of fossil fuels in the total energy supply will come down to less than three-quarters of the total energy supply by 2030 and to around 60 per cent by 2050 from the current 84 per cent. The declining cost of solar PVs, benefitting from technological developments provided renewed vigor to the move towards renewable energy. As per IEA (2022), renewables are expected to grow at an accelerated rate of 85 per cent compared to the previous five years. China’s 14th five-year plan focusing on renewables, REPowerEU plan, US Inflation Reduction Act, and India’s push to renewables are cited as the main drivers of this growth. III. Strategies for Emission control Achieving energy transition to meet climate goals requires concerted efforts from various stake holders, and a balanced approach. The global pathways for achieving net zero emissions follows a holistic approach encompassing energy efficiency measures, behavioural changes, electrification, renewables, hydrogen and hydrogen-based fuels, bioenergy and Carbon Capture, Utilisation and Storage (CCUS) [IEA, 2021]. Thus, in addition to shifting away from carbon emitting fossil fuel-based energy, the paradigm shift also depends on reducing energy usage harping on energy-efficient technological advancements as well as behavioural changes by the consumers. In India too, emission reduction strategies have largely followed the same paradigm. India’s long-term transition to low emission rests on seven pillars focusing on low carbon electricity, transport and industrial system, energy-efficient urban design, innovative technology for carbon removal, enhancing forest cover and low-cost climate finance (GOI, 2022). Compared to developed countries, which have already witnessed a significant reduction in coal usage, the success of India’s commitments would also require efficient use of thermal sources, at least in the short to medium term. India’s energy consumption basket is heavily skewed towards coal compared to the more diversified one globally, partly reflecting the domestic availability and large investments in thermal power. Globally, share of coal in total energy mix is less than one third, while in India it stands at 55 per cent. Developed countries have reduced their dependence on coal by largely moving towards natural gas and oil. Gas accounts for roughly one-third of the share in primary energy consumption in US and one-fourth share in European Union. However, India’s consumption basket saw little change with the share of coal remaining stable around 55 per cent since 1990. In India, consumption of natural gas is meagre as compared to the global average and is one of the lowest in the world - only 6.5 per cent in primary energy generation, due to low natural gas reserves. Low-emission sources account for 40 per cent of global electricity generation with 30 per cent coming from renewables and 10 per cent coming from nuclear energy (IEA, 2022). In the coming years, globally, electricity generation from renewables, particularly from solar and wind are expected to increase. While India primarily targets renewable energy for emission control, achievement of net zero by 2070 would depend a lot on reducing emissions from conventional energy sources. India has made significant strides in renewable installed capacity with its share in total installed capacity at 41.3 per cent (including large hydro) in March 20237 (Chart 7). However, its share in electricity generation is low at 22.8 per cent. 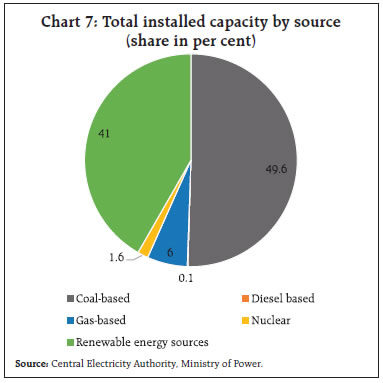 While initiatives towards grid connectivity and smoothening of supply mismatches are being made, in the short to medium term, conventional sources would continue to play a major role. As per energy security scenarios8, even a maximum clean and renewable energy pathway would continue to have a higher share of coal in the total energy supply accounting for 35.8 per cent of the total energy supply in 2047 (Chart 8). Accordingly, India’s emission control strategy to a great extent depends on reducing carbon emissions from coal usage through technological advancement. Thus, the strategies are focused on renewables along with the emission reducing technologies in the conventional energy segment (Figure 1). 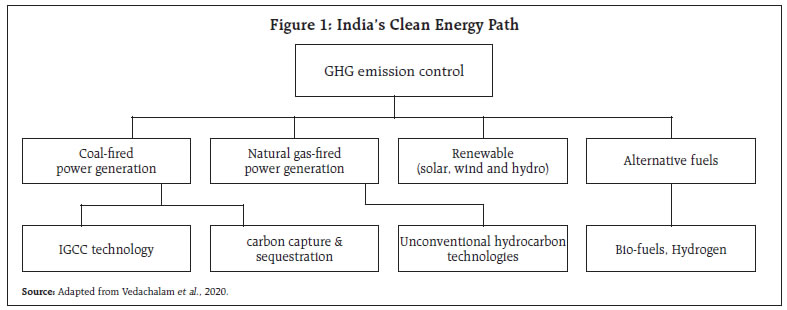 India’s broader developmental goals require efficient use of conventional energy sources, particularly thermal energy where India has a natural advantage. India hosts roughly 7 per cent of global coal reserves and with the current rate of usage, India has reserves that can last more than a century (Vedachalam, Ramadass, & Atmanand, 2020). The emission of CO2 happens during the combustion of coal to thermal energy. By adopting alternative technologies like Integrated Gasification Combined Cycle (IGCC) technology, where coal is converted into fuel gas, CO2 emissions can be reduced to a large extent. IGCC systems can improve power generation efficiency by approximately 15 per cent and reduce CO2 compared to conventional coal-fired thermal power systems9. While initiatives of adapting the IGCC system started in the 2000s itself, large-scale adaptation of it in India is still in the offing. India is aiming for 100 million tonnes of gasified coal by 2030. The resultant fuel gas can yield gaseous fuels like hydrogen, methanol, and ethanol. Another clean coal technology that is being explored is Carbon Capture and Sequestration (CCS) which collects CO2 and stores it away deep underground. The government has waived the inter-state transmission charges for energy storage projects which are commissioned before June 2025. The government is also working on the National Energy Storage Policy to tackle the bottlenecks facing the industry. An alternative to high-emission electricity is low-emission fuels like biofuels and green hydrogen. In India, efforts are being made in this direction as it has a crucial role in attaining the net zero objective with green hydrogen alone has the capacity to abate 400 million tonnes of CO2 by 2050 (Birol et al., 2022). It is estimated that the country has a great potential to become a significant player in green hydrogen as green hydrogen with renewable batteries and other low – carbon technologies can create market worth up to USD 80 billion in India by 203010. India’s refineries and fertiliser sector alone can create demand for 5 million tonnes of green hydrogen, resulting in 28 million tonnes of carbon dioxide abatement. Projects are being launched in India to tap its green hydrogen production. In April 2022, ReNew Power (an Indian renewable energy developer) announced its joint venture with Indian Oil Corporation and Larsen and Toubro (engineering and construction major) for developing green hydrogen projects in a time-bound manner. An MoU worth USD 7 billion was signed between ACME (Indian renewable energy developer) and the Karnataka government to generate 1.2 million tonnes a year of green hydrogen by 2027, through integrated solar to green hydrogen to green ammonia facility. While various alternative sources of energy are explored, India’s path to net zero achievement is heavily weighted towards renewable energy sources. | Table 1: Projections in Installed Capacity | | Energy Sources | Installed Capacity in GW | Share in Installed capacity | Projected Annual Growth | | Feb-23 | 2030 | Feb-23 | 2031-32 | | Fossil Fuel | 230 | 292 | 55.8 | 35.7 | 3.4 | | of which | | | | | | | Coal | 204 | 244 | 49.5 | 29.9 | 2.3 | | Non-fossil fuel | 176 | 525 | 42.7 | 64.3 | 16.9 | | of which | | | | | | | Renewable Including Hydro | 169 | 500 | 41.0 | 61.2 | 16.8 | | Total Installed capacity | 412 | 817 | 100 | 100 | 10.3 | | Source: Author calculations based on CEA data. | As per CEA projections, renewable energy should grow at a compound annual growth of 16.8 per cent in the remaining seven years to arrive at 500 GW capacity by 2030. Given that, the large hydro segment has reached a point of stagnation, the future growth of renewable segment is expected to come from solar, wind and other renewable energy sources. In the past five years till the pandemic i.e., upto 2019-2011, the renewable sector (excluding hydro) has witnessed an annual average capacity growth of 23.0 per cent which is in line with the required growth. Nevertheless, while the share of coal will be coming down, it will continue to play a major role given the development requirements of the country (Table 1). In the following section we explore how India’s mining sector is adaptable to the changing energy requirements. IV. Impact on Mining Sector Mining sector in India contributed to 2.3 per cent of GDP, 10.4 per cent of Industrial GVA and provided direct and indirect employment to about 1.10 crore people in 2020-21. India has one of the largest reserves of metallic, non-metallic, fuel and minor minerals in the world. India has the fifth-largest reserve of coal and iron ore in the world. Of the total mining output, fuel minerals including coal, petroleum, and natural gas accounted for 53.8 per cent of total output followed by metallic and non-metallic minerals at 28.2 per cent, and minor minerals contributed to only 18 per cent of mining output. India’s commitment to climate change has a direct bearing on mining sector-first through its impact on coal mining and secondly from the demand arising for critical minerals required for renewable energy sources. With the increase in the share of renewable sources, average amount of minerals required for a new unit of power generation capacity has increased by 50 per cent (IEA, 2022) Generating one terawatt-hour of electricity from wind and solar could consume two time and three time more metals as compared to gas based power plant, respectively (Azevedo et al., 2022). For example, an onshore wind plant requires nine times more mineral resources than a gas-fired plant (IEA, 2022). Similarly, requirement for minerals is higher in solar PV compared to conventional energy sources. For Wind turbines, Zinc, Manganese, Rare-earth material are crucial (Balaram, 2019). For Solar Photo voltaic modules, Silicon is a critical mineral apart from Copper and Zinc (chart 9a). Electric vehicles are therefore, more than four times mineral intensive than a traditional car (Chart 9b). An electric car requires more minerals, such as Lithium, Nickle, Graphite, Manganese, Cobalt, Rare-earth material, among others. Future requirements of EV and battery storage infrastructure is expected to increase demand for Lithium by over 40 times by 2040, and by about 25-30 times for Graphite, Cobalt and Nickel. Alternate sources of energy, such as fuel cells is expected to push the demand for Platinum group materials; for Hydrogen, demand for Nickel is expected to rise, and for electrolysers demand for Zirconium is expected to increase. 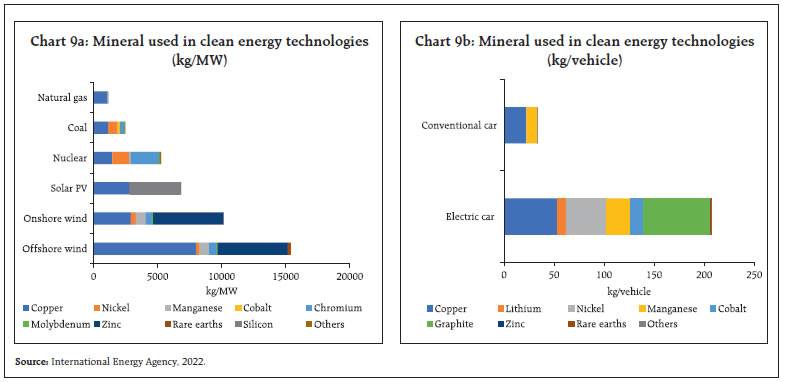 According to (IEA, 2022), mineral requirements for clean energy technologies are set to rise by two to four-fold by 2030, with demand of Lithium increasing by 40 times, Nickel and Cobalt increasing by 20-25 times and demand for Manganese and Rare Earth materials growing by 5-10 times in sustainable development scenario12 (SDS) (Chart 10). Thus, a move towards renewables does not undermine the importance of mining sector. In fact, it increased the potential of the sector and thus making it more diversified. The minor minerals which had contributed to only 18 per cent of India’s mining output would assume more importance in the coming years. 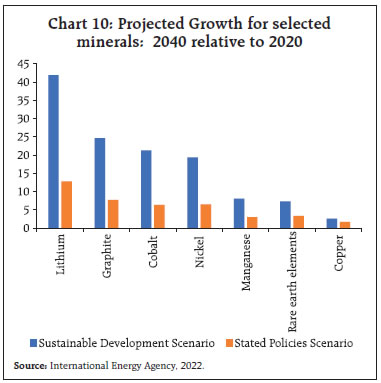 While India had abundant coal reserves, the same cannot be said about the minerals required for a clean energy transition. With the rise of RE share in total generation, shift towards EV, battery storage infrastructure demand of critical minerals has increased. India is currently dependent on imports for many of these critical minerals. These critical minerals are geographically concentrated to few locations as compared to coal, petroleum, and natural gas. In terms of global reserve, the top three countries share more than half of total global reserve of these critical minerals (Appendix table 1). Due to high capital expenditure and complex technology required, the production share of these critical minerals is highly skewed towards a few countries (Chart 11). More than three-fourth of lithium, cobalt and rare-earth elements are concentrated in top three producing countries. Further, refining and processing of these minerals require huge capital expenditure, where China has the early-starter advantage. China’s share of refining/processing is about 90 per cent for Rare earth materials, 50-70 per cent for Lithium and Cobalt, 40 per cent for copper and around 35 per cent for Nickel. India is dependent on China for import of photovoltaic modules. At present more than 80 per cent of solar panels and modules are imported, primarily from China. Australia shares nearly half of global Lithium production and South Africa shares 43 per cent of global Chromium production in 2021 (Appendix table 1). 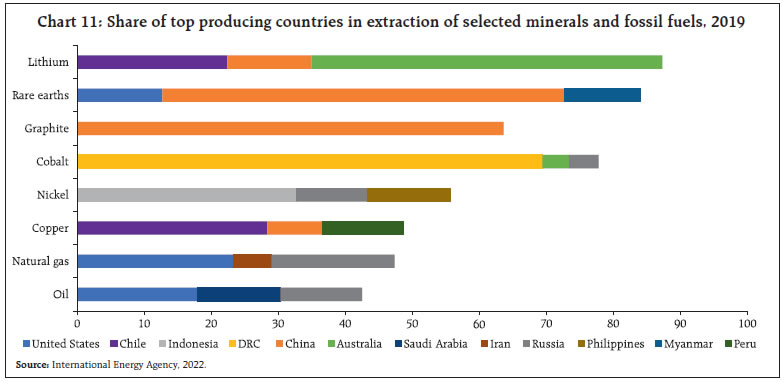
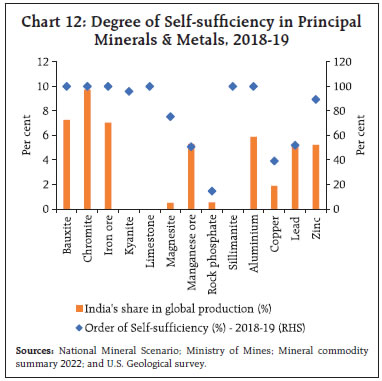 India’s share in global reserve of these critical minerals are low except for Chromium (17.5 per cent) and silicon (abundant). India accounts for around 5-6 per cent of global rare earth material stock, 3.64 per cent of Zinc reserve and around 2-3 per cent of global Copper and Manganese reserve. At the current demand level, India has near self-sufficiency in minerals such as Bauxite, Chromite, Iron ore, Aluminum, Zinc and Copper. However, India is deficient in Manganese ore, Graphite, Rare earth material, Lithium, Kyanite, etc. for which import dependency is indispensable. Even in minerals near self-sufficiency is achieved, future constraints may arise as impetus on clean energy increases. Huge capital expenditure is required for extraction and production of these minerals, and efforts towards this needs to be taken on a priority basis. Further, strategic acquisition of these minerals also needs to be taken up to ensure a stable supply for meeting the emerging demand (Chart 12 and Appendix Table 2). V. Summary and Conclusion India’s commitment to clean energy is anchored around renewable energy sources, though, in the medium run, coal is likely to continue to play a major part. In the fast-changing technological world, the country has followed a multi-prong approach to reduce dependence on fossil fuel, exploring new energy sources like hydrogen and biofuel along with solar and wind power. With the move towards clean energy, India’s reliance on mining sector has to shift from coal to other essential minerals for production of renewable energy. Present clean energy technologies are mineral intensive, supply of which is concentrated in a few countries. Supply chain disruptions during COVID-19 pandemic and subsequent Russia-Ukraine war raised concerns on import dependence on critical minerals. The government is in the process of forming various strategic alliances with mineral-rich countries. India is working with lithium and cobalt producing countries like Argentina, Bolivia and Chile. In collaboration with Australia, it has undertaken projects for lithium and cobalt mineral assets identification. The Quad grouping of India, Japan, USA and Australia has introduced a “Critical and Emerging Technology” working group which focuses on supply chain security for critical minerals. India and Japan have entered into an agreement to develop rare earths, which are used in manufacturing of several high-tech goods (Indian minerals yearbook 2019). Indian Rare Earth Limited (IREL) is working on Rare Earth Permanent Magnet (REPM) plant to manufacture samarium-cobalt magnets required in Defense and space sector. A second approach is to reduce import dependence for these critical minerals. Accordingly, various companies are investing in those clean energy technologies that do not require these rare earth minerals. Efforts are made to produce battery chemistry which uses inexpensive, abundant, and sustainable minerals such as calcium ions, sodium ions, aluminum ions etc. Hydrogen fuel cell electric vehicles (FCEVs) also has the potential for greater use in future due to its high energy content per unit of weight. Advancement in battery technologies is expected to further accelerate the move towards non-fossil fuel in a more sustainable way. Initiatives such as introduction of the Faster Adoption and Manufacturing of Hybrid and Electric vehicle (FAME) scheme, Production Linked Incentive (PLI) scheme for ‘National Programme on Advanced Chemistry Cell battery storage, tax breaks with an aim to promote battery infrastructure aims to reduce import dependence on key inputs. Keeping the interest of energy security of India in mind, coal mining may be significant in the medium term. However, in the long term, it is desirable to shift towards renewables where technological innovations aided by superior manufacturing processes and designs in which fewer or no critical minerals are required. Efforts towards this are taken up globally like the Advanced Research Projects Agency-Energy (ARPA-E) of the United States which introduced Rare Earth Alternatives in Critical Materials (REACT) program (Grainger, 2022). Further, the achievement of COP-26 commitments depends to a large extent in adopting energy-efficient mechanisms following behavioral changes in energy usage. The recent supply chain bottleneck has brought to forefront the importance of energy security across the world. It also underscores the requirement of building a cost-effective sustainable energy transition and more importantly a self-sufficient energy system. References Azevedo, M., Baczynska, M., Bingoto, P., Callawa, G., Hoffman, K., & Ramsbottom, O. (2022). “The raw-materials challenge: How the metals and mining sector will be at the core of enabling the energy transition”. Balaram, V. (2019). “Rare earth elements: A review of applications, occurrence, exploration, analysis, recycling, and environmental impact”. Geoscience Frontiers, 10(4), 1285–1303. Birol, F., & Kant, A. (2022). “India’s clean energy transition is rapidly underway, benefiting the entire world”. International Energy Agency. BP (2022). “BP Statistical Review of World Energy 2022”. GOI, Ministry of Environment, Forest and Climate Change (2022). “India’s Long-Term Low-Carbon Development Strategy”. Government of India. GOI, Central Electricity Authority (2020). “Report on Optimal generation capacity mix for 2029-30”. Government of India. Grainger T. (2022). “The rare earth problem must be solved by innovating, not just playing catch up”. Ritchie, H., Roser, M., & Rosado, P., (2020). “CO2 and Greenhouse Gas Emissions”. OurWorldInData.org. GOI (2017).“Greening the Grid”. National Renewable Energy Laboratory & Ministry of Power. IEA (2021). “Net Zero by 2050: A Roadmap for the Global Energy Sector”. International Energy Agency. IEA (2022a). “World Energy Investment Report 2022”. International Energy Agency. IEA (2022b). “World Energy Outlook 2022”. International Energy Agency. IPCC (2015). “Summary for Policymakers. In Climate Change 2014: Mitigation of Climate Change: Working Group III Contribution to the IPCC Fifth Assessment Report” (pp. 1-30). Cambridge: Cambridge University Press. doi:10.1017/CBO9781107415416.005 Karstensen, J., Roy, J., Pal, B. D., Peters, G., & Andrew, R. (2020). “Key Drivers of Indian Greenhouse Gas Emissions”. Economic & Political Weekly, 46-53. USGS(2022). “Mineral Commodity Summaries 2022”. United States Geological Survey. IPCC (2021). “Summary for Policymakers. In: Climate Change 2021: The Physical Science Basis. Contribution of Working Group I to the Sixth Assessment Report of the Intergovernmental Panel on Climate Change”. Vedachalam, N., Ramadass, G., & Atmanand, M. (2020). “Review on the Role of Hydrocarbon Resources in India’s Energy Security and Climate Goals”. Geological Society of India, 95, 561-565.
Appendix Table 1: Top Countries having reserves and production of selected minerals
(percentage share in global reserves and production) | | Coal | Cobalt | | Reserve | Production | Reserve | Production | | United States | 23 | China | 50.8 | DR Congo | 48.2 | Congo (Kinshasa) | 68.4 | | Russia | 15 | Indonesia | 9.0 | Australia | 18.1 | Indonesia | 5.3 | | Australia | 14 | India | 8.0 | Indonesia | 7.2 | Russia | 4.7 | | China | 13 | Australia | 7.4 | Cuba | 6.0 | Australia | 3.1 | | India | 10 | United States | 7.0 | Philippines | 3.1 | Canada | 2.1 | | Natural gas | Graphite | | Reserve | Production | Reserve | Production | | Russia | 25.5 | United States | 23.6 | Turkey | 27.3 | China | 65.4 | | Iran | 21.9 | Russia | 17.7 | Brazil | 22.4 | Mozambique | 13.1 | | Qatar | 16.9 | Iran | 6.5 | China | 15.8 | Madagascar | 8.5 | | Turkmenistan | 9.3 | China | 5.3 | Madagascar | 7.9 | Brazil | 6.7 | | United States | 8.6 | Qatar | 4.5 | Mozambique | 7.6 | Korea, Republic of | 1.3 | | Lithium | Rare rath material | | Reserve | Production | Reserve | Production | | Chile | 35.8 | Australia | 46.9 | China | 33.8 | China | 70.0 | | Australia | 23.8 | Chile | 30.0 | Vietnam | 16.9 | United States | 14.3 | | Other countries8 | 12.7 | China | 14.6 | Brazil | 16.2 | Australia | 6.0 | | Argentina | 10.4 | Argentina | 4.8 | Russia | 16.2 | Burma | 4.0 | | China | 7.7 | Brazil | 1.7 | India | 5.3 | Thailand | 2.4 | | Copper | Chromium | | Reserve | Production | Reserve | Production | | Chile | 21.3 | Chile | 23.6 | Kazakhstan | 41.1 | South Africa | 43.9 | | Australia | 10.9 | DR Congo | 10.0 | South Africa | 35.7 | Turkey | 16.8 | | Peru | 9.1 | Peru | 10.0 | India | 17.9 | Kazakhstan | 15.9 | | Russia | 7.0 | China | 8.6 | Turkey | 4.6 | India | 10.2 | | Mexico | 6.0 | United States | 5.9 | Finland | 1.5 | Finland | 5.6 | | Nickel | Zinc | | Reserve | Production | Reserve | Production | | Australia | 21 | Indonesia | 48.5 | Australia | 27.5 | China | 38.7 | | Indonesia | 21 | Philippines | 10.0 | China | 17.5 | Peru | 14.7 | | Brazil | 16 | Russia | 6.7 | Russia | 8.8 | Australia | 12.0 | | Russia | 7.5 | New Caledonia9 | 5.8 | Mexico | 7.6 | India | 7.5 | | United States | 7.37 | Australia | 4.8 | Peru | 7.6 | United States | 6.8 | | Manganese | Silicon | | Reserve | Production | Reserve | Production | | South Africa | 37.6 | South Africa | 36.0 | China | 68.2 | abundant | | China | 16.5 | Gabon | 23.0 | Russia | 7.3 | | Australia | 15.9 | Australia | 16.5 | Brazil | 4.5 | | Brazil | 15.9 | China | 5.0 | Norway | 4.1 | | Ukraine, concentrate | 8.2 | Ghana | 4.7 | United States | 3.5 | | Sources: Mineral commodity summary 2023, U.S. Geological survey; and BP Statistical Review of World Energy 2022. |
| Appendix Table 2: India's Share in Global Production and Global Reserve of Critical Minerals | | (in per cent) | | | Production share (2021) | Reserve share | | Chromium | 7.3 | 17.5 | | Copper | 2.28 | 2.0 | | Graphite | 0.65 | 2.5 | | Manganese | 3.0 | 2.3 | | Rare earth material | 1.0 | 5.8 | | Silicon | 0.7 | abundant | | Zinc | 6.2 | 3.64 | | Sources: National Mineral Scenario; Ministry of Mines; and Mineral commodity summary 2022, U.S. Geological survey. |
|