India is emerging as a preferred destination for foreign direct investment (FDI), half of which is in the manufacturing sector in market value terms, as per the latest census on foreign liabilities and assets (FLA)1 of Indian direct investment (DI) companies. India’s FDI stock was nearly four times its outward direct investment (ODI). With strong cross-border trade linkages, both Indian and foreign cross-border subsidiaries recorded good business growth during 2016-17. Information and communication continued to be the largest export-oriented sector among foreign subsidiaries in India. Equity valuation gains, though varying across economic sectors, have been sizeable. 1. Introduction Direct investment (DI) is a core component of cross-border capital flows, reflecting non-resident investors’ lasting interest in the host economy. Quantitatively, DI is typically associated with control (50 per cent or more equity share) or a significant degree of influence (10 per cent or more equity share) over the management of the recipient enterprise. A direct investor can be an individual, a group of related individuals, an incorporated or unincorporated enterprise (public or private), a group of related enterprises, government, trusts or other organisations that own enterprise(s). The effects of foreign direct investment are found to be diversified but dependent on recipient economy’s absorptive conditions, including its institutional set up, and the degree of complementarity and substitution between domestic and foreign investment (Benassy- Quere et al, 2007; Economou et al, 2016). It promotes economic growth by supporting industrial activity and employment through transfer of technology and physical capital while also stimulating domestic investment (Bosworth and Collins, 1999; Alfaro, 2017). It also fosters global trade and facilitates integration into the global economy more successfully than other modes of capital flows (Frankel and Romer, 1999; Moran, 2016). Since DI flows are components of country’s balance of payments (BoP), the International Monetary Fund (IMF) has focused on improving the availability and timeliness of cross-border investment data, which inter alia include the coordinated portfolio investment surveys (CPIS) and the coordinated direct investment surveys (CDIS)2. They are designed to improve the availability and quality of comparable cross-border portfolio and direct investment data, both overall and by immediate counterpart economy. The CDIS was launched in 2009 and the second phase of the G-20 Data Gap Initiative (DGI-II) of 2015 recommends participation of G-20 economies in the effort. Since 2011, the Reserve Bank has mandated an ‘annual return on foreign liabilities and assets (FLA)’ for Indian companies that have received FDI and/or made direct investment overseas in the previous year(s) including the latest year3. The FLA census provides comprehensive information on market value of foreign liabilities and assets of Indian companies arising on account of foreign direct investment (FDI), overseas direct investment (ODI) and other investments, which are used as inputs in the compilation of BoP, CPIS, CDIS, international investment position (IIP) statistics and foreign affiliates trade statistics (FATS)4. This article presents the major findings of the 2016-17 round of the census on foreign liabilities and assets (FLA) covering 17,020 companies of which 15,169 companies (including foreign subsidiaries) reported inward investment. It provides estimates of inward and outward direct investment position at face value and market value and country / sector profile as well as aggregate and sector-wise sale / purchase (both domestic and overseas) of Indian and foreign subsidiary companies under FATS along with some cross country comparisons. The remainder of this article is organised into five sections: A snapshot of global cross-border direct investment including India’s position is presented in section 2. Foreign liabilities and assets of Indian DI companies reported in the census are summarised in section 3 focusing on coverage, level of investment at face value and market value, sectoral composition, sources and destinations and composition of other investments. The key features of FATS are presented in section 4. Section 5 summarises the main takeaways and concludes the article. 2. Global Cross-border Direct Investment In the CDIS for 2016, 105 countries reported inward DI whereas 79 countries reported outward DI. The Netherlands, USA and Luxembourg were the top three DI source as well as destination countries: together they accounted for 37.7 per cent of inward investment and 49.4 per cent of outward DI at market value. Among other major countries, Japan’s outward DI was nearly seven times of its inward DI (Chart 1). This ratio was also high for France, Germany and Switzerland. With a share of 1.2 per cent in total investment reported under the CDIS, India was the 19th largest recipient of DI, whereas it stood 33rd among DI source countries (0.3 per cent share) (Chart 2). 3. Foreign Liabilities and Assets: Census Results Under each round of the FLA census, DI companies report data for the preceding two financial years. Any comparison of the results across census rounds, therefore, needs to take into account the coverage in each round and this would change due to: (a) addition/deletion of DI companies during the year and (b) improvement in reporting compliance. 3.1 Coverage Under the 2016-17 census round, 18,667 companies responded5, of which 17,020 companies had outstanding FDI / ODI in their balance sheet as on March 2017 as stated earlier (Table 1). An overwhelming majority of these companies (85.6 per cent) reported only inward FDI and others reported ODI or bi-directional investment. FDI reporting companies had share of 78 per cent of FDI in the total equity of these companies and foreign companies had majority equity stakes in over 80 per cent of them. | Table 1: FLA census 2016-17: Coverage | | (Number of companies) | | Category | Types of Company | Direct Investment | | Both Inward & Outward | Only Inward | Only Outward | Total | | | Foreign Associate in India | 255 | 2,371 | - | 2,626 | | Unlisted Companies | Foreign Subsidiary in India | 237 | 11,888 | - | 12,125 | | Others | - | 135* | 1,411 | 1,546 | | Total | 492 | 14,394 | 1,411 | 16,297 | | Listed Companies | Foreign Associate in India | 68 | 96 | - | 164 | | Foreign Subsidiary in India | 32 | 87 | - | 119 | | Others | - | - | 440 | 440 | | Total | 100 | 183 | 440 | 723 | | Grand Total | 592 | 14,577 | 1,851 | 17,020 | | * include Limited liability partnerships (LLPs), Special purpose vehicles (SPVs) and public-private partnerships. |
3.2 Inward and Outward Direct Investment The FLA census collects data on both face value and market value of equity capital. Shares of listed companies are valued at market price on the closing date of the reference period (i.e., end-March). A large number of the FDI reporting companies (around 98 per cent, with 49.7 per cent share in total FDI) were unlisted and they were advised to use the ‘own fund of book value (OFBV)’ method for market valuation of equity6. The market value of the FDI stock (including investment flows and valuation changes) increased by 9.7 per cent during 2016-17 and stood at ₹23,387 billion (USD 360.7 billion) in March 2017 of which nearly 94 per cent was held as equity (Chart 3). On the other hand, the stock of ODI declined by 9.8 per cent during the year to ₹ 5,411 billion (USD 83.4 billion). Inward FDI has witnessed average annual growth of 14.3 per cent since 2012-13, the year from which comparable census data are available. The divergence between the growth in inward and outward direct investment contributed to decline in the ratio of outward to inward direct investment after 2013-14. In March 2017, FDI in India was more than four times of its ODI at market value (Chart 4). 3.3 Sector-wise Distribution of Inward Direct Investment The manufacturing sector held 42.3 per cent of the face value of total FDI (50.2 per cent at market value), with the motor vehicles group holding the highest share, followed by food products and machinery and equipment. The services sector had a share of 47.8 per cent at face value (40.7 per cent at market value). Non-financial companies accounted for nearly 87 per cent of the total FDI equity at face value in March 2017 (Table 2). Information and communication services and financial and insurance activities were the major FDI attracting services. The sector wise composition of FDI at market value is presented in Annex 1. Changes in investment stocks at market value over a period are influenced by inflows/outflows, reinvestments/losses as well as valuation changes. The sectors that attracted higher FDI also made more valuation gains: the top ten FDI receiving sectors accounted for 36.6 per cent of FDI equity at face value but 53.5 per cent of FDI equity at market value (Chart 5). | Table 2: Sector-wise Equity Participation of FDI Companies: March 2017 | | (₹ billion at face value) | | Activity | Total Equity
(Resident and Non-Resident) | FDI Equity Stake | | 1. Agriculture-related, Plantations and Allied activities | 10.3 | 8.5 | | 2. Mining | 40.3 | 23.5 | | 3. Manufacturing | 2,207.8 | 1,872.9 | | 4. Electricity, gas, steam and air conditioning | 391.2 | 235.7 | | 5. Water supply; sewerage, waste management and remediation activities | 9.3 | 6.9 | | 6. Construction | 221.6 | 162.1 | | 7. Services | 2,809.2 | 2,116.8 | | Total | 5,689.7 | 4,426.4 | Changes in market valuation of FDI equity are, inter alia, reflected in the ratio of market value of such investments to their face value. At the aggregate level, this ratio has moved up over the last five years with intermittent changes (Chart 6) and stood at 5.0 in March 2017. For broad economic sectors, the ratio had a wide range from 2.1 to 34.7 (Table 3): among major sub-sectors, the ratio was 21.7 for computer programming whereas stood at 3.8 for motor vehicles. | Table 3: Sector-wise GDP growth and Market Value to Face Value Ratio | | Sector | No. of Companies | Ratio of Market Value to Face Value | | 1. Agri-related, Plantations & Allied activities | 67 | 5.0 | | 2. Mining | 97 | 34.7 | | 3. Manufacturing | 3,672 | 5.9 | | 4. Electricity, gas & water supply | 507 | 2.1 | | 5. Construction | 711 | 2.3 | | 6. Information and communication Services | 3,610 | 8.5 | | 7. Other Services | 6,505 | 3.1 | | Total | 15,169 | 5.0 |
Manufacturing of food product and electrical equipment recorded significant increase in FDI equity stock during 2016-17 followed by motor vehicles as well as information and communication sector. A comparison of growth in face value vis-à-vis market value of FDI equity shows considerable valuation gains for the manufacturing sector. Barring the real estate sector, all major services recorded significant increase in FDI equity at market value (Annex 2). 3.4 Source / Destination of Direct Investment Mauritius remained the largest source of FDI in India (21.8 per cent share at market price) followed by the USA, the UK, Singapore and Japan. Singapore was the major ODI destination (19.7 per cent share) followed by Netherlands, Mauritius and the USA. India’s top ten counterparty countries together had 92.4 per cent share in total FDI and 74.6 per cent share in total ODI (Chart 7). 3.5 Other Investments Other investment liabilities7 of reporting companies increased by 15.0 per cent during the year and stood at ₹ 12,775 billion at end-March 2017: corresponding overseas assets amounted to 32.3 per cent of these liabilities. Loans had the highest share (42.0 per cent), followed by trade credit, currency and deposits and other payables with unrelated (third party) non-resident entities. Among the corresponding overseas assets too, the share of loans was highest (33.5 per cent), followed by trade credit and currency and deposits (Chart 8). 4. Foreign Affiliates’ Trade Statistics (FATS) In respect of foreign subsidiaries and affiliates, FDI statistics cover international transfer of funds but not their economic operations (e.g., turnover, foreign trade). Foreign affiliates’ trade statistics (FATS) go beyond the monetary value of stocks and flows; they portray the dimensions of overseas commercial presence of affiliates in the local economy for trade in goods and/or services. FDI includes all foreign interests amounting to 10 per cent or more voting power, whereas FATS relate to all affiliates that are foreign-controlled subsidiaries (i.e., single direct investor’s holding is more than 50 per cent of equity). Thus, FDI and FATS reflect two related aspects of the role of multinational corporations in the global economy. FDI involves the monetary value of investment flows and stocks in companies where foreign investors have a lasting interest whereas FATS relate to economic activity (mainly sales, expenditures, exports and imports) of companies in which foreign investors have a majority stake. 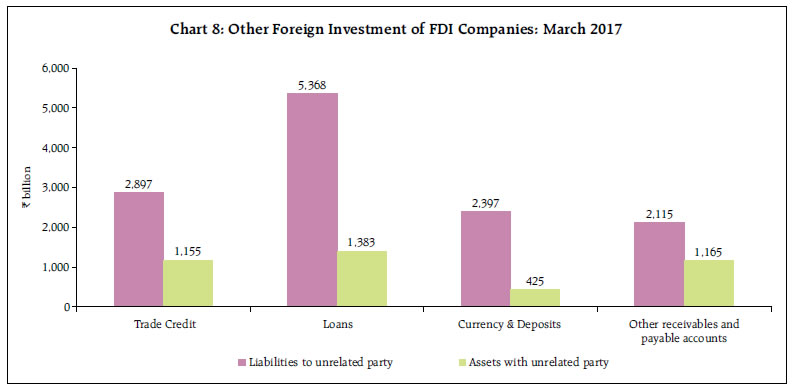 The FLA census captures data on activities (sales, expenditures, exports and imports) of both inward and outward subsidiaries. Of the 2,443 Indian companies that reported outward direct investment, 2,100 companies had a total of 3,578 overseas subsidiaries, which reported trade data relating to outward FATS. Their total sales, including exports, grew by 14.7 per cent during 2016-17 whereas their purchases, including imports, recorded a growth of 9.2 per cent (Annex 3). Exports accounted for 30.8 per cent of their total sales whereas imports had a much larger share of 57.9 per cent in their total purchases (Annex 4). Recovering from recent moderation, sales of foreign subsidiaries in India turned around and increased by 18.7 per cent to ₹19,321 billion in 2016-17 (Annex 5). Unlisted companies, which are not required to disseminate their quarterly results, accounted for 82.5 per cent of sales. Manufacturing and services sectors had shares of 55.2 per cent and 41.5 per cent, respectively, in total sales. The information and communication services sector had the highest share of 20.7 per cent in sales of which, over two-thirds was through exports. Also, during the last two years, domestic trade outpaced overseas trade, with growth in sales and purchases exceeding export and import growth (Chart 9). Inwards FATS data reported by 12,244 foreign subsidiaries in India also confirm strong trade links of foreign subsidiary companies. At the aggregate level, 30.7 per cent of their total sales were in terms of exports whereas imports accounted for 37.8 per cent of their total purchases (Chart 10). Purchases by foreign subsidiaries moved in tandem with their sales, increasing by 20.1 per cent to ₹11,974 billion in 2016-17. Entities in the services sector recorded higher turnover growth than their counterparts in manufacturing. Their purchase-to-sales ratio stood at 62.0 per cent, which is much lower than the ratio of 81.3 per cent for all subsidiary companies and is consistent with higher utilisation of human capital in the services sector. Aggregate exports of foreign subsidiary companies in India increased by 15.9 per cent during 2016-17 (Annex 6). Information and communication services remained the major export-oriented sector as only less than one-third of their sales were in domestic market and the sector accounted for 47.3 per cent of total exports. Foreign subsidiaries in the manufacturing sector, especially those in the food products, were more focussed on domestic market as reflected in the lower export-to-sales ratio for 2016-17. Total imports of the subsidiary companies increased by 15.7 per cent to ₹ 4,530 billion in 2016-17. The share of imports in total purchases by manufacturing companies was 43.7 per cent as compared with 29.2 per cent for services sector companies. Major importing sectors under manufacturing included coke and refined petroleum products, motor vehicles, trailers and semi-trailers and computer, electronic and optical products (Annex 6). 5. Conclusion India is emerging as a preferred destination for FDI. During 2016-17, the market value of direct investment by foreign companies in India rose strongly on sustained net investment inflows. The results of the 2016-17 census points to sizable valuation gains accruing to inward FDI equity with wide variations across sectors but accentuated towards the service sector relative to the manufacturing sector. This suggests that factors such as capital intensity, return on capital and the assessment of the outlook are at work. By comparison, India’s profile as FDI source country has been muted. During 2016-17, outward DI was subdued and the ratio of outward to inward direct investment at market value moderated for the third successive year. Nevertheless, Indian companies continue to reach out to global markets and 2,443 companies reported overseas presence in March 2017 with robust growth in turnover. Activities of both Indian and foreign cross-border subsidiaries increased during the year. The information and communication sector continued to be the largest export-oriented sector among foreign subsidiaries in India. Their domestic sales recovered and recorded improvement in business growth during 2016-17, with domestic trade growth outpacing that of overseas trade during the last two years. Nevertheless, foreign trade continued to have a substantial share in the business of both domestic and overseas subsidiaries companies. References Alfaro, Laura and M.X. Chen (2014), “The Global Agglomeration of Multinational Firms”, Journal of International Economics, 263-276. Alfaro, Laura (2017), “Gains from Foreign Direct Investment: Macro and Micro Approaches”, The World Bank Economic Review, Volume 30, Pages S2-S15. Bernassy-Quere, Agnes, Maylis Coupet, Thiery Mayer (2007), “Institutional determinants of Foreign Direct Investmnet”, The World Economy, Vol. 30, pp 764-782 Borensztein, E, J.De Gregorio, J.W.Lee (1998), “How Does Foreign Direct Investment Affect Economic Growth?” Journal of International Economics, pp 115- 135. Bosworth, Barry P. and Susan M.Collins (1999), “Capital Flows to Developing Economies: Implications for Saving and Investment”, Brookings Papers on Economic Activity, No. 1. Economou, Fotini, Christis Hassafris, Nikolaos Phillipas, Mike Tsionas (2016), “Foreign Direct Investment in OECD and Developing Countries”, Review of Development Economics, Vol. 21 pp 527-542 Frankel, Jeffrey A. and David Romer (1999), “Does Trade Cause Growth?” American Economic Review, 379-398. International Monetary Fund (2015), Coordinated Direct Investment Survey Guide. International Monetary Fund, Coordinated Direct Investment Survey (web-link: http://data.imf.org/regular.aspx?key=60564263). Moran, Theodore (2016), “Foreign Direct Investment”, The Wiley-Blackwell Encyclopaedia of Globalisation, 1–9. Reserve Bank of India, Results of the Annual Census on Foreign Liabilities and Assets of Indian Direct Investment Companies, Reserve Bank of India Bulletin (various issues). United Nations Statistics Division (UNSD) et.al. (2010): Manual on Statistics of International Trade in Services.
| Annex 1: Sector-wise Distribution of FDI Equity & Debt: March 2017 | | At Market Value (₹ billion) | | Activity | Equity | Debt | Total FDI | | A. Agriculture-related, Plantations & Allied activities | 42.9 | 0.7 | 43.6 | | B. Mining | 815.4 | 2.2 | 817.6 | | C. Manufacturing | 11,056.8 | 680.1 | 11,736.9 | | of which: | | | | | Chemicals and chemical products | 837.4 | 41.2 | 878.6 | | Pharmaceuticals, medicinal chemical & botanical prod. | 564.6 | 150.2 | 714.8 | | Motor vehicles, trailers and semi-trailers | 1,791.7 | 143.0 | 1,934.7 | | Tobacco products | 860.4 | - | 860.4 | | Food products | 925.7 | 19.4 | 945.1 | | Electrical equipment | 576.5 | 24.5 | 601.0 | | Machinery and equipment | 892.3 | 26.9 | 919.2 | | Coke and refined petroleum products | 384.7 | 2.1 | 386.8 | | Computer, electronic and optical products | 387.7 | 92.9 | 480.6 | | Basic metals | 145.9 | 22.9 | 168.8 | | D. Electricity, gas, steam and air conditioning supply | 502.2 | 98.5 | 600.7 | | E. Water supply, sewerage, waste management /remediation | 6.5 | 0.6 | 7.1 | | F. Construction | 375.4 | 290.9 | 666.3 | | G. Services | 9,195.8 | 318.6 | 9,514.4 | | of which: | | | | | Information and communication | 4,210.5 | 59.4 | 4,269.9 | | Financial and insurance activities | 2,742.3 | 15.4 | 2,757.7 | | Total | 21,995.0 | 1,391.6 | 23,386.6 |
| Annex 2: Activity-wise FDI Equity at Face Value and Market Value of 15,169 FDI Companies | | (Amount in ₹ billion) | | Activity | FDI Equity at Face Value | FDI Equity at Market Value | | Amount | Per cent Growth | Amount | Per cent Growth | | A. Agriculture-related, Plantations and Allied activities | 8.5 | -19.8 | 42.9 | -12.8 | | B. Mining | 23.5 | -27.9 | 815.4 | 78.4 | | C. Manufacturing | 1,872.9 | 2.9 | 11,056.8 | 18.4 | | Manufacture of food products | 90.7 | 60.0 | 925.7 | 16.3 | | Manufacture of beverages | 23.7 | 23.4 | 128.0 | -3.0 | | Manufacture of tobacco products | 3.1 | 47.6 | 860.4 | 27.8 | | Manufacture of textiles | 11.0 | -39.9 | 32.0 | 1.3 | | Manufacture of wearing apparel | 8.1 | 20.9 | 94.8 | 381.2 | | Manufacture of leather and related products | 0.7 | -36.4 | 41.6 | 6.1 | | Manufacture of wood & products of wood/cork (ex. furniture) | 0.1 | 0.0 | 0.1 | -75.0 | | Manufacture of paper and paper products | 12.0 | 3.4 | 33.8 | -6.4 | | Printing and reproduction of recorded media | 2.4 | -29.4 | 1.9 | -9.5 | | Manufacture of coke and refined petroleum products | 116.5 | 9.1 | 384.7 | 52.2 | | Manufacture of chemicals and chemical products | 103.2 | -4.4 | 837.4 | 21.7 | | Manufacture of pharmaceuticals, medicinal chemical and botanical products | 34.4 | -17.3 | 564.6 | -14.5 | | Manufacture of rubber and plastics products | 103.4 | 6.3 | 171.0 | 11.7 | | Manufacture of other non-metallic mineral products | 18.8 | -32.4 | 131.7 | -17.6 | | Manufacture of basic metals | 119.5 | 2.4 | 145.9 | 8.0 | | Manufacture of fabricated metal products, except machinery and equipment | 33.9 | -0.6 | 71.9 | 13.4 | | Manufacture of computer, electronic and optical products | 31.6 | -31.5 | 387.7 | 40.4 | | Manufacture of electrical equipment | 128.7 | 16.6 | 576.5 | -19.1 | | Manufacture of machinery and equipment not elsewhere classified | 118.1 | -22.0 | 892.3 | 54.8 | | Manufacture of motor vehicles, trailers and semi-trailers | 475.6 | 6.1 | 1,791.7 | 43.7 | | Manufacture of other transport equipment | 57.4 | -2.7 | 84.0 | 3.6 | | Manufacture of furniture | 1.5 | 50.0 | 2.6 | 44.4 | | Other manufacturing | 360.3 | 8.0 | 2,868.3 | 11.5 | | Repair and installation of machinery and equipment | 18.2 | -6.2 | 28.2 | 0.0 | | D. Electricity, gas, steam and air conditioning supply | 235.7 | 19.5 | 502.2 | 24.9 | | E. Water supply, sewerage, waste management /remediation | 6.9 | 46.8 | 6.5 | 54.8 | | F. Construction | 162.1 | -2.2 | 375.4 | -4.4 | | G. Services | 2,117.0 | 16.8 | 9,195.8 | 12.7 | | 1. Wholesale and retail trade; motor vehicles/motorcycles repair | 473.2 | 9.6 | 635.2 | 16.3 | | 2. Transportation and storage | 126.6 | 39.1 | 484.3 | 4.5 | | 3. Accommodation and Food service activities | 69.4 | 21.5 | 146.4 | 7.7 | | 4. Information and communication | 495.3 | 72.0 | 4,210.5 | 9.9 | | 5. Financial and insurance activities | 589.1 | 1.1 | 2,742.3 | 23.3 | | 6. Real estate activities | 25.3 | -23.6 | 117.6 | -25.7 | | 7. Other Services activities | 338.1 | 2.6 | 859.5 | 6.8 | | Total | 4,426.4 | 9.5 | 21,995.0 | 17.0 |
| Annex 3: Activity-wise Sale and Purchase of ODI* companies | | (Amount in ₹ billion) | | Activity | Amount | Per cent share in total | | Sale | Purchase | Sale | Purchase | | A. Agriculture-related, Plantations & Allied activities | 8.8 | 6.3 | 0.2 | 0.2 | | B. Mining | 77.9 | 61.1 | 1.8 | 1.8 | | C. Manufacturing | 1,582.9 | 1,331.2 | 37.2 | 38.5 | | of which: | | | | | | Food products | 38.3 | 34.3 | 0.9 | 1 | | Coke and refined petroleum products | 200.6 | 191.2 | 4.7 | 5.5 | | Chemicals and chemical products | 143.9 | 102.1 | 3.4 | 3 | | Pharmaceuticals, medicinal and chemical products | 300.9 | 199.8 | 7.1 | 5.8 | | Computer, electronic and optical products | 1.3 | 1.0 | 0.0 | 0 | | Electrical equipment | 11.9 | 9.7 | 0.3 | 0.3 | | Machinery and equipment not elsewhere classified. | 18.0 | 13.2 | 0.4 | 0.4 | | Motor vehicles, trailers and semi-trailers | 285.8 | 266.2 | 6.7 | 7.7 | | D. Electricity, gas, steam and air conditioning supply | 24.8 | 15.8 | 0.6 | 0.5 | | E. Water supply; sewerage, waste management and remediation activities | 1.7 | 1.3 | 0.0 | 0 | | F. Construction | 32.0 | 26.4 | 0.8 | 0.8 | | G. Services | 2,525.8 | 2,017.1 | 59.4 | 58.3 | | of which: | | | | | | Wholesale and retail trade; repair of motor vehicles and motorcycles | 480.8 | 439.8 | 11.3 | 12.7 | | Transportation and storage | 60.7 | 55.1 | 1.4 | 1.6 | | Information and communication | 1,699.8 | 1,288.3 | 40.0 | 37.2 | | Financial and insurance activities | 92.0 | 87.3 | 2.2 | 2.5 | | Total | 4,253.9 | 3,459.2 | 100.0 | 100.0 | | * Sale and Purchase of 3,578 overseas subsidiaries are reported by 2,100 Indian companies. |
| Annex 4: Activity-wise Export and Import of ODI companies | | (Amount in ₹ billion) | | Activity | Amount | Share (per cent) | | Export | Import | Export in Sales | Import in Purchase | | A. Agriculture-related, Plantations & Allied activities | 2.7 | 3.3 | 30.7 | 52.4 | | B. Mining | 44.2 | 40.3 | 56.7 | 66.0 | | C. Manufacturing | 586.0 | 674.6 | 37.0 | 50.7 | | of which: | | | | | | Food products | 17.4 | 17.9 | 45.4 | 52.2 | | Coke and refined petroleum products | 156.5 | 172.1 | 78.0 | 90.0 | | Chemicals and chemical products | 67.6 | 66.8 | 47.0 | 65.4 | | Pharmaceuticals, medicinal chemical products | 63.9 | 113.0 | 21.2 | 56.6 | | Computer, electronic and optical products | 0.2 | 0.3 | 15.4 | 30.0 | | Electrical equipment | 6.8 | 5.9 | 57.1 | 60.8 | | Machinery and equipment not elsewhere classified. | 6.2 | 6.2 | 34.4 | 47.0 | | Motor vehicles, trailers and semi-trailers | 69.3 | 50.4 | 24.2 | 18.9 | | D. Electricity, gas, steam and air conditioning supply | 7.7 | 10.2 | 31.0 | 64.6 | | E. Water supply; sewerage, waste management and remediation activities | 0.0 | 0.2 | 0.0 | 15.4 | | F. Construction | 1.6 | 1.2 | 5.0 | 4.5 | | G. Services | 667.1 | 1,272.8 | 26.4 | 63.1 | | of which: | | | | | | Wholesale and retail trade; repair of motor vehicles and motorcycles | 382.7 | 344.9 | 79.6 | 78.4 | | Transportation and storage | 46.1 | 42.0 | 75.9 | 76.2 | | Information and communication | 187.7 | 830.8 | 11.0 | 64.5 | | Financial and insurance activities | 18.7 | 21.5 | 20.3 | 24.6 | | Total | 1,309.3 | 2,002.6 | 30.8 | 57.9 | | * Export and Import of 3,578 overseas subsidiaries are reported by 2,100 companies. |
| Annex 5: Activity-wise Sale and Purchase of Foreign Subsidiary Companies* During 2016-17 | | (Amount in ₹ billion) | | Activity | Amount | Per cent share in total | | Sale | Purchase | Sale | Purchase | | A. Agriculture-related, Plantations & Allied activities | 56.3 | 42.8 | 0.3 | 0.4 | | B. Mining | 178.1 | 153.5 | 0.9 | 1.3 | | C. Manufacturing | 10,663.3 | 7,080.7 | 55.2 | 59.1 | | of which: | | | | | | Food products | 640.8 | 382.7 | 3.3 | 3.2 | | Coke and refined petroleum products | 863.4 | 510.4 | 4.5 | 4.3 | | Chemicals and chemical products | 560.1 | 330.9 | 2.9 | 2.8 | | Pharmaceuticals, medicinal and chemical products | 386.9 | 215.0 | 2.0 | 1.8 | | Computer, electronic and optical products | 1,061.1 | 695.5 | 5.5 | 5.8 | | Electrical equipment | 710.9 | 429.2 | 3.7 | 3.6 | | Machinery and equipment not elsewhere classified | 818.8 | 554.9 | 4.2 | 4.6 | | Motor vehicles, trailers and semi-trailers | 2,356.0 | 1,720.0 | 12.2 | 14.4 | | D. Electricity, gas, steam and air conditioning supply | 165.1 | 115.1 | 0.9 | 1 | | E. Water supply; sewerage, waste management and remediation activities | 11.3 | 6.8 | 0.1 | 0.1 | | F. Construction | 229.2 | 131.0 | 1.2 | 1.1 | | G. Services | 8,017.4 | 4,444.4 | 41.5 | 37.1 | | of which: | | | | | | Wholesale and retail trade; repair of motor vehicles and motorcycles | 2,190.6 | 1,962.9 | 11.3 | 16.4 | | Transportation and storage | 231.1 | 166.4 | 1.2 | 1.4 | | Information and communication | 4,000.4 | 1,560.6 | 20.7 | 13 | | Financial and insurance activities | 387.6 | 160.6 | 2.0 | 1.3 | | Total | 19,320.7 | 11,974.3 | 100.0 | 100 | | * Of the 12,244 subsidiary companies in India, 8,557 reported sales and 5,648 reported purchase. |
| Annex 6: Activity wise Export and Import of Foreign Subsidiary Companies* During 2016-17 | | (Amount in ₹ billion) | | Activity | Amount | Share (per cent) | | Export | Import | Export in Sales | Import in Purchase | | A. Agriculture-related, Plantations & Allied activities | 2.0 | 5.8 | 3.6 | 13.6 | | B. Mining | 1.9 | 88.7 | 1.1 | 57.8 | | C. Manufacturing | 2,047.9 | 3,091.7 | 19.2 | 43.7 | | of which: | | | | | | Food products | 53.3 | 89.1 | 8.3 | 23.3 | | Coke and refined petroleum products | 358.6 | 404.0 | 41.5 | 79.2 | | Chemicals and chemical products | 102.1 | 170.5 | 18.2 | 51.5 | | Pharmaceuticals, medicinal chemical products | 141.5 | 106.8 | 36.6 | 49.7 | | Computer, electronic and optical products | 206.5 | 560.8 | 19.5 | 80.6 | | Electrical equipment | 91.8 | 161.3 | 12.9 | 37.6 | | Machinery and equipment not elsewhere classified | 241.7 | 203.5 | 29.5 | 36.7 | | Motor vehicles, trailers and semi-trailers | 343.9 | 317.4 | 14.6 | 18.5 | | D. Electricity, gas, steam and air conditioning supply | 6.0 | 34.1 | 3.6 | 29.6 | | E. Water supply; sewerage, waste management and remediation activities | 0.7 | 1.1 | 6.2 | 16.2 | | F. Construction | 14.1 | 11.7 | 6.2 | 8.9 | | G. Services | 3,852.0 | 1,296.7 | 48.0 | 29.2 | | of which: | | | | | | Wholesale and retail trade; repair of motor vehicles and motorcycles | 386.3 | 916.1 | 17.6 | 46.7 | | Transportation and storage | 54.7 | 28.2 | 23.7 | 16.9 | | Information and communication | 2,802.0 | 264.0 | 70.0 | 16.9 | | Financial and insurance activities | 142.4 | 11.4 | 36.7 | 7.1 | | Total | 5,924.6 | 4,529.8 | 30.7 | 37.8 | | * Of the 12,244 subsidiary companies in India, 6,365 reported exports and 3,931 reported imports. |
|