| Executive Summary The past decade has witnessed several innovations in retail payments across the globe including India. Benchmarking India’s Payment Systems facilitates an assessment of India’s progress against payment systems and instruments in major countries and provides further impetus to the planned efforts for deepening the digitisation of payments. 2. A comprehensive exercise for benchmarking India’s Payment Systems was undertaken by selecting a mix of 21 countries (including advanced economy countries, Asian economies and BRICS (Brazil, Russia, India, China and South Africa) nations spread across all the continents where payment systems are considered robust, diverse and efficient. The countries include Australia, Brazil, Canada, China, France, Germany, Hong Kong, India, Indonesia, Italy, Japan, Mexico, Russia, Saudi Arabia, Singapore, South Africa, South Korea, Sweden, Turkey, United Kingdom and the United States of America. 2. Reserve Bank of India (RBI) has relied on publicly available information in this report and has made every effort to ensure that the information contained in the report is accurate. 3. Payment Systems have been rated on the basis of categories, which are as under: (a) “Leader”: ranked 1st or 2nd or 3rd; (b) “Strong”: in the top rungs of the countries other than the leaders (4th to 9th); (c) “Moderate”: ranked in the middle (10th to 15th); and, (d) “Weak”: in the lowest rungs (16th to 21st). 4. The benchmarking exercise aims to provide an understanding of the payment systems in place in India and how their usage preferences compare with other countries. It is also a starting point for a meaningful analysis of the efficiency levels of India’s payment systems. 5. The benchmarking has been done over a range of 21 areas and 41 indicators as indicated below. A snapshot of India’s position, details of which are in the report, is as follows: | Rating | Indicator | Area | Ref to item number in para 8 of the report | | Leader | Regulation of costs of payment systems | Regulation | 2 | | Features available in Cheque instruments | Cheques | 9 | | Number of debit cards issued | Debit and Credit Cards | 10 | | Number of ATMs deployed across the country. Per capita cash withdrawal at ATMs | Cash & ATM | 16, 18 | | Share of Credit Transfers in payment systems | Credit transfers | 22 | | Availability of alternate payment systems; Share of e-Money in payment systems | e-Money | 27, 29 | | Citizen to Government (C2G) e-payments; Business to Government (B2G) e-payments; Government to Business (G2B) e-payments | Government e-payments | 33.2; 33.4; 33.5 | | Oversight by the Central Bank | Oversight | 38 | | Cross border personal remittance flows | Cross Border Personal Remittances | 40 | | Strong | Laws in place and scope of regulation | Regulation | 1 | | Cash in Circulation per capita | Cash | 3 | | Number of Point of Sale (PoS) terminals deployed across the country | Debit and Credit Cards | 12 | | Volume and growth of Credit Transfers | Credit transfers | 21 | | Real Time Gross Settlement System (RTGS) | Large Value Payment Systems | 23 | | Fast payment systems available in the country | Fast payments | 24 | | Volume and growth of e-Money | e-Money | 28 | | Mobile and Broadband subscriptions | Digital Infrastructure | 32 | | Customer safety and Authentication Standards; Ombudsman scheme for Complaints Redress | Customer Protection & Complaint Redress | 35; 36 | | Central Counterparty operational in the country | Securities Settlement & Clearing System | 37 | | Moderate | Cash in Circulation as percentage of GDP | Cash | 4 | | Overall Payment Systems transactions volume and growth; Value of payment systems transactions to cash in circulation | Payment Systems Transactions | 5; 6 | | Number of credit cards issued | Debit and Credit Cards | 10 | | Debit and Credit Card usage at PoS terminals and online | Debit and Credit Cards | 14 | | Presence of domestic Card Network and its share | Domestic Card Network | 20 | | Government e-payments in the country; Government to Citizen (G2C) e-payments | Government e-payments | 33.1; 33.3 | | Regulation of Payment Aggregators | Aggregators | 34 | | Costs of cross border personal remittances | Cross Border Personal Remittances | 41 | | Weak | Rate of decline of cheques; Ratio of Cheque volume vs payment systems volume | Cheques | 7; 8 | | Share of debit and credit card payments in payment systems; Number of people per PoS terminal | Debit and Credit Cards | 11; 13 | | Value of debit and credit card payments to cash in circulation | Cash vs Debit and Credit Cards | 15 | | Number of people per ATM; Ratio of ATM Withdrawal vs cash in circulation | Cash & ATM | 17; 19 | | Volume and year on year growth of direct debits; Share of direct debits in payment systems | Direct Debits | 25; 26 | | Digital payment of utility bills; Public Mass Transportation systems in the country | Digital Utility Payments | 30; 31 | | Availability of channels and operators for cross border personal remittances | Cross Border Personal Remittances | 39 | Benchmarking India’s Payment Systems 1. Background 1.1 An efficient payment system reduces the cost of exchanging goods and services, and is indispensable to the smooth functioning of various markets, especially interbank, money and capital markets. A weak payment system on the other hand may severely hamper the stability and developmental capacity of an economy; its failures can result in inefficient use of financial resources, inequitable risk-sharing among agents, actual losses for participants, and loss of confidence in the financial system and in the very use of money. 1.2 For entities to stay at the top, benchmarking is necessary to cope with the changes in the demographics, politics, economy and technology. Benchmarking is a way of discovering the best performance being achieved in any area which, in turn, can be used to identify gaps in an organization’s processes in order to improve its functioning. 1.3 India’s Payment Systems are considered to be efficient, safe and secure. The payment and settlement systems are also adequately regulated and supervised. Over the past decade, a number of innovations have taken place in retail payments. These have reshaped payment processes and changed the retail payments landscape by influencing users in their choice of payment instruments. In addition, the innovations and changes have lowered costs and have increased social welfare. Benchmarking is an effective means of evaluating the efficiency of the payment systems in the country. 2. Present Exercise 2.1 This exercise aims at benchmarking India’s Payment Systems and gauges India’s standing against twenty other countries across all payment systems and payment instruments. It attempts to gain a perspective on the performance of India compared to other countries, in the payment systems space. It highlights strengths and weaknesses relative to comparable payments and usage trends in other countries. The exercise, therefore, tries to (a) arrive at an understanding of preferences Indians have for making and receiving payments and how these preferences compare with other countries, and (b) measure the efficiency of our payment systems. 2.2 The data used for benchmarking is mostly for the years 2012 and 2017. In the last year or so, the digital growth, acceptance infrastructure and many other parameters in India have seen a sizeable jump. India’s score is likely to be better when the data for all countries for 2018 is available for making a comparison. 2.3 The current Benchmarking exercise is a first of its kind, undertaken by the Reserve Bank; future exercises shall be undertaken at frequent intervals and the parameters monitored on a continuous basis. 3. Data Sources 3.1 The benchmarking draws on the following data sources: -
BIS Red Book ‘Country Tables’ compiled by the Bank for International Settlements (BIS) for the year ended 2017, published in March 2019 -
Worldpay Global Payments Report – November 2018. -
RBI Data. -
Survey conducted by the Working Group on “Central Bank Involvement in Retail Payments, 2012 constituted by the Committee on Payment and Settlement Systems (CPSS), BIS. -
Committee on Payments and Market Infrastructures (CPMI) Report on Fast payments Enhancing the speed and availability of retail payments, November, 2016. -
RTGS Survey by the RTGS Working Group to the CPMI, 2012 -
Global Findex Survey, 2017 conducted for World Bank. -
World Bank - World Development Indicators -
The Economist Intelligence Unit - The 2018 Government E-Payment Adoption Ranking -
Migration and Development Brief 30, 2018 being finalised by “KNOMAD” , World Bank Group 3.2 The format of this exercise has been drawn from the “Research Paper - Benchmarking New Zealand’s Payment Systems” published in May 2016. 3.3 Reserve Bank of India (RBI) has relied on publicly available information in this report and has made every effort to ensure that the information contained in the report is accurate. 4. Selecting the countries to benchmark against 4.1 The BIS publishes statistics (known as the Red Book statistics) on payments and financial market infrastructures (FMIs) in member jurisdictions of the Committee on Payments and Market Infrastructures (CPMI). The Red Book contains data on 26 countries. To improve readability and presentation and to make the analysis insightful, the benchmarking is confined to 21 countries spread across all the continents where the payment systems are considered to be robust, diverse and efficient. 4.2 The countries included in the benchmarking exercise are a mix of advanced economies, Asian economies and all the BRICS nations. They are Australia, Brazil, Canada, China, France, Germany, Hong Kong, India, Indonesia, Italy, Japan, Mexico, Russia, Saudi Arabia, Singapore, South Africa, South Korea, Sweden, Turkey, United Kingdom and the United States of America. For the purpose of the indicators “Regulations” and “Oversight”, European Central Bank (ECB) has also been included. One striking feature of the countries selected is that most countries apart from India and Indonesia are characterised by high income or upper middle income in terms of World Bank socio-economic indicators, which would explain the relative position of countries on various parameters. The countries which are present in the Red Book but excluded from the study are Argentina, Belgium, Netherlands, Spain and Switzerland. 5. Rating 5.1 The benchmarking has been done over a range of indicators from regulation of payment systems to payment instruments and infrastructure. For each indicator, the rationale for the rating with the practices followed by leaders is provided as an annex. The rating categories are: -
“Leader”: ranked 1st or 2nd or 3rd; -
“Strong”: in the top rungs of the countries other than the leaders (4th to 9th); -
“Moderate”: ranked in the middle (10th to 15th); and -
“Weak”: in the lowest rungs (16th to 21st). 6. Highlights This exercise gives an understanding of the systems in vogue in India for making and receiving payments and how their usage preferences compare with other countries. It is also a starting point for a meaningful analysis of the efficiency levels of India’s payment systems. A summary of the insights is given below: 6.1 The scope of regulation in India extends to the whole gamut of payment systems, instruments, costs and services provided by banks and non-banks. 6.2 The relatively high level of cash in circulation offers scope for higher level of digitisation of payments. 6.3 The growth in the volume of payment systems transactions has been strong and steady. 6.4 There is a robust cheque clearing system. The decline in cheques usage has, however, been slow. 6.5 Credit and debit Cards are growing at a steady rate. 6.6 There is an increase in Point of Sale (PoS) terminals including mobile terminals which, however, may not be enough to cater to the large population. 6.7 Domestic Card Network (RuPay) showed an average growth till 2017 and picked up thereafter with the issue of RuPay debit cards, largely by public sector banks. 6.8 Strong Large Value and Fast Payment Systems are in place. 6.9 e-Money growth and options of alternate payments are available. 6.10 Low digital payment of utility bills. Bharat Bill Payment System (BBPS), an integrated interoperable bill payment system which commenced live operations from October 12, 2017 is expected to facilitate digital payment of utility bills like electricity, telecom, Direct-to-Home (DTH), gas and water. 6.11 Digital communications infrastructure in the form of a robust mobile network is growing strongly. Broadband infrastructure, however, lags behind. 6.12 India has implemented more concerted initiatives to facilitate Government e-payments by the State and e-receipts to the State. 6.13 Authentication standards in India are strong. 6.14 India has a robust and well managed central counter party (CCP) system for Government securities settlement. 6.15 A distinct Ombudsman Scheme for complaints relating to digital financial transactions is in existence from January 31, 2019. 6.16 The Oversight role is explicitly and implicitly laid down in the statute and the Reserve Bank is empowered with a wide variety of tools to carry out this function. 6.17 The Cross-border payment transactions are slow when compared to domestic payments. The alternatives available are few. India continues to be a large recipient of personal remittances. 7. Learning Points 7.1 The last few years, more specifically since November 2016, have witnessed a sea change in the payments landscape with a large growth in digital payments. There is an increased focus on speeding up payment processing, both through faster payment initiation and faster settlement. 7.2 Demonetization was implemented in India on the November 8, 2016 withdrawing the legal tender status of Rs.500 and Rs.1000 notes. This led to a push in the use of cheques and digital payments. The digital push was sustained in 2017. 7.3 Driven by efforts aimed at higher financial inclusion and adoption of mobile payments, India recorded an accelerated growth rate of over 50% in the volume of retail electronic payment transactions in the last four years (71%, 65%, 51% and 95% in the financial years ended 2015-16, 2016-17, 2017-18 and 2018-19, respectively – source: RBI data). The growth in 2018-19 was largely due to the steep growth in Unified Payments Interface (UPI). 7.4 Card (debit and credit) payment is an important payment instrument which has replaced the use of cash at least in retail outlets and e-commerce sites. It may be noted that the level of credit card penetration in India is low when compared to advanced countries where it is a preferred option for making payments. The usage behaviour in the financial year 2018-19 at PoS vs ATMs with reference to debit and credit cards is depicted in the following table: | ATM | Volume(mn) | Value(INR bn) | Ticket Size (INR) | Share - Volume | Share - Value | | Credit Cards | 9.77 | 45.33 | 4639.19 | 0.10% | 0.14% | | Debit Cards | 9859.61 | 33107.89 | 3357.93 | 99.90% | 99.86% | | PoS & online | Volume(mn) | Value(INR bn) | Ticket Size (INR) | Share - Volume | Share - Value | | Credit Cards | 1762.59 | 6033.48 | 3423.08 | 28.54% | 50.41% | | Debit Cards | 4414.28 | 5934.75 | 1344.44 | 71.46% | 49.59% | 7.5 To encourage usage of cards, card infrastructure is required to be robust, strong and secure. Further, the last mile availability of PoS terminals is relatively lower in India and much needs to be done in this regard. Mandating the issue and use of only EMV chip and PIN-based cards has helped build public confidence as it provides more security than the ‘Magstripe only’ cards. 7.6 The turning point in digital payment system preferences relates to the fact that mobile phones are rapidly becoming personal electronic devices performing an increasing range of services including those relating to payments. In India, mobile infrastructure is expanding and financial inclusion has ensured that banking in the form of Basic Savings Bank Deposit (BSBD) accounts reaches the remotest part of the country. 7.7 The role of non-banks in retail payments has increased significantly, owing in part to the growing use of innovative technology that allows non-banks (mostly fintech companies) to compete in areas not yet dominated by banks. 7.8 With the digital landscape exploding, there is an urgent need for improved security and customer identification in electronic payments. Consumers demand and expect equal measures of seamless ease and security in all aspects of their digital lives, most of all when it comes to shopping and payments. Consumer expectations for safe payments demand that merchants make secure user authentication as seamless as the act of payment. 7.9. In India, the smartphone revolution has seen an explosion in digital payment options, from e-Money to the Unified Payments Interface (UPI) to a combination of the two. After demonetization, use of e-Money picked up on a very large scale. The digital landscape changed with increase in the usage of e-Money, UPI, Aadhaar Payments Bridge System (APBS), RuPay, Bharat Bill Payment System (BBPS), etc. 7.10 Generally, competition pushes market participants to increase efficiency. In case market participants are unable to cope, they are pushed out of the market. Customers and service providers require solutions that are cost-efficient, user friendly and safe. In India, not only are a bouquet of varied systems available, but also healthy competition is an integral component. 7.11 “Aadhaar” enabled eKYC (electronic Know Your Customer) had resulted in an exponential growth of digital payments in India. 7.12 The most straight-forward approach to have a digital push would be to target the generation which is most responsive to technology and digital age. This “heads down” generation is ready to try out new payment systems / channels as long as they perceive that the rewards are good. 8. Benchmarking Summary | Area | Item number | Indicator | Insights | Rating | | (A) Regulation | 1 | Laws in place and scope of regulation | The Reserve Bank’s scope for regulation extends to the whole gamut of payment systems (except payment aggregators) and instruments as also services provided by banks and non-banks. India is one of the few countries that has a specific Payment Systems Law. However, in order to maintain public confidence in the payment systems, entry and exit of operators is regulated in India, unlike certain other jurisdictions. | Strong | | 2 | Regulation of costs of payment systems | In India there exists a stipulation that the Merchant Discount Rate (MDR) should be borne by the merchant and not passed on to the customer. To promote digital transactions, the Central Government has been, reimbursing bearing the MDR charges on transactions with values up to Rs.2000 made through debit cards, BHIM UPI and Aadhaar-enabled payment system; this facility is available till December, 2019. The Reserve Bank has also prescribed the maximum charges that can be levied by banks for transactions undertaken through National Electronic Funds Transfer (NEFT) system and the Real Time Gross Settlement (RTGS) System. | Leader | | (B) Cash | 3 | Cash in Circulation per capita | India with cash equivalent USD 218 per capita in 2017, scores highly over even developed countries with regard to low per capita cash in circulation. While, it is a fact that the high numerator is divided over a high denominator, per capita availability of cash is quite low when compared to most countries. This indicator may also be a proxy for low income levels. | Strong | | 4 | Cash in Circulation as percent of GDP | India is in the middle with reference to amount of cash in active circulation relative to GDP (10.7% in the year 2017). This contrasts with the earlier parameter in as much as cash handled by the population is not commensurate with their income levels.
While India had a rapidly shrinking cash level in 2017 as compared to 2012, other countries with the exception of Brazil, Indonesia, Russia, South Africa and Sweden had increasing cash levels. Although cash is deeply embedded in the payment systems in India, planned efforts post-demonetisation have shown that shift from cash to digital can be achieved. | Moderate | | (C) Payment Systems Transactions | 5 | Payment Systems transactions volume and growth | The volume of payment transactions in India grew strongly and steadily at a CAGR of 40% between 2012 and 2017 showing an appetite for modes of payment other than cash. Payment systems volume grew at rates faster than India only in China, Indonesia and Saudi Arabia. The payment system transactions in 2017 grew by 44.8% over the previous year (over a strong year-on-year growth of 56.4% in 2016) even after cash availability normalised after demonetisation showing that non-cash payments were slowly becoming a habit for the users. This is also demonstrated by the growth of 54.3% in the financial year 2018-19 over the previous financial year. | Moderate | | 6 | Value of payment systems transactions to cash in circulation | The payment systems transactions at 78.0 times the cash in circulation in the year 2017 establishes that India has a moderately strong bias for cash payments. The ratio in 2016 was 90.9 as demonetisation led to an increase in the ratio, more due to non-availability of cash rather than due to a shift in preference. The preference for cash in India, despite availability of various payment systems is strong and offers scope for a strong digital push. | Moderate | | (D) Cheques | 7 | Rate in decline of cheques | While India was far behind the United States in the volume of cheques, the decline rate in India was the lowest. Only Turkey posted a decline lower than India {CAGR of -1% between 2012 and 2017}. The slow decline in India in the years 2016 and 2017 was because use of cheques increased in the wake of demonetisation. | Weak | | 8 | Cheque volume vs payment systems volume | India’s share of cheque volume relative to all payment instruments was high at 7.3% in the year 2017 keeping it at the bottom of the pile with respect to the countries benchmarked. However, the share reduced to 4.6% in 2018-19. | Weak | | 9 | Cheque instrument features | India has a robust cheque clearing system with a T+1 settlement across the country. This ensured that the economy did not suffer on account of payment and settlement issues when the major mode of settlement, viz., cash, was not in adequate supply. | Leader | | (E) Debit and Credit Cards | 10 | Number of cards issued | India is second only to China in terms of number of debit cards issued and is a leader in growth. For credit cards, while the growth levels are good and better than all the benchmarked countries, the number of credit cards issued is not very significant when compared to the group. The reasons for low credit card usage in India are, (a) demand – where Indian households are traditionally oriented towards savings; (b) supply – with a majority of the labour force occupied in the unorganised sector with the card issuers in all probability unwilling to take higher credit risks and, (c) the Indian ethos to pay for goods and services on purchase instead of running up credit lines. | Debit
Cards:
Leader;
Credit
Cards:
Moderate | | 11 | Share of card payments in payment systems | Debit and credit card payments made up 29.9% of India’s payment systems volume in the year 2017. Based on the mix of the countries benchmarked, India is in the lower rung and ranks higher than only Germany and Indonesia. In terms of volume, however, India is moderate with a strong CAGR (Table 14). | Weak | | 12 | Point of sale (PoS) terminals deployed | India had made considerable progress in deployment of PoS terminals and the number is higher than all countries with the exception of Brazil and China. Over the period 2012 to 2017, India with a CAGR of 29% was next only to China which has a CAGR of 34%. | Strong | | 13 | People per PoS | Although India made considerable progress with reference to the absolute number of PoS terminals deployed, it has a long way to go for reaching them out to its population. India had a large number of 427 persons per PoS terminal as at the end of year 2017 and all the other countries in the benchmarked group had a better deployment rate. | Weak | | 14 | Debit and Credit Card usage at PoS | India is slowly and steadily moving away from cash for making payments at retail outlets. The volume of debit and credit card payments grew by a CAGR of 40% from 880 million in 2012 to 4799 million transactions in 2017. | Moderate | | (F) Cash vs Debit and Credit Cards | 15 | Value of debit and credit card payments to cash in circulation | India is at the lower rung of the benchmarked countries in respect of the value of debit and credit card spending relative to the cash in circulation. | Weak | | (G) Cash and ATM | 16 | ATMs deployed | India is next only to China in terms of the number of ATMs deployed and it also had a strong CAGR of 14% during the period between 2012 and 2017. While this is good from customer service perspective, it depicts a high demand for cash. As at the end of the year 2017, India had 222300 which however dropped to 221703 as on March 31, 2019. | Leader | | 17 | People per ATM | Like PoS terminals, although India has made considerable progress with reference to the absolute number of ATMs deployed, it has a long way to go for reaching them out to its population. All countries in the benchmarked group have a better deployment rate. The silver lining, however, is that the availability has doubled over the six year period between 2012 and 2017 with dependency reducing from 10832 persons per ATM in 2012 to 5919 persons per ATM in 2017. | Weak | | 18 | Per capita cash withdrawal at ATMs | In 2017, Indians attained a low 7 ATM withdrawals per person which was better than all the benchmarked countries. While this ratio normally indicates less cash dependency, the truth is that in India access to ATMs is low (numerator) and the population is high (denominator), hence a good ratio. In addition, there is a limit on the number of times cash can be withdrawn from ATMs without any charges which acts as a deterrence at times. | Leader | | 19 | ATM Withdrawal vs cash in circulation | India has one of the lowest ratios of ATM cash withdrawal relative to cash in circulation. This is because of the high level of cash in circulation, low per-capita availability of ATMs (5919 people per ATM in the year 2017– refer Table 17) and restriction on number of free withdrawals. It is also an indicator of low efficiency in recycling cash, i.e., the cycle withdrawing cash, making payments with it and in turn making deposits through the banking system. In India, ATMs dispense higher denomination notes. | Weak | | (H) Domestic Card Network | 20 | Presence of domestic Card Network and its share | India with Rupay launched in 2012 is a late entrant in the market. In 2017, the share of Rupay was 15% of the total cards issued in India. It is reported that about 586 million RuPay cards have been issued as of March 31, 2019 by nearly 1,100 banks giving it more than 50% share in the country’s debit cards issued. The drive for a less cash economy in the wake of demonetisation and issue of RuPay cards for Basic Savings Bank Deposit (BSBD) accounts promoted usage of RuPay cards in the interiors of the country where paying with a debit or credit card was a novelty just five years back. | Moderate | | (I) Credit Transfers | 21 | Volume and growth of credit transfers | India’s credit transfer volumes are strong when compared with the benchmarked countries. It has also exhibited leading growth with a CAGR of 60% between 2012 and 2017 and a year on year growth in 2017 of 52.9%. The growth can be attributed to the robust working of well-established credit transfer systems. | Strong | | 22 | Share of credit transfers in payment systems | With an efficient credit transfer system in place, India is placed at the 2nd position amongst the benchmarked countries in the year 2017 with reference to the share of credit transfers in the payment systems. | Leader | | (J) Large Value Payments | 23 | RTGS | Real Time Gross Settlement (RTGS) which is owned and operated by the Reserve Bank of India started functioning in 2004; this was upgraded in 2013 when India became the first country to use ISO 20022 standard for RTGS messages. The RTGS offers direct and indirect access to participants and also offers access to intra-day liquidity to eligible participants. Domestically located banks, domestically located non-banks, domestically located broker-dealer, domestically located FMIs and branches of foreign banks located in India have direct access to RTGS in India. RTGS can be accessed through web-based portal and proprietary network and also transactions can be initiated physically at participants’ locations. These features make the system robust and have led to its acceptability and usability. The system is, however, not available 24*7 and there is no technical interoperability with other systems. | Strong | | (K) Fast Payments | 24 | Channels in which fast payments is available | India is one of the few countries which has fast payment systems in the form of IMPS and UPI. IMPS stared functioning as early as 2010 and scores over fast payment systems in other countries as it is available through all the channels (online, mobile, physical and IVR). UPI which was introduced in 2016 has the convenience of not requiring the need for providing card numbers, IFSC codes or account numbers for transactions. | Strong | | (L) Direct Debits | 25 | Volume and growth of direct debits | In the year 2017, India’s direct debit was ranked 12th out of the 17 benchmarked countries which was lower than the 2nd position (out of 21 benchmarked countries) in respect of credit transfers. The growth, however, was good. | Weak | | 26 | Share of direct debits in payment systems | India’s share of direct debits in payment systems was low at 3.0% in the year 2017. It may also be noted that other forms of alternate payments have picked up and are being preferred over direct debits. | Weak | | (M) e-Money | 27 | Availability of alternate payment systems | India has developed a number of alternate payment channels. Although behind China, India has a decent 26% of online transactions using e-Money. It is far above other developed countries where cards, especially credit cards are predominantly used. | Leader | | 28 | Volume and growth of e-Money | With 3459 million e-Money transactions, India was behind only Japan and USA in 2017 with respect to volume of e-Money transactions. The availability of various alternate payment systems helped the growth. Demonetization in November 2016 was a game-changer for e-Money as people switched to electronic-modes of payments resulting in a year on year growth of 162.5% in the year 2016. While medium to large-value transactions continue to be made through digital banking channels and cheques, the low-value day-to-day transactions shifted to e-Money. | Strong | | 29 | Share of e-Money in payment systems | India has made significant progress by increasing the share of e-Money in the payment systems from 0.8% in 2012 to 10.3% in 2016 and 21.5% in 2017. While demonetisation gave the necessary fillip, the availability of mobile infrastructure and alternate payment systems ensured that payment systems were not affected when cash was in short supply. | Leader | | (N) Digital Utility Payments | 30 | Digital payment of utility bills | Only 3% of the population in India used the internet to pay utility bills in the year 2017. There is scope for increased adoption in this sphere of activity (refer Table 25C). | Weak | | 31 | Public Mass Transportation | The National Common Mobility Card, also known as One Nation One Card, is an inter-operable transport card conceived by the Ministry of Housing and Urban Affairs of the Government of India. This would help the cities and people in the task of management and settlement of payment for public transport. The card is an open system which can be used in a bus, train, and metro etc. and will promote digital transaction while using public transport. | Weak | | (O) Digital Infrastructure | 32 | Mobile and Broadband subscriptions | The growth of infrastructure in India has been phenomenal over the past six years, especially with reference to availability of Mobile Cellular Subscriptions. Only China in terms of terminals per million inhabitants has evidenced more growth. With increased penetration of 3G and 4G even in remote areas, the internet network is rapidly expanding in India and provides a threshold of “Digital Revolution.” There are, however, connectivity issues which need to be addressed. | Strong | | (P) Government e-Payments | 33.1 | Overall | As per the Government E-Payment Adoption Ranking report, despite the fact that India has less than adequate infrastructure (an average category score of 30.1 versus 44.2 across all countries) as well as less sophisticated social, economic context, it performs well on all other four e-payment pillars pushing it to a high rank of 28 out of 75 countries by the Economist Intelligence Unit in its 2018 Government E-Payment Adoption Ranking. India along with Brazil (ranked 17th) and South Africa (ranked 42nd) have implemented more concerted initiatives to facilitate e-payments to and from the State. China (ranked 48th) has witnessed a boom in commercial e-payments; but C2G and G2C electronic transaction services are lower. | Moderate | | 33.2 | Citizen to Government | As per the Government E-Payment Adoption Ranking report, India’s performance is exceptional with reference to payments platform functionality for transaction services, pension contributions, obtaining / paying for an identity card, private transit costs and public transit payments and very strong with reference to income tax payments. The Economist Intelligence Unit in its 2018 Government E-Payment Adoption Ranking, ranked India 3rd along with Denmark, Norway, Russia, Australia and Hong Kong amongst 75 countries.
India’s performance is reflective of some older initiatives, such as a fully electronic pension platform (the National Pension System portal, or eNPS), and also of newer ones, such as the development of an online portal to begin the process of obtaining an identity card. | Leader | | 33.3 | Government to Citizen | As per the Government E-Payment Adoption Ranking report, India’s performance is exceptional with reference to income tax refunds, pension benefits and government social security payments online but is below average in disbursing unemployment benefits. The Economist Intelligence Unit in its 2018 Government E-Payment Adoption Ranking, ranked India 25th amongst 75 countries and termed its performance as “Mature.”
India’s Aadhaar has become a case study for national digital identification. One of Aadhaar’s early goals was to improve the efficiency of state aid by linking welfare and other transfers to unique 12-digit ID numbers tagged to biometric markers. Aadhaar reduced leakage from the system by expunging fake beneficiaries. | Moderate | | 33.4 | Business to Government | As per the Government E-Payment Adoption Ranking report, India scores exceptionally with reference to business income tax payments, VAT / sales tax (now GST) payments, business pension contributions, company registration and payment of fees. The Economist Intelligence Unit in its 2018 Government E-Payment Adoption Ranking, ranked India as a joint leader along with several advanced economies. | Leader | | 33.5 | Government to Business | As per the Government E-Payment Adoption Ranking report, India scores very highly for business income tax refunds, VAT / sales tax refunds, payments for goods and services and disbursement of loans. In India the tax calculation, tracking and refund process is electronic. The Economist Intelligence Unit in its 2018 Government E-Payment Adoption Ranking, ranked India as a joint leader along with Brazil, Norway, France and Hungary amongst 75 countries. | Leader | | (Q) Aggregators | 34 | Payment Aggregators | In India, there is no direct regulation of the third party payment service providers, while indirect regulation which has been serving well does exist. However, the central bank has issued directions for opening and operation of accounts and settlement of payments for electronic payment transactions involving intermediaries to ensure the safe and orderly conduct of these transactions. The Reserve Bank has been examining the need and feasibility of regulating Payment Gateway Service Providers and Payment Aggregators. It may be added that not regulating payment aggregators removes them from the ambit of the Digital Ombudsman. | Moderate | | (R) Customer Protection and Complaint Redress | 35 | Customer safety and Authentication Standards | India has a framework on Limiting Liability of Customers in Unauthorised Electronic Banking Transactions. In addition, the Reserve Bank has also mandated (a) positive confirmation for RTGS, NEFT and IMPS; (b) two factor authentication for card transactions; and (c) alerts on debit to bank accounts and e-Money. India along with China is one of the few countries to have launched its two factor authentication system Rupay’s “PaySecure”. The other systems in use today are Mastercard / Visa’s 3DSecure and UnionPay’s SecurePay and ExpressPay. | Strong | | 36 | Ombudsman | The Ombudsman Scheme for Digital Transactions launched on January 31, 2019, was introduced with the objective to facilitate the redress of complaints regarding digital transactions undertaken by customers of a Payment System Participant viz., any person other than a bank participating in a payment systems (banks are covered under the Banking Ombudsman Scheme). A separate Ombudsman Scheme for complaints relating to digital financial transactions does not exist in other major jurisdictions. Only in Australia, the Ombudsman attends to complaints on secure payment systems transactions (such as PayPal or Safe2pay). | Strong | | (S) Securities Settlement and Clearing System | 37 | Central Counterparty (CCP) | CCIL offers central counterparty (CCP) clearing services for trades in Indian Government Securities (outright REPO Tri-party REPO), Forex (including Forward trades) and Rupee OTC derivative trades (interest rate SWAPS and Forward rate agreements). India ranks strong with reference to the services offered and the risk management policies in place.
CCIL monitors its exposures on a real time basis and collects sufficient margins from member participants.
It also has a member contributed default fund. Further CCIL has constituted a Settlement Reserve Fund and Contingency Reserve Fund which are its skin in the game to cater to member default and non-default related losses, respectively. | Strong | | (T) Oversight | 38 | Oversight by the Central Bank | The Oversight by Central Bank explicitly and implicitly laid down in the statute and the Reserve Bank of India is empowered with a wide variety of tools to carry out this function. | Leader | | (U) Cross Border Personal Remittances | 39 | Availability | The Act governing cross border remittances is the Foreign Exchange Management Act, 1999 (FEMA). The main channel for remittance is through authorised dealer category - I banks which predominantly use the S.W.I.F.T. messaging system. Entities licenced as authorised dealer category - II are permitted to make inward remittances only. Outward remittances have to be channelized only through banks. In the absence of alternatives, the payment systems is slow as compared to domestic payments. | Weak | | 40 | Flows | India is a leader with reference to inflows towards personal remittances. It received USD 79.5 billion in 2018. This can be attributed to the large Indian Diaspora outside sending remittances to the country. The upsurge is driven by stronger economic conditions in high-income economies (particularly the United States) and an increase in oil prices up to October 2018, which had a positive impact on remittance outflows from some Gulf countries (such as the United Arab Emirates, which reported 13 percent growth in outflows in the first half of 2018). | Leader | | 41 | Costs | Cost of sending remittances from India to Nepal was below 2% and from Singapore to India was in the range between 2% to 4% in the year 2018. The costs were high for remittances from Japan and South Africa and low for remittances from Russia. | Moderate |
Appendix Glossary | Sr No | Term | Definition | | 1 | Alternate payments | Methods of payment that are not linked to the card brand networks. | | 2 | ATM | Automated teller machines (ATMs) are terminals that allow authorised users, typically by using a card, to access a range of services such as cash withdrawals, balance enquiries, transfers of funds and/or acceptance of deposits. | | 3 | Cards | Cards are payment instruments based on a unique number that can be used to initiate a payment, cash withdrawal or cash deposit that is processed using / over a card scheme or – for withdrawals and deposits at the ATM – within the network operated by the issuer of the card. For the purpose of this exercise cards means debit and credit cards, unless otherwise stated. | | 4 | Cash or currency in Circulation | Currency in circulation is a currency that is physically used to conduct transactions between consumers and businesses rather than stored in a bank, financial institution or central bank. This includes both Banknotes in circulation and coins in circulation. | | 5 | Cheques | Cheques are payment instruments based on written orders from one party (the drawer) to another (the drawee, normally an account holder of a bank) requiring the drawee to pay a specified sum on demand to the drawer or to a third party specified by the drawer. Cheques may be used for settling debts. | | 6 | Credit Transfer | Credit transfers are payment instruments based on payment orders or possibly sequences of payment orders made for the purpose of placing funds at the disposal of the payee. Both the payment orders and the funds move from the payer’s institution to the payee’s institution, possibly via several other institutions as intermediaries and / or one or more payment systems. In India, this consists of RTGS, NEFT, ECS Credit, NACH Credit, IMPS and UPI | | 7 | Digital Payments | Digital payment is a way of payment which is made through digital modes. In digital payments, payer and payee both use digital modes to send and receive money. It is also called electronic payment. No hard cash is involved in digital payments. All the transactions in digital payments are completed online. | | 8 | Direct Debit | Direct debits are payment instruments based on preauthorised debits, possibly recurrent, of the payer’s account by the payee. In India, this comprises of ECS Debit and NACH Debit | | 9 | Domestic Card Network | Card networks are networks of issuing and acquiring banks through which payment cards of certain brand are processed. Domestic card network is such a network that is setup for a specific country. In India, Rupay cards of NPCI operates as a Domestic card network. | | 10 | e-Money | e-Money is prepaid value stored electronically, which represents a liability of the e-money issuer (a bank, an e-money institution or any other entity authorised or allowed to issue e-money in the local jurisdiction) and which is denominated in a currency backed by an authority. In India, Prepaid Payment Instruments issued as Wallets and Cards are included. | | 11 | Fast Payments | Fast payments are payments in which the transmission of the payment message and the availability of “final” funds to the payee occur in real time or near-real time and on as near to a 24-hour and seven-day (24/7) basis as possible. In India, IMPS and UPI are classified as Fast payments | | 12 | GDP | Gross domestic product (GDP) is the monetary value of all the finished goods and services produced within a country's borders in a specific time period. | | 13 | Interchange Fee | Interchange fees are transaction fees that the merchant's bank account must pay whenever a customer uses a credit / debit card to make a purchase from their store. The fees are paid to the card-issuing bank to cover handling costs, fraud and bad debt costs and the risk involved in approving the payment. | | 14 | MDR | The merchant discount rate (MDR) is the rate charged to a merchant for payment processing services on debit / credit card transactions. | | 15 | NFC | NFC (near field communication) is the technology that allows two devices, like a phone and a payments terminal,to talk to each other when they're close together. NFC is the technology that enables contactless payments. | | 16 | Payment Aggregators | Third Party Payment Service Providers / Payment Gateways / Payment Aggregators are service providers who process the payment transactions of e-commerce merchants. Aggregators allow merchants to accept card and bank transfers without having to set up a merchant account with a bank or card association. | | 17 | Payment Systems Transactions | Payment Systems transactions include the total transactions undertaken by all payment systems in the country. In India, this includes, (a) Paper Clearing (CTS, MICR, Non MICR); (b) Large Value (RTGS); (c) Retail Electronic Clearing (ECS, NACH, NEFT); (d) Fast Payments (IMPS, UPI); (f) Card Payments (Credit and Debit Card) and (g) e-Money (PPI Cards and Wallets) | | 18 | Per Capita | Per capita is a Latin term that translates into 'by head,' and basically means the 'average per person. | | 19 | PoS | Point of sale (PoS) terminals are devices typically used at a retail location to capture payment information electronically and – in some cases – on paper vouchers. | | 20 | Retail Payments | Retail payments are payments where at least one of the parties is an end user. This includes payments by institutions offering payment services when they use payment services offered by others to pay their own utility bills, salaries etc. | | 21 | RTGS | Real Time Gross Settlement (RTGS) is a funds transfer system where money is moved from one bank to another in 'real-time', and on gross basis. |
Annex Benchmarking Assessment (A) Regulation 1. Laws in place and scope of regulation 1.1 Key insight: The Reserve Bank’s scope for regulation extends to the whole gamut of payment systems (except payment aggregators) and instruments as also services provided by banks and non-banks. India is one of the few countries that has a specific Payment Systems Law which was enacted in 2007 to “..provide for the regulation and supervision of payment systems in India and to designate the RBI as the authority for the purpose and for matters connected therewith or incidental thereto.” However, in order to maintain public confidence in the payment systems, entry and exit of operators is regulated in India, unlike certain other jurisdictions. 1.2 Benchmark Rating: Strong 1.3 Analysis: A sound and appropriate legal framework is generally considered the basis for an efficient payment systems. The legal environment should include (i) laws and regulations of broad applicability that address issues such as insolvency and contractual relations between parties; (ii) laws and regulations that have specific applicability to payment systems (such as legislation on electronic signature, validation of netting, and settlement finality); and (iii) the rules, standards, and procedures agreed by the participants of a payments system. Regulation is, therefore, important for the development and orderly functioning of not only the financial services but also the payment systems. India enacted the Payment and Settlement Systems Act in 2007 (P&SS Act) which states that the payment and settlement systems serve as the backbone of financial system of the country. The key task of the central bank, inter alia, is to maintain public confidence in money and in the instruments and systems used to represent money and means of its exchange. Therefore, given the significant public interest involved, central banks’ involvement in payment and settlement systems encompass regulation and supervision, operations and at times providing liquidity support to payment systems. Central banks also act as a catalyst for development of robust payment systems. Central banks are focussing more and more on promoting e-inclusion, fostering fintechs, and beefing up security and data protection regulations. | Table 1: Regulation Scope and Legal Basis | | Country | Scope | Legal basis | | Retail Payment Systems | Retail Payment Instruments | Retail Payment Services provided by banks | Retail Payment Services provided by non-banks | Central Bank Law | Payment Systems Law | Other Laws | | Australia | Y | Y | Y | Y | Y | Y | Y | | Brazil | Y | Y | Y | | | Y | Y | | China | Y | Y | Y | Y | Y | | Y | | ECB | Y | Y | Y | Y | Y | | | | France | Y | Y | Y | Y | Y | Y | | | Germany | Y | Y | Y | Y | Y | | | | Hong Kong SAR | Y | Y | Y | Y | | Y | | | India | Y | Y | Y | Y | Y | Y | | | Indonesia* | | | | | | | | | Italy | Y | Y | Y | Y | | | Y | | Japan | Y | | | | Y | | | | Mexico | Y | Y | Y | Y | Y | Y | Y | | Russia* | – | – | – | – | | Y | | | Saudi Arabia | Y | Y | Y | Y | Y | | Y | | Singapore | Y | Y | Y | Y | | Y | | | South Africa | Y | Y | Y | Y | Y | Y | | | South Korea | Y | Y | Y | Y | Y | | Y | | Sweden | Y | | | | Y | | | | Turkey | Y | | | | Y | | Y | | United Kingdom* | | | | | | | | | United States | Y | Y | Y | | Y | Y | Y | Source: Survey conducted by the Working Group on Central Bank Involvement in Retail Payments, 2012 (CPSS, BIS)
* Data not available | 2. Regulation of costs of payment systems 2.1 Key insight: In India there exists a stipulation that the Merchant Discount Rate (MDR) should be borne by the merchant and not passed on to the customer. To promote digital transactions, the Central Government has been, reimbursing bearing the MDR charges on transactions with values up to Rs.2000 made through debit cards, BHIM UPI and Aadhaar-enabled payment system; this facility is available till December, 2019. The Reserve Bank has also prescribed the maximum charges that can be levied by banks for transactions undertaken through National Electronic Funds Transfer (NEFT) system and the Real Time Gross Settlement (RTGS) System. 2.2 Benchmarking rating: Leader 2.3 Analysis: The cost of digital transactions is an inhibiting factor for the growth of digital transactions. Merchants have to cash out or transfer to their banks accounts at a cost and at times these costs are passed on to the consumer. A few countries have tried to regulate costs in order to ensure that the charges are not usurious, but the jury is still out on whether such a regulation promotes the growth of digital payments as with banks pushing and merchants pulling, it isn’t clear if such caps will discourage use of cash. Anecdotal evidence for countries which have intervened in costs shows that it has led to reduction of interchange fees, higher acceptance of credit cards, wider proliferation of NFC (near field communication) terminals, introduction of new fees by schemes (e.g. “non-contactless payment” fee) and decreased revenue for card issuers with no indication that costs for consumers have decreased. | Table 2A: Interchange Fees – Caps | United States Caps: 0.05%+$0.22
Exemptions: credit cards, small issuers, commercial cards
Methodology: Cost Plus | Canada Caps: 1.5% weighted average for Visa / Master card credit
Exemptions: zero interchange for local debit card network
Methodology: N/A | China Caps: 0.35% for debit cards & 0.45% for credit cards
Methodology: Unknown | Australia Caps: weighted average of 0.5% for credit cards; weighted average of 0.08% for debit cards
Methodology: Cost Plus | India [Merchant Discount Rate (MDR)] In India, the interchange rate is not prescribed by the regulator. However, ceilings on MDR was introduced in 2012. The present MDR prescribed is given below:
Caps:
(a) For merchants with turnover <=20 lakh: 0.4% for physical POS infrastructure (including online card transactions) & 0.3% for QR Code based transactions, up to a max of Rs.200
(b) For merchants with turnover >20 lakh: 0.9% for physical POS infrastructure including online card transactions & 0.8% for QR code based transactions, up to a max of Rs.1000
Exemptions: credit cards
Methodology: N/A | EU Caps: Credit card 0.3% of the transaction value
- Debit card 0.2% of the transaction value
Exemptions: Commercial cards, Payment cards issued by three party payment card schemes
Methodology: Merchant Indifference Test (MIT) Maximum Multilateral Interchange Fee (MIF) |
| Table 2B: NEFT – Maximum customer charges that can be levied by banks in India | | Value Band (amount in INR) | Maximum charges (exclusive of tax, if any) (INR) | | Up to 10,000/- | 2.50 | | From 10,001 to 1 lakh | 5.00 | | Above 1 lakh and up to 2 lakh | 15.00 | | Above 2 lakh | 25.00 |
| Table 2C: RTGS– Maximum customer charges that can be levied by banks in India | | RTGS Transaction (amount in INR) | Maximum charges (exclusive of tax, if any) (INR) | | Inward Transactions | Free | | Outward Transactions | | | 2 lakh to 5 lakh | 25.00+applicable time variable charges (maximum 30.00) | | Above 5 lakh | 50.00+applicable time variable charges (maximum 55.00) | (B) Cash 3. Cash in Circulation per capita 3.1 Key insight: India with cash equivalent USD 218 per capita in 2017, scores highly over even developed countries with regard to low per capita cash in circulation. While, it is a fact that a high numerator is divided over a high denominator, the per capita availability of cash is quite low when compared to most countries. 3.2 Benchmarking rating: Strong 3.3 Analysis: This indicator measures cash or currency in circulation per inhabitant. This indicator may also be a proxy for low income levels. Currency or cash in circulation is a currency that is physically used to conduct transactions between consumers and businesses rather than stored in a bank, financial institution or central bank. It is the cash issued by the central bank, less cash holdings with banks. This includes both Banknotes in circulation and coins in circulation. In 2012, India had lowest cash in circulation at USD 174 per inhabitant and Indonesia was next lowest at USD 186 per inhabitant. The cash per inhabitant continues to be low for India. 4. Cash in Circulation as percent of GDP 4.1 Key insight: India is in the middle with reference to amount of cash in active circulation relative to GDP (10.7% in the year 2017). This contrasts with the earlier parameter in as much as cash handled by the population is not commensurate with their income levels. While India had a rapidly shrinking cash level in 2017 as compared to 2012, other countries with the exception of Brazil, China, Indonesia, Russia, South Africa and Sweden had increasing cash levels. Although cash is deeply embedded in the payment systems in India, planned efforts post-demonetisation have shown that shift from cash to digital can be achieved. 4.2 Benchmarking rating: Moderate 4.3 Analysis: This indicator measures cash in circulation as a percentage of GDP. In 2012, India had a high cash in circulation at 11.59% of GDP with only Japan and Hong Kong being higher (data for Germany, presumably a high cash economy, is not available). Demonetisation and an active growth in GDP brought down the active cash in circulation as a percentage of GDP to 8.70% in 2016 which increased to 10.70% in 2017. The amount of cash in circulation is indirectly related to the use of cash as a payment instrument. It is assumed that having high cash in circulation relative to GDP indicates cash is preferred as a payment instrument. Based on this assumption, India continues to have a strong bias for cash payments. (C) Payment Systems Transactions 5. Payment systems transaction volume and growth 5.1 Key insight: The volume of payment transactions in India grew strongly and steadily at a CAGR of 40% between 2012 and 2017 showing an appetite for modes of payment other than cash. Payment systems volume grew at rates faster than India only in China, Indonesia and Saudi Arabia. The payment system transactions in 2017 grew by 44.8% over the previous year (over a strong year-on-year growth of 56.4% in 2016) even after cash availability normalised after demonetisation showing that non-cash payments were slowly becoming a habit for the users. This is also demonstrated by the growth of 54.3% in the financial year 2018-19 over the previous financial year. 5.2 Benchmarking rating: Moderate 5.3 Analysis: Throughout human history, payment methods have evolved. From livestock to gold coins, cash to cheques, plastic credit cards to e-Money, the journey of payments evolves from the concrete to the abstract. One of the factors that drive the development of an economy is the presence of secure, convenient, accessible and affordable payment systems. Payment instruments in India are varied starting from the paper-based payment instruments, to electronic payment instruments, debit cards, credit cards and e-Money. Payment Systems transactions include the total transactions undertaken by all payment systems in the country. In India, this includes, (a) Paper Clearing (CTS, Non MICR); (b) Large Value (RTGS); (c) Retail Electronic Clearing (ECS, NACH, NEFT); (d) Fast Payments (IMPS, UPI); (f) Card Payments (Credit and Debit Card) and (g) e-Money (PPI Cards and Wallets). In terms of volume USA is far above other countries and India is growing at a fast clip.
6. Value of payment systems transactions to cash in circulation 6.1 Key insight: The payment systems transactions at 78.0 times the cash in circulation in the year 2017 establishes that India has a moderately strong bias for cash payments. The ratio in 2016 was 90.9 as demonetisation led to an increase in the ratio, more due to non-availability of cash rather than due to a shift in preference. 6.2 Benchmarking rating: Moderate 6.3 Analysis: The demand for cash remains robust around the world. India is ranked 11 amongst 16 countries for which data is available (data is not available for cash preferred economies like Japan and Germany). Cash, like other forms of money, is used both as a means of payment and a store of value. While good progress have been made in developing alternate modes of payment, demand for cash continues for various reasons. However, this also offers scope for giving further push to efforts at digitizing payments. (D) Cheques 7. Rate of decline of cheques 7.1 Key insight: While India was far behind the United States in the volume of cheques, the decline rate in India was the lowest. Only Turkey posted a decline lower than India {CAGR of -1% between 2012 and 2017}. The slow decline in India in the years 2016 and 2017 was because use of cheques increased in the wake of demonetisation. 7.2 Benchmarking rating: Weak 7.3 Analysis: In most countries cheques have disappeared or are dying a slow death. India’s cheque volume declined by 10.8% between 2012 and 2017 at a CAGR of -2%. The United States of America and Brazil which had a higher volume of cheques in 2012 showed a sharper decline. In India, the year on year growth in 2016 was 10.1% which can be attributed to demonetisation where all modes of payment showed an increase. 2017, however, saw a small decline of 2.9% over the previous year.
8. Cheques volume vs payment systems volume 8.1 Key insight: India’s share of cheque volume relative to all payment instruments was high at 7.3% in the year 2017 keeping it at the bottom of the pile with respect to the countries benchmarked. However, the share reduced to 4.6% in 2018-19. 8.2 Benchmarking rating: Weak 8.3 Analysis: Across the board, cheque volumes have dropped significantly compared to all other payment instruments. We can place the examined countries into three groups: those that are close to eliminating cheques (Australia, China, Germany, Indonesia, Saudi Arabia, South Africa, South Korea, Sweden and Turkey), those that are rapidly reducing cheque usage but still have some way to go (Brazil, Canada, Italy, Singapore and United Kingdom) and those that still have high cheque usage (United States, France, Mexico and India). India is steadily reducing the volume of cheques relative to all other payment instruments. In 2012, cheques made up 43.5% of all India’s payment systems volumes (including all debit and credit card transactions, direct debits, credit transfers and e-Money). Six years later this had dropped to 7.3%. However, India still has considerable ground to cover to catch up with countries that are close to being ‘cheque free’. 9. Cheque instrument features 9.1 Key insight: India has a robust cheque clearing system with a T+1 settlement across the country. This ensured that the economy did not suffer on account of payment and settlement issues when the major mode of settlement, viz., cash, was not in adequate supply. 9.2 Benchmark rating: Leader 9.3 Analysis: In India, the cheque processing system is fast and efficient. We have a T+1 settlement and the cheques processing is mechanised. Standardisation of cheque forms and cheque truncation system (CTS) were the key factors that enabled mechanisation of cheque processing. Benchmarks like – quality of paper, watermark, bank’s logo in invisible ink, void pantograph, etc., and standardisation of field placements on cheques have been prescribed towards achieving standardisation of cheques issued by banks. In truncation instead of the physical cheque, an electronic image of the cheque is transmitted to the paying branch through the clearing house, along with relevant information like data on the MICR band, date of presentation, presenting bank, etc. This effectively eliminates the associated cost of movement of the physical cheques, reduces the time required for their collection and brings efficiency to the entire activity of cheque processing. (E) Debit and Credit Cards 10. Number of debit and credit cards issued 10.1 Key insight: India is second only to China in terms of number of debit cards issued and is a leader in growth. For credit cards, while the growth levels are good and better than all the benchmarked countries, the number of credit cards issued is not very significant when compared to the group. 10.2 Benchmarking rating: Debit Cards: Leader; Credit Cards: Moderate 10.3 Analysis: As at the end of the year 2012, India had 331.60 million and 19.55 million debit and credit cards, respectively; which grew to 861.70 million and 37.49 million, respectively as at the end of the year 2017. As on March 31, 2019 the number of debit and credit cards issued were 925 million and 47 million, respectively. In respect of debit cards, India is second only to China. An interesting fact is that while the debit cards issued were 861.70 million, as per the socio-economic profile (Table 25C), only 33% of the population reported having a debit card in 2017. This could be because of some persons having multiple cards and others none. In credit cards, while the growth is strong and better than all the benchmarked countries, there is still a lot of catching up to do so far as total number of cards is concerned. The reasons for low credit card usage in India are, (a) demand – where Indian households are traditionally oriented towards savings; (b) supply – with a majority of the labour force occupied in the unorganised sector with the card issuers in all probability unwilling to take higher credit risks and, (c) the Indian ethos to pay for goods and services on purchase instead of running up credit lines.. 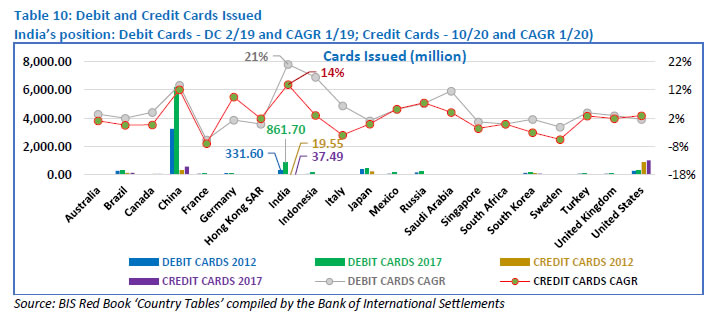 11. Share of debit and credit cards in payment systems (Volume) 11.1 Key insight: Debit and Credit cards made up 29.9% of India’s payment systems volume in the year 2017. Based on the mix of the countries benchmarked, India is in the lower rung and ranks higher than only Germany and Indonesia. In terms of volume, however, India was moderate with a strong CAGR (Table 14). As per the data available with the Reserve Bank, India’s debit and credit card share was 25% of the payment systems volume in the financial year 2018-19. 11.2 Benchmarking rating: Weak 11.3 Analysis: The world over people are using cards for making payments more frequently and even for smaller transactions. India’s credit and debit card transactions, while lower than most countries, had a remarkable CAGR of 40% between 2012 and 2017 (Table 14). The growth was driven, in part, by more people holding debit and credit cards and growth in the number of point of sale (PoS) terminals. 12. Point of Sale (PoS) Terminals Deployed 12.1 Key insight: India had made considerable progress in deployment of PoS terminals and the number is higher than all countries with the exception of Brazil and China. Over the period between 2012 and 2017, India had a CAGR of 29% which is next only to China’s CAGR of 34%. 12.2 Benchmarking rating: Strong 12.3 Analysis: In terms of absolute number of PoS, terminals India evidenced a strong position with 30,83,000 PoS terminals in service as at the end of the year 2017. Between 2012 and 2017 China, India, Russia and Saudi Arabia have shown a strong growth. As on March 31, 2019 the number of PoS terminals in service in India was 37,22,229. 13. People per PoS Terminals 13.1 Key insight: Although India had made considerable progress with reference to the absolute number of PoS terminals deployed, it has a long way to go for reaching them out to its population. 13.2 Benchmarking rating: Weak 13.3 Analysis: While India ranks highly in terms of number of PoS terminals deployed, its ranking is weak in terms of availability of PoS terminals to consumers. India had 30,83,000 PoS terminals in service at the end of the year 2017 which equates to 427 people for each terminal which improved significantly from 1446 people for a terminal in 2012. 14. Debit and Credit Card Payments 14.1 Key insight: India is slowly and steadily moving away from cash for making payments at retail outlets. The volume of card payments grew by a CAGR of 40% from 880 million transactions in 2012 to 4799 million transactions in 2017. 14.2 Benchmarking rating: Moderate 14.3 Analysis: While India’s performance was better than Germany, Italy, Indonesia, Mexico, Singapore, South Africa, Saudi Arabia, Sweden and Turkey, it lags far behind China, Russia, Brazil, UK and USA in this aspect. (F) Cash vs Debit and Credit Cards 15. Debit and Credit Card payments vs currency in circulation 15.1 Key insight: India is at the lower rung of the benchmarked countries in respect of the value of debit and credit card spending relative to the cash in circulation. 15.2 Benchmarking rating: Weak 15.3 Analysis: India’s debit and credit card payments is 0.5 times the cash in circulation. This is one of the lowest ratios amongst the benchmarked countries. The result is a combination of India having high levels of cash and low card usage. Indonesia and Japan have ratios comparable with that of India. (G) Cash and Automated Teller Machines (ATMs) 16. ATMs Deployed 16.1 Key insight: India is next only to China in terms of the number of ATMs deployed and it also had a strong CAGR of 14% during the period between 2012 and 2017. While this is good from customer service perspective, it also depicts a high demand for cash. 16.2 Benchmarking rating: Leader 16.3 Analysis: As at the end of the year 2017, India had 222300 ATMs and was second only to China which had 961000 ATMs. As on March 31, 2019 the number of ATMs in India dropped to 221703. 17. People per ATM 17.1 Key Insight: Like PoS terminals, although India has made considerable progress with reference to the absolute number of ATMs deployed, it has a long way to go for reaching them out to its population. All countries in the benchmarked group have a better deployment rate. The silver lining, however, is that the availability has doubled over the six year period between 2012 and 2017 with dependency reducing from 10832 persons per ATM in 2012 to 5919 persons per ATM in 2017. 17.2 Benchmarking rating: Weak 17.3 Analysis: India is a cash dependent economy. While the number of ATMs available is second only to China, as mentioned earlier, deployment of more ATMs, erspecially in the semi-urban and rural areas are necessary to serve a large population. 18. Count of Cash withdrawal at ATMs per capita 18.1 Key insight: In 2017, Indians attained a low 7 ATM withdrawals per person which was better than all the benchmarked countries. While this ratio normally indicates less cash dependency, the truth is that in India access to ATMs is low (numerator) and the population is high (denominator), hence a good ratio. In addition, there is a limit on the number of times cash can be withdrawn from ATMs in a month without any charges which acts as a deterrence at times. 18.2 Benchmarking rating: Leader 18.3 Analysis: This ratio is also an indicator of the cash dependency of the economy. In terms of number of annual ATM withdrawals per capita, India’s 2017 level is better than countries which are less dependent on cash than India. Cash dependency increased in most countries except Australia, France, Germany, Singapore, Sweden and UK which had reduced withdrawals. The large increase in cash withdrawal in India can also be attributed to demonetisation in late 2016 where people had to go to the ATMs frequently on account of the limits imposed on a single withdrawal. In Sweden, going cashless is the norm, especially in large cities. Purchases are done through cards or digital medium like Sweden’s most popular payment app, Swish. Many restaurants have stopped accepting cash. Busses and trains do not accepts notes and coins. This did not cause an adverse reaction in Sweden as everybody had an alternate payment system. Sweden being a pioneer in digital technology has facilitated its move to a cashless society. Strong broadband coverage even in remote areas and a tech savvy population have also contributed. The dependence on cash can be done away in India only when an alternate is made available to each and every person and the infrastructure is expanded. 19. ATM Withdrawal vs cash in circulation 19.1 Key insight: India has one of the lowest ratios of ATM cash withdrawal relative to cash in circulation. This is because of the high level of cash in circulation, low per-capita availability of ATMs (5919 people per ATM in the year 2017– refer Table 17) and restriction on number of free withdrawals. It is also an indicator of low efficiency in recycling cash, i.e., the cycle withdrawing cash, making payments with it and in turn making deposits through the banking system. 19.2 Benchmarking rating: Weak 19.3 Analysis: The value of withdrawal from ATMs is 1.6 times the amount of cash in circulation. This takes off from the earlier analysis at indicator 6 (para 6.3), about the uses of cash as means of payment and as a store value. In India, ATMs dispense higher denomination notes. (H) Domestic Card Networks 20. Presence of Domestic Card network and its share 20.1 Key insight: India, with Rupay launched in 2012, is a late entrant in the market. In 2017, the share of Rupay was 15% of the total cards issued in India. It is reported that about 586 million RuPay cards have been issued as of March 31, 2019 by nearly 1,100 banks giving it more than 50% share in the country’s debit cards issued. The drive for a less cash economy in the wake of demonetisation and issue of RuPay cards for basic savings bank deposit (BSBD) accounts promoted usage of RuPay cards in the interiors of the country where paying with a card was a novelty just five years back. 20.2 Benchmarking rating: Moderate 20.3 Analysis: Many types of payments usually done with cash are moving electronic. Countries that encourage domestic cards have been faster in moving away from cash. The use of domestic cards in various countries in the year 2017 is given in Table 19. To increase its acceptance around the world, RuPay has tied up with other payment networks like UnionPay (China), JCB (Japan), NETS (Singapore), BCCard (South Korea), Elo (Brazil) and DinaCard (Serbia), in addition to Discover and DinerClub. France and Germany have more than 90% domestic cards usage. Countries where the domestic cards are widely used promote their networks and have tie ups with Visa and Master only for international transactions. | Table 20: Domestic Card Usage | | India’s Position: 10/19 | | Sl No | Country | Domestic Card Networks* | Year | Card Network Share (%) 2017 | | VISA | MASTER CARD | DOMESTIC* | AMEX | DINERS | Others | | 1 | Australia | eftpos | 1984 | 38 | 29 | 25 | 8 | | | | 2 | Brazil | Elo, Itau Unibanco | 2011 | 39 | 45 | 13 | 1 | | 1 | | 3 | Canada | Interac | | 39 | 24 | 35 | 3 | | | | 4 | China | Unionpay | 2002 | | | 99 | | | 1 | | 5 | France | Cartes Bancaires | | | 2 | 91 | 1 | | 5 | | 6 | Germany | Girocard | 2007 | 14 | 12 | 71 | 2 | | | | 7 | Hong Kong | EPS, China Unionpay | 1985 | 15 | 12 | 62 | 7 | | 4 | | 8 | India | Rupay | 2012 | 48 | 33 | 15 | 4 | | | | 9 | Indonesia | | | 44 | 47 | | | | 9 | | 10 | Italy | Bancomat
| | 24 | 27 | 44
| 1 | | | | Poste Italiane ApA | | | | 4 | | | | | 11 | Japan | JBC
| | 39 | 20 | 29
| 3 | | | | J-Debit | | | | 8 | | | | | 12 | Mexico | Carnet | 2011 | 60 | 33 | 2 | 5 | | | | 13 | Russia | MIR, Golden Crown | 2017, 1994 | 45 | 37 | 14 | | | 3 | | 14 | Saudi Arabia | | | | | | | | | | 15 | Singapore | NETS | 1985 | 32 | 24 | 37 | 5 | 1 | | | 16 | South Africa | | | 50 | 48 | | 1 | | | | 17 | South Korea | Sinhan Financial Group; BC Card; KB Kookmin Card Co Ltd; Samsung Card; Hyundai Card | | 21 | 14 | 10; 8; 7; 6; 5 | | | | | 18 | Sweden | | | 33 | 64 | | 2 | 1 | | | 19 | Turkey | | | 55 | 43 | | 1 | | 1 | | 20 | UK | | | 85 | 14 | | 1 | | | | 21 | US | | | 57 | 23 | | 9 | 1 | 9 | | Source: Worldpay Global Payments Report – November 2018 | (I) Credit Transfers 21. Volume and growth of Credit Transfers 21.1 Key insight: India’s credit transfer volumes are strong when compared with the benchmarked countries. It has also exhibited leading growth with a CAGR of 60% between 2012 and 2017 and a year on year growth of 52.9% in 2017. The growth can be attributed to the robust working of well-established credit transfer systems. 21.2 Benchmarking rating: Strong 21.3 Analysis: Credit transfers are payment instruments based on payment orders or sequences of payment orders made for the purpose of placing funds at the disposal of the payee. In India, this can be undertaken using RTGS, NEFT, ECS Credit, NACH Credit, IMPS and UPI. Aggregate credit transfer volumes of majority of the benchmarked countries grew at less than 10% over the previous year with the exception of China, India, Indonesia, Mexico, Saudi Arabia, Singapore and Turkey. China, India and Singapore as evidenced in the later parameters have robust RTGS and fast payment systems. 22. Share of Credit Transfers (Volume) in payment systems 22.1 Key insight: With an efficient credit transfer system in place, India was 2nd amongst the benchmarked countries in the year 2017 with reference to the share of credit transfers in the payment systems. 22.2 Benchmarking rating: Leader 22.3 Analysis: While Indonesia is the leader, Brazil, Germany, Mexico and Sweden also have a reasonable share of credit transfers in the payment systems. India’s share has grown from 19.4% in 2012 to 38.3% in 2017 due to reasons stated in the earlier indicator. (J) Large Value Payments 23. Real Time Gross Settlement (RTGS) 23.1 Key Insight: RTGS which is owned and operated by the Reserve Bank of India, started functioning in 2004; this was upgraded in 2013 when India became the first country to use ISO 20022 standard for RTGS messages. The RTGS offers direct and indirect access to participants and also offers access to intra-day liquidity to eligible participants. 23.2 Benchmarking rating: Strong 23.3 Analysis: Large-value systems are the most significant component of the national payment systems. This is because large-value systems are capable of generating and transmitting disturbances of a systemic nature to the financial sector. Large Value Payment Systems are, therefore, systemically important financial market infrastructure and critical for smooth functioning of the financial system. RTGS systems contribute to the reduction of settlement risk in securities and foreign exchange transactions by facilitating the “delivery versus payment” (DVP) and “payment versus payment” (PVP) mechanisms for settlement of funds leg in INR. Variants of the basic RTGS system, the so-called hybrid systems that take into account liquidity-saving features that exist in net settlement systems have been introduced in some of the benchmarked countries, including India over the years. Domestically located banks, domestically located non-banks, domestically located broker-dealer, domestically located FMIs and foreign branches located in the jurisdiction have direct access to RTGS in India. RTGS can be accessed through web-based portal and proprietary network. In addition, transactions can also be initiated physically at participants’ locations. These features make the system robust and have led to its acceptability and usability. The system is, however, not available 24*7 and there is no technical interoperability with other systems. | Table 23A: RTGS systems | | Jurisdiction | Year of implementation | Name of the RTGS System | Owner/ Operator (CB/ Other) | LSM *(year introduced) | Settlement of retail transactions on a gross basis | Legal requirement to use RTGS to settle certain transactions | Working Days | Operating Hours | | Australia (AU) | 1998 | RITS | CB | ✓ (1998) | ✓ | X | Mon to Fri | 07:30–22:00 | | Brazil (BR) | 2002 | STR | CB | ✓ (2011) | ✓ | ✓ | Mon to Fri | 06:30–18:30 | | Canada (CA) | 1999 | LVTS | Other | ✓ | X | X | Mon to Fri | 00:30-1930 | | China (CN) | 2002 | HVPS | CB | ✓ | ✓ | ✓ | Mon to Fri | 8:30–20:30 | | Euro area (EA) | 2007 | TARGET2 | CB | ✓ (2007) | ✓ | ✓ | Mon to Fri | 19:30–18:00 | | France | | TARGET2-BDF1 | CB | ✓ | ✓ | ✓ | Mon to Fri | 07:00-18:00 | | Germany | | TARGET2-BBk | CB | ✓ | ✓ | ✓ | Mon to Fri | 07:00-18:00 | | Hong Kong SAR (HK) | 1996 | HKD CHATS | Other | ✓ | ✓ | X | Mon to Fri | 08:30–18:30 | | India (IN) | 2004 | RTGS | CB | ✓ | ✓ | X | Mon to Fri, Sat (except 2nd & 4th) | 08:00–20:00 | | Indonesia | 2000 | BI RTGS | CB | ✓ | ✓ | ✓ | Mon to Fri | 07:30–19:00 | | Italy | | TARGET2-BDI | CB | ✓ | ✓ | ✓ | Mon to Fri | 07:00-18:00 | | Japan (JP) | 1988 | BOJ-NET | Other | ✓ | ✓ | X | Mon to Fri | 08:30-21:00 | | | FXYCS | Other | ✓ | ✓ | X | Mon to Fri | 08:30-21:00 | | Mexico (MX) | 2004 | SPEI | CB | ✓ | X | X | 365 | 18:00–17:59:59 | | Russia (RU) | 2007 | BESP | CB | ✓ | ✓ | ✓ | Mon to Fri | 04:00–21:00 | | Saudi Arabia SA) | 1997 | SARIE | CB | ✓ | ✓ | ✓ | Mon to Thu, Sun | 09:00-16:30 | | Singapore (SG) | 2006 | MEPS+ | CB | ✓ (2006) | ✓ | X | Mon to Fri | 09:00–19:00 | | South Africa (ZA) | 1998 | SAMOS | CB | ✓ | ✓ | ✓ | 365 | 00:00–23:59 | | South Korea (KR) | 1994 | BOK-Wire+ | CB | ✓ | ✓ | ✓ | Mon-Fri | 09:00-17:30 | | Sweden (SE) | 2009 | RIX | CB | ✓ (2009) | ✓ | X | Mon to Fri | 07:00–17:00 | | Turkey (TR) | 1992 | EFT | CB | - | ✓ | X | Mon to Fri | 08:30-17:30 | | United Kingdom (GB) | 1996 | CHAPS | CB | ✓ (2013) | ✓ | X | Mon to Fri | 06:00–18:00 | | United States (US) | 1915 | Fedwire Funds Service | CB | X$ | ✓ | X | Mon to Fri, Sun | 21:00–18:30 | Source: RTGS Survey
*LSM means Liquidity Saving Mechanism
$Private Sector LVPS, CHIPS provides some of the functionality of LSM to many of the large Fed Wire Participants |
| Table 23B: RTGS Access | | Jurisdiction | Direct access | Indirect access | Access to intra-day liquidity tied to having an RTGS account | | Groups having direct access1 | Access method2 | Intraday credit3 | Indirect access | Additional conditions for indirect participants4 | | Australia | B, NB, FMI, OD, F | W, PN | YP | ✓ | ✓ | ✓ | | Brazil | B, NB, BD, FMI, O | W, PN | YP | X | - | ✓ | | Canada | B, F | W, S, PN | Y | ✓ | X | ✓ | | China | B, FMI | PN | N | ✓ | X | ✓ | | Euro area | B, NB, FMI, F, O | W, S, T | YP | ✓ | ✓ | ✓ | | Hong Kong SAR | B | S | Y | X | - | ✓ | | India | B, NB, BD, FMI, F, O | W, PN, O | YP | ✓ | ✓ | ✓ | | Indonesia | B, FMI, O | PN | YP | X | - | ✓ | | Japan | B, BD, FMI, F, O | T, PN, O | YP | X | - | ✓ | | Mexico | B, NB, BD, FMI | T, PN | YP | X | - | X | | Russia | B, FMI, F | PN | YP | X | - | X | | Saudi Arabia | B, FMI | PN | Y | X | X | ✓ | | Singapore | B, FMI, F, O | W, S | Y | ✓ | X | ✓ | | South Africa | B, FMI, F, O | W, S | YP | ✓ | X | ✓ | | South Korea | B, NB, BD, FMI, F, OD | T, PN | YP | X | - | ✓ | | Sweden | B, BD, FMI, F, O | W, S, O | Y | X | - | ✓ | | Turkey | B | PN | Y | X | - | X | | United Kingdom | B, NB, BD, FMI, OD | W, S | YP | ✓ | ✓ | ✓ | | United States | B, FMI, F, O, OD | W, PN, O | YP | ✓ | X | ✓ | 1 B – domestically located bank; NB – domestically located non-bank; BD – domestically located broker-dealer; FMI – domestically located FMI; OD – other domestically located; F – foreign branches located in the jurisdiction; O – other.
2 W – web-based portal; S – Swift; T – other dedicated terminals; PN – proprietary network; O – other.
3 Y – yes to all direct participants; YP – yes but not to all direct participants; N – no.
4. – not applicable.
5 Few institutions can access without account for specific purposes.
Source: RTGS survey. | (K) Fast Payments 24. Channels in which fast payments are available 24.1 Key insight: India is one of the few countries which has fast payment systems in the form of IMPS and UPI. IMPS stared functioning as early as 2010 and scores over fast payment systems in other countries as it is available through all the channels (online, mobile, physical and IVR). UPI which was introduced in 2016 has the convenience of not requiring the need for providing card numbers, IFSC codes or account numbers for transactions. IMPS also. 24.2 Benchmarking rating: Strong 24.3 Analysis: Payment systems are becoming faster and more convenient. Fast payments can be defined by two key features: speed and continuous service availability. Based on these features, fast payments can be defined as payments in which the transmission of the payment message and the availability of final funds to the payee occur in real time or near-real time and are available on as near to a 24-hour and 7-day (24/7) basis as possible. The concept of fast payment systems is not new. Amongst the benchmarked countries, Japan and South Korea have had payment systems with some fast payment capabilities for years and they continue to enhance these systems to meet the demand of end users. In India, there are over 1 billion mobile subscriptions as at the end of the year 2018. Leveraging this high mobile density, many payment service providers (PSPs) utilise mobile payment apps to link underlying payment instruments, such as bank accounts or e-Money, with mobile phone numbers for fast payments. To include users with non-smartphone devices, an interoperable platform based on the Unstructured Supplementary Service Data (USSD) channel connecting all the telecom service providers in the country has also been implemented. The subscribers use a single code *99# to access this service to make P2P payments via the UPI. In addition, the Unified Payment Interface (UPI) system brings a complete interoperability for merchant payments as well as P2P payments. The UPI enables users to link their bank accounts with their mobile phone numbers through an application provided by the service providers and obtain a virtual address which can be used for making and receiving payments. | Table 24: Fast Payments | | India’s position: 2/10 | | Country | System | Year of implementation | Online | Mobile | Physical channels | Other | Inter-PSP settlement Model | | Australia | New Payments Platform (NPP) | 2017 | | | | | Real Time | | Brazil | Nil | | | | | | | | Canada | Nil | | | | | | | | China | Internet Banking Payment Systems (IBPS) | 2010 | Y | Y | Y | | Deferred Net | | France | Nil | | | | | | | | Germany | Nil | | | | | | | | Hong Kong | Faster Payment System (FPS) | 2018 | Y | Y | | | Real time | | India | Immediate Payment Services (IMPS) | 2010 | Y | Y | Y | IVR | Deferred Net | | India | Unified Payment Interface (UPI) | 2016 | | Y | | | Deferred Net | | Indonesia | Nil | | | | | | | | Italy | Jiffy | 2014 | | Y | | | Deferred Net | | Japan | Zengin Data Telecommunication System | 2018 | | | | | Deferred Net | | Mexico | SPEI | 2015 | Y | Y | Y | | Real Time | | Russia | Nil | | | | | | | | Saudi Arabia | Future Ready Arch (FR-ACH) | | | | | | Deferred Net | | Singapore | Fast and Secure Transfers (FAST) | 2014 | Y | Y | Y | | Deferred Net | | South Africa | Real Time Clearing (RTC) | 2006 | | | | | Deferred Gross | | South Korea | Electronic Banking System (EBS) | 2001 | Y | Y | | IVR | Deferred Net | | South Korea | CD/ATM | 2007 | | | Y | | Deferred Net | | Sweden | Bir/Swish | 2012 | | Y | | | Real Time | | Turkey | BKM Express | 2013 | | Y | | | Deferred Net | | United Kingdom | Fast Payment Services (FPS) | 2008 | Y | Y | Y | Phone | Deferred Net | | United States | Nil | | | | | | | | Source: CPMI Report on Fast payments Enhancing the speed and availability of retail payments, November, 2016 | (L) Direct Debits 25. Volume and growth of Direct Debits and Growth 25.1 Key insight: In the year 2017, India’s direct debit was ranked 12th out of the 17 benchmarked countries for which data is available, which was lower than the 2nd position (out of 21 benchmarked countries) in respect of credit transfers. The growth, however, was good. 25.2 Benchmarking rating: Weak 25.3 Analysis: Direct debits are payment instruments based on preauthorised debits, possibly recurrent, of the payer’s account by the payee. In India, this comprises of ECS Debit and NACH Debit. While the volumes in India are low, the growth is next only to Saudi Arabia. Direct debit, typically, has been an alternate to cheques for repetitive payments due to its convenience. 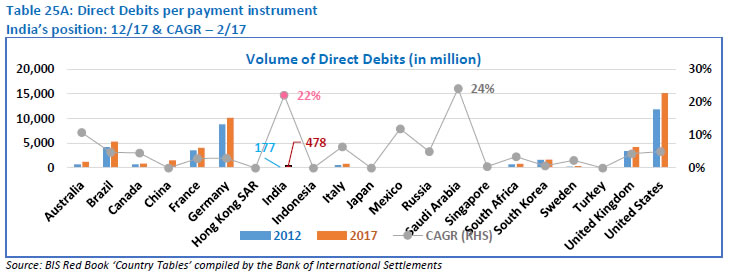 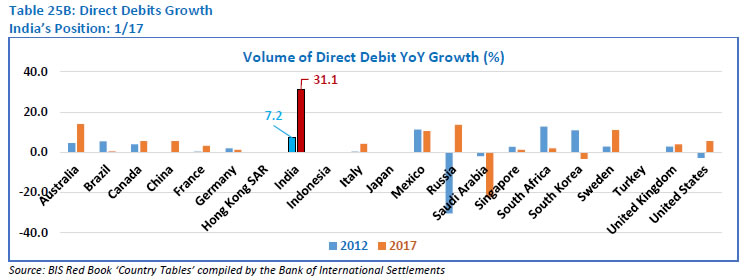
| Table 25C: Socio-economic profile | | Country | Income Category | Savings (%) | Card Ownership (%) | Financial Inclusion (%) | Paid Utility Bills in the past year (%) | | Saved in a financial institution (FI) | Saved any money in the past year | Debit Card | Credit Card | No deposit or WD from A/c in past year | No A/c as FI is too far away | No A/c because of lack of docs | No A/c because of lack of Trust in FI | | Australia | High Income | 62 | 79 | 90 | 60 | 4 | | | | 80 | | Brazil | Upper Middle Income | 14 | 32 | 59 | 27 | 13 | 11 | 7 | 9 | 63 | | Canada | High Income | 68 | 80 | 97 | 83 | 2 | | | | | | China | Upper Middle Income | 35 | 51 | 67 | 21 | 16 | 6 | 3 | 2 | 67 | | France | High Income | 48 | 63 | 85 | 41 | 4 | | | | | | Germany | High Income | 55 | 76 | 91 | 53 | 5 | | | | 88 | | Hong Kong | High Income | 51 | 61 | 83 | 65 | 6 | | | | 59 | | India | Lower Middle Income | 20 | 34 | 33 | 3 | 46 | 5 | 5 | 4 | 42 | | Indonesia | Lower middle income | 22 | 62 | 31 | 2 | 15 | 19 | 15 | 5 | 74 | | Italy | High Income | 45 | 62 | 85 | 42 | 5 | | | | | | Japan | High Income | 64 | 78 | 87 | 68 | 7 | | | | | | Mexico | Upper Middle Income | 10 | 41 | 25 | 10 | 7 | 21 | 19 | 27 | 58 | | Russia | Upper Middle Income | 14 | 36 | 57 | 20 | 7 | 6 | 4 | 14 | 76 | | Saudi Arabia | High Income | 14 | 44 | 67 | 16 | 11 | 4 | 7 | 3 | 39 | | Singapore | High Income | 67 | 77 | 92 | 49 | 8 | | | | 56 | | South Africa | Upper Middle Income | 22 | 59 | 34 | 9 | 14 | 12 | 9 | 11 | 47 | | South Korea | High Income | 55 | 69 | 75 | 64 | 2 | | | | 76 | | Sweden | High Income | 75 | 83 | 98 | 45 | 1 | | | | | | Turkey | Upper Middle Income | 23 | 39 | 63 | 42 | 7 | 4 | 5 | 9 | 62 | | United Kingdom | High Income | 64 | 74 | 91 | 65 | 3 | | | | 85 | | United States of America | High Income | 62 | 79 | 80 | 66 | 5 | | | | 79 | | Source: Global Findex Survey 2017 conducted for World Bank | 26. Share of Direct Debits in payment systems 26.1 Key insight: India’s share of direct debits in payment systems was low at 3.0% in the year 2017. It may also be noted that other forms of alternate payments have picked up and are being preferred over direct debits. 26.2 Benchmarking rating: Weak 26.3 Analysis: Direct debits as a mode of payment are mainly preferred in countries where larger percentage of population saves in financial institutions (Australia, UK, USA and Korea). Other benchmark countries have been orienting towards other modes of payments. (M) e-Money 27. Availability of alternate payments for retail transactions 27.1 Key insight: India has developed a number of alternate payment channels. Although behind China, India has a decent 26% of online transactions using e-Money. It is far above other developed countries where cards, especially credit cards are predominantly used. In India, on account of e-payments, the financial system has leapfrogged the use of cards and moved to e-payments in large numbers. 27.2 Benchmarking rating: Leader 27.3 Analysis: New electronic payment (e-payment) services are emerging which are increasingly instant, ubiquitous and available around the clock. Electronic payments boost economic growth while advancing financial inclusion. For these reasons, countries are working to make payment systems less dependent on cash and there is a thrust to move towards a cashless society with countries embarking on a “cashless journey.” The most straight-forward approach to have a digital push would be to target the generation which is most responsive to technology and digital age. Since India has a large population of Millennium Children or Generation Y (individuals born between 1982 and 2004), the aptitude for digital products is large and possibly larger than countries such as Japan and Europe which have an aging population. This generation is also ready to try out new payment systems / channels as long as the rewards are good. The key reasons for acceptance of digital payments in India are enumerated in Table 27B. Payment service providers (PSPs) can, therefore, personalise rewards beyond cash-backs to co-market with merchants and create loyalty programmes. Such incentive programmes help in driving and sustaining mass adoption and engagement. | Table 27A: Alternate Payments | | India’s Position: 3/20 | | Sl No | Country | Popular Alternate Payment Methods | Share by Payment Method – e-Money | | 1 | 2 | on line transactions | Retail Stores | | 1 | Australia | PayPal | BPay | 18 | 2 | | 2 | Brazil | Paypal | Boleto Bancario | 13 | 3 | | 3 | Canada | Paypal | Interac Online | 16 | 1 | | 4 | China | Alipay | Wechat pay | 65 | 36 | | 5 | France | Paypal | Masterpass | 21 | 1 | | 6 | Germany* | Paypal | Klarna | 20* | 5 | | 7 | Hong Kong | Paypal | Alipay | 25 | 4 | | 8 | India | Paypal | PayTM, MobiKwik, Citrus, Oxygen | 26 | 6 | | 9 | Indonesia | Paypal | KU Wallet | 24 | 5 | | 10 | Italy | Paypal | Postepay | 31 | 2 | | 11 | Japan | Konbini | RPay | 3 | 3 | | 12 | Mexico | Paypal | mercado Pago | 14 | 3 | | 13 | Russia | Paypal | Webmoney | 24 | 2 | | 14 | Saudi Arabia | Data not available | | 15 | Singapore* | Paypal | Masterpass | 10* | 4 | | 16 | South Africa | Paypal | Masterpass | 17 | 5 | | 17 | South Korea | SamsungPay | KokaoPay | 10 | 3 | | 18 | Sweden | Klarna | Swish | 7 | 2 | | 19 | Turkey | BKMExpress | 3pay | 4 | 2 | | 20 | UK | Paypal | VISA Checkout | 23 | 5 | | 21 | US | Paypal | VISA Checkout | 20 | 3 | Source: Worldpay Global Payments Report – November 2018
*Worldpay Report has included prepaid credit cards under credit cards and not under e-Money |
 28. Volume and growth of e-Money 28.1 Key insight: With 3459 million e-Money transactions, India was behind only Japan and USA (data on China not available) in 2017 with respect to volume of e-Money transactions. The availability of various alternate payment systems has helped its growth. 28.2 Benchmarking rating: Strong 28.3 Analysis: e-Money is prepaid value stored electronically, which represents a liability of the e-money issuer (a bank, an e-money institution or any other entity authorised or allowed to issue e-money in the local jurisdiction) and which is denominated in a currency backed by an authority. In India, Prepaid Payment Instruments are issued as Wallets and Cards. Singapore has a significant number of pre-paid cards (including pre-paid credit cards) which is reported in Red Book as e-Money and not under cards. Sweden had a growth of 90.8% in 2016 due to expanding digital transactions and non-acceptability of cash as a mode of payment at most places as detailed in indicator 18. According to GlobalData, a data and analytics company, the e-Money in India is poised for significant growth as Indian consumers are increasingly turning away from cash and card. According to the 2017 Consumer Payments Insight Survey by the company, India is one of the top markets globally in terms of e-Money adoption with 55.4% survey respondents indicating that they have e-Money and use it. India is followed by China and Denmark. The adoption level in India is much higher compared to many of the developed markets such as the US and the UK, where consumers predominantly use cards. Demonetization in November 2016 was a game-changer for e-Money as people switched to electronic-modes of payments resulting in a year on year growth of 162.5% in the year 2016. While medium to large-value transactions continue to be made through digital banking channels and cheques, the low-value day-to-day transactions shifted to e-Money. The growth in 2017 was 120% showing its sustenance and a perceptible shift towards e-Money. 29. e-Money share in payment systems 29.1 Key insight: India has made a significant progress by increasing the share of e-Money in the payment systems from 0.8% in 2012 to 10.3% in 2016 and 21.5% in 2017. While demonetisation gave the necessary fillip, the availability of mobile infrastructure and alternate payment systems ensured that payment systems were not affected when cash was in short supply. 29.2 Benchmarking rating: Leader 29.3 Analysis: Although data for China is not available in the Red Book, as seen in Table 27A, Chinese customers have adopted e-Money like no other nation and the trend does not appear to be slowing. Singapore’s tech-savvy culture and high smart phone adoption rate has helped in changing the payment habits of individuals. In India, while consumers have benefited from convenient payment option and pricing benefits (cashback / discounts), it is the ‘cost-effectiveness’ that appeals to the merchants as the cost associated with e-Money acceptance including setting-up infrastructure and transaction fees is much lower compared to traditional card-based payment system. (N) Digital Utility Payments 30. Digital Payment of Utility Bills 30.1 Key Insights: Only 3% of the population in India used the internet to pay utility bills in the year 2017. There is scope for increased adoption in this sphere of activity (refer Table 25C). 30.2 Benchmarking rating: Weak 30.3 Analysis: The mobile connection are growing at a rapid pace. For every 100 Indians there were 87.28 cellular phones in the year 2017. 293 million Basic Savings Bank Deposit (BSBD) Accounts opened since 2014 is a testimony of the penetration of financial inclusion. However, the challenge is to find a meeting point for the two. India’s performance is abysmally low with reference to using digital means to pay utility bills and accessing financial institution through mobile and / or broadband. India’s standing will improve when banks take advantage of the digital explosion and offer safe and secure payment and remittance options to all their account holders. | Table 30: Digital Payment of Utility Bills | | India’s Position: 21/21 | | Country | Income Category | % of Population | | Utility bills paid in the past year | Internet used for utility bills payment in the past year | Internet used for purchases in the past year | Digital payments made / received in the past year | Domestic remittance sent / recd in the past year | Access of FI through mobile / broadband in the past year | | Australia | High Income | 80 | 68 | 68 | 96 | | 68 | | Brazil | Upper Middle Income | 63 | 11 | 14 | 58 | 15 | 13 | | Canada | High Income | 79 | 72 | 69 | 98 | | 70 | | China | Upper Middle Income | 67 | 40 | 45 | 68 | 26 | 40 | | France | High Income | 82 | 43 | 56 | 92 | | 49 | | Germany | High Income | 88 | 58 | 67 | 98 | | 61 | | Hong Kong | High Income | 59 | 45 | 43 | 85 | | 43 | | India | Lower Middle Income | 42 | 3 | 3 | 29 | 19 | 5 | | Indonesia | Lower middle income | 74 | 4 | 10 | 35 | 33 | 7 | | Italy | High Income | 82 | 40 | 55 | 90 | | 22 | | Japan | High Income | 74 | 24 | 46 | 95 | | 33 | | Mexico | Upper Middle Income | 58 | 9 | 7 | 32 | 16 | 6 | | Russia | Upper Middle Income | 76 | 35 | 27 | 71 | 37 | 33 | | Saudi Arabia | High Income | 39 | 31 | 25 | 61 | | 26 | | Singapore | High Income | 56 | 50 | 48 | 90 | 24 | 48 | | South Africa | Upper Middle Income | 47 | 10 | 8 | 60 | 51 | 17 | | South Korea | High Income | 76 | 64 | 72 | 92 | | 67 | | Sweden | High Income | 74 | 80 | 72 | 98 | | 79 | | Turkey | Upper Middle Income | 62 | 33 | 21 | 64 | 29 | 26 | | United Kingdom | High Income | 85 | 62 | 75 | 96 | | 47 | | United States of America | High Income | 79 | 64 | 70 | 91 | | 67 | | Source: Global Findex Survey 2017 conducted for World Bank | 31. Public Mass Transportation 31.1 Key insight: The National Common Mobility Card, also known as One Nation One Card, is an inter-operable transport card conceived by the Ministry of Housing and Urban Affairs of the Government of India. This card would help the cities and people in the task of management and settlement of payment for public transport. The card is an open system which can be used in a bus, train, and metro etc. and will promote digital transaction while using public transport. 31.2 Benchmark Rating: Weak 31.3 Analysis: The ticketing system of public mass transportation is a key feature for ensuring customer convenience. The efficiency of the system is measured through (a) availability of travel chip card for several types of public transport, (b) possibility of remote top-up, (c) availability of mobile ticketing, (d) possibility to buy ticket / chip card using a bank card, (e) possibility to use contactless cards and mobile applications directly at pay gates, (e) possibility to pay for non-transport services using chip card. The ticketing systems of public mass transportation are observed to be more city specific than widespread across a country. The leading cities in this regard are Tokyo, Shanghai, Singapore, Beijing, Hong Kong and Moscow. In Hong Kong, the advanced ticketing system, Octopus chip card is used by 99% of the residents. Singapore uses the EZ-link card, a unified contactless stored-value card, introduced for public transport in 2002 to ensure convenience and flexibility of the Singaporean ticketing system. In Moscow, while mobile ticketing is an alternative payment option, PayPass / Apple Pay / Android Pay are also being introduced. Delhi government started a trial of common mobility card which can be used in both Delhi Transport Corporation (DTC) busses and the metro. Kochi Metro Rail Ltd (KMRL) was the first in the country where the entire public transport systems like bus, metro, and auto rickshaws use a single common card. Kolkata started with Oyster, a multipurpose card system for all transactions. India, however, has a long road to travel. | Table 31: Urban Transportation Systems | | Country | Public Transport Ticketing System | | Australia | Perth: Transperth’s SmartRider, Australia’s first smartcard ticketing system, was introduced in April 2007. SmartRider is used to pay for train, bus, ferry and metered parking in Perth, as well as bus services in the regional centres of Geraldton and Busselton.
Victoria: Conversion to smart card ticketing system was completed in Victoria by 2011. The ticketing system covers 300 kilometres making it one of the largest mass transit smart card systems in the world by geographical area. The system operates across 13 zones of an Australian state and five transport modes, encompassing the metropolitan city’s rail, tram, and bus networks and on regional commuter rail and bus services. The network is made up of more than 480 trams, 265 train stations, 800 retail outlets and 2,400 buses.
The majority of cards (39%) are purchased at retail outlets, followed by regional and metropolitan train stations (34%), and vending machines at train stations and tram stops (14%). Auto top up can be set up through an online account linked to customers’ credit card / bank account. | | Brazil | The rechargeable smart card RioCard is used on buses and trains in the city. The different types of RioCard that can be used are Cartão Unitário (single-ride card), Cartão Bilhete Único Carioca (allows travel on two buses within a maximum period of two hours), Expresso (Electronic purse that allows travel on the subway and on select bus services), Bilhete Único Intermunicipal (single ticket valid in select municipalities), etc.
Rio de Janeiro was the first city in Brazil to launch a programme enabling mobile NFC-based ticketing for public transport. Smartphones can be used as e-Money, with embedded NFC technology enabling secure payment for public transportation tickets. | | China | Beijing has replaced a paper ticket-based system with automatic fare collection through barriers activated by magnetic strip tickets or passes.
Beijing’s public transport payments company Yikatong launched an app for ‘most’ Android devices that allows commutes to ditch their physical card and pay fares via their phone. | | Germany | Tickets are available online and via a smartphone app. The Berlin WelcomeCard is available for tourists that serves as a ticket for local transportation. | | Hong Kong SAR | Hong Kong is actively applying modern technologies, and is among technological leaders. The city’s advanced ticketing system, Octopus chip card, is well known around the world as an example of innovative solutions. It is used by 99 percent of residents and can be used not only to pay for transport and non-transport services, but also for non-payment purposes, such as access control for office buildings. | | India | National Common Mobility Card (NCMC): NPCI was entrusted by Ministry of Urban Development (MOUD) to prepare the standards & specifications of the NCMC. NCMC is an interoperable, open-loop, EMV based contactless payment product. This advanced and secure card can be used for all payment applications including transport (Metro, Bus etc.), toll plazas and shopping. For payments lower than INR 2,000, the customers can simply tap their card and the transactions are processed in a matter of seconds.
Other solutions available in the market are Paytm, Ridlr, DIMTS, Trimax, Paycraft and Asis
Ridlr: The Ridlr application is available to consumers to make payments for public transport (Bus, Metro) through an app on their smartphone. The services are currently available in Mumbai.
PayTM: The PayTM wallet can be used to purchase Metro tickets in cities such as Mumbai, Delhi, and Hyderabad. PayTM wallets can also be used for toll payments at select toll ways across the country and for making payments on taxi services such as UBER and OLA. | | Indonesia | TransJakarta, the Bus Rapid Transit (BRT) system in Jakarta accepts e-tickets issued by several local banks. These e-tickets can be purchased at every TransJakarta shelters, banks (Mandiri, BCA, BRI, BNI, Bank DKI), and merchants such as minimarkets, supermarkets, and gas stations. The same e-ticket card can also be used in KA Commuter Jabodetabek (or more commonly known as Commuterline), the commuter rail system within Jakarta.
The Tap on Bus Validator are also available for ticketing services. The same is operational in TransJakarta, Trans Metro Bandung, Trans Jogja, etc. | | Mexico | A wide range of fare collection options are used: (a) The BRT uses the prepaid contactless electronic smartcard called Metrobus; (b) The light-rail transit (LRT) uses paper tickets for fare collection and turnstiles for access control; (c) The metro uses both magnetic-stripe single-use tickets and prepaid contactless smart cards; and (d) The suburban rail uses a rechargeable electronic card for fare collection. A multimodal transit fare smart card, Tarjeta DF or Federal District Card, launched by US-based ACS, enables riders to seamlessly transfer from the metro to the BRT. | | Russia | In terms of convenience, Moscow’s strongest attributes are its ticketing system and electronic services. The advances include adopting a unified chip card with the possibility of remote top-up and payments for activities beyond transport services, such as museums. Also, a number of alternative payment options are offered, such as mobile ticketing and PayPass / Apple Pay / Android Pay are currently being introduced. Additionally, the Moscow government has recently digitized most of the services and designed a variety of widely used transport apps. Moscow was planning to equip all metro pay-gates with PayPass and PayWave in 2018 | | Saudi Arabia | Riyadh is in the process of implementing latest technology, including contactless payment and near field communication for new public transportation networks which will enable passengers to pay using their mobile phones. The ticketing system will encompass both on-board ticketing sale and validation systems for the anticipated 800- to 1000-vehicle public bus network, as well as sale and access control systems for the over 80 stations and six lines of the metro system. Similar to “smart” ticketing systems in other major metropolises, the Riyadh ticketing system will allow access to the entire public transportation system through a single card or mobile phone application. | | Singapore | The convenience and flexibility of the Singaporean ticketing system is an outstanding feature. The EZ-link card is the unified contactless stored-value card, introduced for public transport in 2002. The scheme successfully blends the major ticketing advances—it can be topped-up via multifunctional EZ-Link App, lets users earn and redeem reward points for all transactions made with the EZ-Link card, including non-transport services. In 2017 LTA piloted paying for bus and train rides with credit cards. | | South Africa | The myconnect card makes it possible for passengers to budget for their travel expenses and use a single, cashless card system to pay for their journey. Passengers using the MyCiTi bus network purchase a myconnect card for R25 from MyCiTi stations or from participating retailers, and load money onto the cards. The myconnect card uses MasterCard’s contactless technology which provides consumers with a safe, easy and convenient way to pay by simply tapping on a specially equipped terminal each time they enter or leave a station or bus. Fares are accurately calculated when they tap in and tap out. | | South Korea | The T-money card is used to pay transportation fare. When a T-money card embedded with a smart chip is brought into contact with a terminal (card reader), the terminal immediately receives the locational information from a satellite. Through radio frequency (RF) communication with the card reader, information is received and sent, such as the location of boarding and whether any transfers were made, thereby completing payment of the fare. When the bus approaches a certain distance of the garage, the payment statements are wirelessly transmitted to a bus aggregation system by a wireless access point (AP) and an aggregation PC. For subways, the payment statements are stored within the card reader. All statements are transferred to and managed by the calculation system at Korea Smart Card, Co., Ltd. for the calculation of fares. | | Turkey | The post office PTT, Turk Telekom communication company, Turkcell mobile phone company, Denizbank, Vakıf Participation Bank, the Istanbul Metropolitan Municipality's Electronic Money and Payment Services Ltd. (BELBİM) were cooperating in order to introduce a new multipurpose payment method. The card, while allowing money transfers and payment services, is basically an integration platform, is expected to allow municipalities across the nation providing public transportation services to amalgamate their payment methods so that people from any province will be able use the card to get on public buses. | | United Kingdom | Ticketing is also among the features residents appreciate at most. Oyster card, which can be used across most of the transport services in London, makes payments more convenient by providing a wide range of online features. | | United States | A few systems such as the New Jersey Transit and Boston’s Massachusetts Bay Transportation Authority have already switched over to mobile.
New York City’s MTA is still solely based on paper ticketing. The MTA plans to roll out a system by 2019 that incorporates near-field communication or radio frequency technology to let consumers tap a key chain, credit card or smartphone to move through turnstiles.
A distinctive feature of Chicago transport is its convenience—the city ensures high travel comfort, advanced ticketing and electronic services, and offers multiple modes of transit. More than 20 apps are available to passengers, with services that have a variety of functions, from real-time information on bus arrival to managing a chip card account.
Chicago Transit Authority is also testing out NFC for a new ticketing system. | (O) Digital Infrastructure 32. Mobile and broadband subscriptions 32.1 Key insight: The growth of infrastructure in India has been phenomenal over the past six years, especially with reference to availability of Mobile Cellular Subscriptions. Only China in terms of connections per million inhabitants has evidenced faster growth. With increased penetration of 3G and 4G even in remote areas, the internet network is rapidly expanding in India and provides a threshold of “Digital Revolution.” There are, however, connectivity issues which need to be addressed. 32.2 Benchmarking rating: Strong 32.3 Analysis: The ways in which we pay for things has changed more in the past 15 years than in the previous 150, and nearly every innovation we have seen has taken a share away from cash. Access to and uptake of new technology and innovation and the quality of infrastructure are important for ensuring safe and quick payments which help in building confidence in the payment systems. The recent developments in Information and Communication Technology (ICT) in general and mobile technology in particular have provided a solid platform for building a new generation of payment technology. While India’s performance has been good in terms of mobile infrastructure, the same cannot be said about broadband. However, since internet for financial transactions is majorly accessed through mobiles, India’s rating is considered as strong. There is nothing to stop the country from becoming a “leader” in this area in case the connectivity improves and is available all over the country. | Table 32: Mobile and Broadband subscriptions | | India’s position: Mobile: 3/21 (growth); Broadband: 19/21 (growth) | | Country | Mobile Cellular Subscriptions
(per 100 people) | Fixed Broadband subscriptions
(per 100 people) | | 2012 | 2017 | Growth (%) | 2012 | 2017 | Growth (%) | | Australia | 106.64 | 112.69 | 5.67 | 25.13 | 32.40 | 28.95 | | Brazil | 123.81 | 113.00 | -8.74 | 9.53 | 13.70 | 43.70 | | Canada | 79.43 | 85.90 | 8.15 | 33.49 | 38.01 | 13.49 | | China | 80.87 | 104.58 | 29.32 | 12.74 | 26.86 | 110.82 | | France | 97.83 | 106.21 | 8.57 | 37.68 | 43.75 | 16.11 | | Germany | 113.98 | 129.09 | 13.25 | 34.49 | 40.45 | 17.30 | | Hong Kong SAR | 230.60 | 249.02 | 7.99 | 31.73 | 35.92 | 13.21 | | India | 68.46 | 87.28 | 27.49 | 1.19 | 1.33 | 12.41 | | Indonesia | 113.29 | 173.84 | 53.45 | 1.20 | 2.29 | 91.04 | | Italy | 162.70 | 141.29 | -13.16 | 23.04 | 27.94 | 21.27 | | Japan | 109.89 | 133.45 | 21.44 | 28.13 | 31.68 | 12.61 | | Mexico | 83.36 | 88.51 | 6.18 | 10.82 | 13.26 | 22.55 | | Russia | 145.07 | 157.89 | 8.83 | 14.59 | 21.44 | 46.97 | | Saudi Arabia | 182.22 | 122.08 | -33.00 | 8.73 | 7.59 | -13.14 | | Singapore | 153.06 | 148.24 | -3.15 | 27.18 | 25.76 | -5.25 | | South Africa | 129.05 | 161.99 | 25.53 | 2.09 | 2.99 | 43.33 | | South Korea | 107.35 | 124.86 | 16.31 | 36.54 | 41.58 | 13.78 | | Sweden | 124.19 | 125.48 | 1.04 | 32.21 | 37.70 | 17.03 | | Turkey | 90.76 | 96.35 | 6.16 | 10.55 | 14.77 | 39.95 | | United Kingdom | 121.91 | 119.63 | -1.87 | 33.75 | 39.31 | 16.47 | | United States | 97.29 | 122.01 | 25.41 | 29.53 | 33.85 | 14.66 | | Source: World Bank - World Development Indicators | (P) Government e-Payments 33.1 Overall 33.1.1 Key Insight: As per the Government E-Payment Adoption Ranking report, despite the fact that India has less than adequate infrastructure (an average category score of 30.1 versus 44.2 across all countries) as well as less sophisticated social, economic context, it performs well on all other four e-payment pillars pushing it to a high rank of 28. India along with Brazil (ranked 17th) and South Africa (ranked 42nd) have implemented more concerted initiatives to facilitate e-payments to and from the State. China (ranked 48th) has witnessed a boom in commercial e-payments; but C2G and G2C electronic transaction services are lower. 33.1.2: Benchmark Rating: Moderate 33.1.3 Analysis: Government payments play a critical role in the development of a national payment system especially in developing economies. Government payments can facilitate economic growth and innovation in the underlying payment system infrastructure and enhance public policy goals such as efficiency, transparency, security of payments as well as financial inclusion. The global e-payments ecosystem continues to evolve at a staggering pace, as traditional concepts of finance, personal identity and trust are toppled by technological advances. Governments have been trying to strike a balance between e-payments’ advantage of increased efficiency in tax collection and social services expenditure and their possible risks. India’s ranking improved from 36 in 2011 to 28 in 2018. Part of the reason for India's progress is the sea change in identity assessment with the introduction of the Aadhaar biometric identity system in 2009. With almost 1.2 billion Indians (more than 99% of the country’s adult population) enrolled in Aadhaar, it is recognised as the world’s largest biometric identity system. The Economist Intelligence Unit in its 2018 Government E-Payments Adoption Ranking has ranked India 28th amongst 75 countries and termed India’s performance as “Intermediate.” 33.2 Citizen to Government (C2G) 33.2.1 Key insight: As per the Government E-Payments Adoption Ranking report, India’s performance is exceptional with reference to payments platform functionality for transaction services, pension contributions, obtaining / paying for an ID card, private transit costs and public transit payments and very strong with reference to income tax payments. 33.2.2 Benchmarking rating: Leader 33.2.3 Analysis: This indicator captures the extent to which individuals can complete various transactions through an e-government platform. France and UAE (the latter not included in this exercise) top the C2G category, reflecting their long-standing commitments to facilitate multiple public services through e-payments and broadening citizen access to them through numerous channels. Some of the areas where France and UAE lead are the existence of a single online and mobile access point for government services and the ease of obtaining and paying for an identification card. Some countries are surging ahead by emulating best practices in a targeted, cost-efficient way or by innovating to meet their needs. The progress achieved by India and Russia, both of which are tied for third place constitutes a remarkable jump from joint 41st in the C2G category in 2011. India’s performance is reflective of some older initiatives, such as a fully electronic pension platform (the National Pension System portal, or eNPS), and also of newer ones, such as the development of an online portal to begin the process of obtaining an ID card. In Mumbai, the traffic police introduced in 2016 an electronic system to automate the issuance and payment of fines for traffic violations. In addition, constables in Mumbai have been equipped with handheld devices through which spot fines can be issued and paid immediately via payment cards or e-Money. Although numerous implementation challenges remain, other Indian cities are already planning to emulate the system. The Economist Intelligence Unit in its 2018 Government E-Payments Adoption Ranking has ranked India 3rd along with Russia, Australia and Hong Kong amongst 75 countries. 33.3 Government to Citizen (G2C) 33.3.1 Key insight: As per the Government E-Payments Adoption Ranking report, India’s performance is exceptional with reference to income tax refunds, pension benefits and government social security payments online but is below average in disbursing unemployment benefits. 33.3.2 Benchmarking rating: Moderate 33.3.3 Analysis: This indicator captures whether various government transfers to individuals can be completed through an e-government platform. Programmes such as Brazil’s Bolsa Familia and India’s Aadhaar, while not without their risks and limitations, have become case studies for government-to-citizen transfers and national digital identification, respectively. One of Aadhaar’s early goals was to improve the efficiency of state aid by linking welfare and other transfers to the unique 12-digit ID numbers tagged to biometric markers. Aadhaar as claimed by the government, reduced leakage from the system (for example through graft by middlemen) and saved USD 8bn in subsidy payments in two and a half years. It is claimed that hundreds of thousands of fake beneficiaries have been expunged. The Economist Intelligence Unit in its 2018 Government E-Payments Adoption Ranking has ranked India 25th amongst 75 countries and termed its performance as “Mature.” 33.4 Business to Government (B2G) 33.4.1 Key insight: As per the Government E-Payments Adoption Ranking report, India scores exceptionally in all the parameters assessed under the indicator, viz., business income tax payments, VAT / sales tax (now GST) payments, business pension contributions, company registration and payment of fees. 33.4.2 Benchmarking rating: Leader 33.4.3 Analysis: This indicator captures the extent to which business can complete various transactions through e-government platforms. Governments around the world have been most proactive about facilitating their own revenues. In particular, almost 90% of governments provide electronic facilities for the filing of income and sales taxes and for the registration of businesses. The Economist Intelligence Unit in its 2018 Government E-Payments Adoption Ranking has ranked India as a joint leader along with several advanced economies. 33.5 Government to Business Payments (G2B) 33.5.1 Key insight: As per the Government E-Payments Adoption Ranking report, India scores very highly for business income tax refunds, VAT / sales tax refunds, payments for goods and services and disbursement of loans. In India, the tax calculation, tracking and refund process is electronic. 33.5.2 Benchmarking rating: Leader 33.5.3 Analysis: This indicator captures the extent to which various government transfers to business can be completed on an e-government platform. There are several developed countries that perform poorly in this indicator. Some countries allow for e-payments of tax refunds but do not offer businesses an easy way to calculate their refunds or check their status. In others, such as the UK, although the public procurement portal lists tenders, it does not facilitate payments tracking. In some countries, such as the UAE, applications for government loans require face-to-face interaction. The Economist Intelligence Unit in its Government E-Payments Adoption Ranking has ranked India as a joint leader along with Brazil, Norway, France and Hungary amongst 75 countries. | Table 33: Government e-Payments Rankings | India’s Position
(1) Overall: 14/21; (2) Citizen-to-Government (C2G): 2/21; (3) Government-to-Citizen (G2C): 12/21
(4) Business-to-Government (B2G): 1/21; (5) Government-to-Business (G2B): 1/21 | | Country | Overall | Citizen to Government | Government to Citizen | Business to Government | Government to Business | | Australia | 5 | 8 | 8 | 1 | 18 | | Brazil | 17 | 15 | 1 | 1 | 1 | | Canada | 4 | 5 | 8 | 1 | 11 | | China | 48 | 48 | 43 | 1 | 59 | | France | 2 | 1 | 1 | 1 | 1 | | Germany | 14 | 15 | 16 | 1 | 21 | | Hong Kong SAR | 23 | 8 | 43 | 33 | 17 | | India | 28 | 3 | 25 | 1 | 1 | | Indonesia | 60 | 39 | 43 | 49 | 64 | | Italy | 21 | 8 | 16 | 49 | 11 | | Japan | 22 | 23 | 43 | 1 | 10 | | Korea | 7 | 8 | 16 | 1 | 6 | | Mexico | 32 | 39 | 25 | 1 | 27 | | Russia | 29 | 3 | 16 | 49 | 19 | | Saudi Arabia | 35 | 23 | 32 | 49 | 40 | | Singapore | 8 | 8 | 8 | 1 | 6 | | South Africa | 42 | 31 | 32 | 45 | 18 | | Sweden | 10 | 15 | 1 | 1 | 18 | | Turkey | 45 | 48 | 57 | 1 | 51 | | United Kingdom | 6 | 8 | 8 | 1 | 11 | | United States | 12 | 23 | 1 | 1 | 15 | | Source: 2018 Government E-Payments Adoption Ranking published by Economist Intelligence Unit | (Q) Aggregators 34. Third Party Payment Service Providers / Payment Gateways / Payment Aggregators 34.1 Key insight: In India, there is no direct regulation of the third party payment service providers, while indirect regulation, which has been serving well, does exist. However, the central bank has issued directions for opening and operation of accounts and settlement of payments for electronic payment transactions involving intermediaries to ensure the safe and orderly conduct of these transactions. The Reserve Bank has been examining the need and feasibility of regulating Payment Gateway Service Providers and Payment Aggregators. It may be added that not regulating payment aggregators removes them from the ambit of the Digital Ombudsman. 34.2 Benchmark Rating: Moderate 34.3 Analysis: Third Party Payment Service Providers / Payment Gateways / Payment Aggregators are service providers who process the payment transactions of e-commerce merchants. Aggregators allow merchants to accept card and bank transfers without having to set up a merchant account with a bank or a card association. The regulations relating to Third Party Payment Service Providers / Payment Gateways / Payment Aggregators are pertaining to specific areas such as (i) Licensing / Authorisation, (ii) Requirements for operation, (iii) Security of online payments, (iv) Settlement of funds and (v) Customer protection. Direct regulation of Third Party Payment Service Providers is in place in China, Brazil, Japan and South Korea. However, in countries such as India and Singapore there is no direct regulation of payment intermediaries. In countries where regulation is in place, there are requirements for minimum levels of realized capital, IT facilities, organizational structure, reserves and data storage. Further, some countries have prescribed some restrictions for storing, accessing, transmitting or performing transactions using sensitive customer information. With regard to settlement of funds, some countries have no restrictions (South Korea, USA, Brazil, and Europe). China requires payment aggregators or intermediaries to not settle funds from their own bank account while Japan requires payment aggregators and payment intermediaries to hold funds from Merchant / Consumer in a trust / escrow in a designated bank account / arrange bank guarantee / deposit the amount to the designated Government Depository. In India it is required that the accounts of payment intermediaries are opened and maintained by banks for facilitating collection of payments and that such accounts are not maintained or operated by the intermediaries. | Table 34: Payment Aggregators | | Country | Licensed/ Authorized | Requirements for Operations | Security of online payments | Settlement of Funds | Customer Protection / Grievances | | Brazil | Licensed | Minimum capitalization norms & effective risk management policies | Laws relating to privacy, consumer protection, transparency, data security and returns apply. | No restrictions on settlement. No reserve requirements. Prevailing bankruptcy laws are applicable. | Come under the ambit of Consumer protection laws which cover transparency, data security, and returns | | Canada | No | | | Required to settle funds within a set period of time. | | | China | Licensed | Minimum requirements for IT facilities, organizational structure, and reserves. Daily transaction limits on third-party payment service accounts. | Require to allocate about 20% of clients' reserve deposits to a designated bank account to prevent aggregators from using clients' money. Requirements on data localization, data protection, and data transfer to be followed. | Cannot settle funds from their own bank account. In case of bankruptcy the reserve requirements would kick in. | | | Europe | Authorized | Cannot (a) hold funds, (b) store payment data, and (c) modify transaction in anyway. Non-discrimination policy to be adhered to. | Require to prove that they have certain minimum security measures in place ensuring safe and secure payments. | No limitations on settlement. No reserve requirements. In event of bankruptcy, the prevailing bankruptcy laws are applicable. | | | India | No | | | Directions issued for opening and operation of accounts and settlement of payments for electronic payment transactions involving intermediaries. | | | Indonesia | Licensed (if have or plan to have at least 300,000 active users) | Effective and consistent risk management, Information system security standard, Consumer protection measures.
Service providers must submit both periodic and incidental reports to Bank of Indonesia. | | | | | Japan | Registered | Qualifications for directors; vetting process and periodic inspection of Merchant and Consumer. | To perform vetting process and periodic inspection to ensure prevention of inappropriate use and leakage of customer data. | Should hold funds from Merchant / Consumer in (a) trust / escrow in a designated bank account, (b) arrange bank guarantee for the amount of these funds, or (c) deposit the amount of these funds to the designated Government Depository | Should put in place suitable policies, procedures and organizational infrastructure for dealing with complaints, claims and disputes from Merchants or Consumers. | | Singapore | Regulated only if they handle settlement funds | | Laws relating to privacy of customer information apply. | No restrictions with regard to settlement of funds. The prevailing bankruptcy laws are applied when dealing with bankruptcy cases. | Consumer Protection (Fair Trading) Act (CPTFA) is applicable. | | South Korea | Registered | Confirming identity of users, error correction, transparency, withdrawal rules, IT audits, and business scope limitations. | Law relating to online consumer protection apply. | No limitations on settlement. No reserve requirements. Applicable bankruptcy laws are applied. | Basic consumer protection provided in Commercial Act | | United States of America | Licensed | Transparency and surety bonds, adherence to KYC | Data protection Laws are applicable to aggregators. | No settlement requirements. State surety bonds would kick in in case of bankruptcy. | Subject to Dodd Frank and Federal Trade Commission Act which prohibits unfair and deceptive practices. | (R) Customer Protection and Complaint Redress 35. Customer safety and Authentication Standards 35.1 Key Insight: India has a framework on Limiting Liability of Customers in Unauthorised Electronic Banking Transactions. In addition, the Reserve Bank has also mandated (a) positive confirmation for RTGS, NEFT and IMPS; (b) two factor authentication for card transactions; and (c) alerts on debit to bank accounts and e-Money. India along with China is one of the few countries to have launched its two factor authentication system Rupay’s “PaySecure”. The other systems in use today are Mastercard / Visa’s 3DSecure and UnionPay’s SecurePay and ExpressPay. 35.2 Benchmark Rating: Strong 35.3 Analysis: Authentication is important to prevent fraudulent transactions in the e-Commerce environment. Visa and Mastercard recognised the need to authenticate the cardholder during card-not-present e-Commerce transactions and worked to develop a common payment authentication standard. Authentication enhances security of online payment systems through identification of the payer. It improves (a) trust between the merchant and the customer; and (b) security in a world where cyber security has become a major issue. | Table 35: Authentication Standard | | Country | Authentication Standard | Features | | Worldwide | 3D Secure | 3D Secure is based on the communication of XML messages across a secured channel, using the Internet Security Protocol, SSL/TLS. To use a 3D Secure service, the cardholder has to enrol for the service, by associating an authentication value, such as a password, with their payment card. The merchant also has to implement the use of 3D Secure within its site, by installing a Merchant Plug-in (MPI).
One of the main selling points of 3D Secure 1.0.2 is that it offers the merchant full liability shift against fraudulent transactions. If a user has to pass through another layer of authentication to authorise a transaction, it is less likely that the card is being used in a fraudulent manner. | | Worldwide | 3D Secure 2.0 | The specification of 3D Secure 2.0 has been built to provide support for mobile payments, integration with browsers and mobile apps, risk-based security, multi-factor authentication, and e-Money. The 3DS 2.0 authentication process is also complemented by the use of tokens, which are one-time use credit card numbers.
To facilitate risk-based authentication by the issuer, 3DS 2.0 captures a varying amount of payer and device information, depending upon market or regional mandates to restrict sending of this information (such as device ID, MAC address, SIM card details, etc.), known as 'rich data'. The information collected, including cardholder and transaction details, is encrypted and sent to the card scheme's directory server where the data is decrypted, validated and then passed on to the card issuer (ACS). Based on this rich data, the issuer conducts a risk assessment in order to make a decision as to whether the person performing the online transaction is authorised to use the payment card.
Implementation of 3D Secure 2.0 is being supported through the EMVCo community and in collaboration with the PCI Security Standards Council (PCI SSC), who will be using the new specification as part of its information security requirements framework. | | Worlwide | EMVCo | It is a consortium comprising American Express, Discover, JCB, Mastercard, UnionPay and Visa. EMVCo facilitates worldwide interoperability and acceptance of secure payment transactions within the payment industry. It also manages EMV, a technical standard for smart payment cards introduced in 1994 by EuroPay, Mastercard, and Visa, with the goal of reducing physical card fraud. | | India | PaySecure | The PaySecure authentication measures are set up during card registration for the service and are “rules” based. The rules set the level of authentication required. For online transactions under a certain value, the payer will be required to authenticate using the two-factor authentication method, in the form of an image and a passphrase, followed by the card's PIN. For transactions over a certain limit, prior to entering the card's PIN, cardholders will be required to enter a one-time password (OTP) that is sent to their registered mobile number or email address or device. An anti-phishing mechanism is also available, allowing the user to check their last three online purchases during the transaction.
In addition, NPCI, as a business and technical associate of EMVCo, is able to participate in EMVCo working groups for the creation, development, promotion and implementation of international standards, including the design and development of the 3D Secure 2.0 protocol. | | China | UnionPay Online Payments (UPOP) | UnionPay provides two cardholder authentication systems for the domestic market, SecurePay and ExpressPay. When payers are registered for SecurePay, they are redirected to the issuing bank's site to authenticate themselves using the OTP sent to their mobile number. ExpressPay authentication is performed at the merchant site and also involves the use of an OTP sent to the payer's mobile number. For the international market, UnionPay cards operate in the same way as standard cards in the payment systems of their co-brands. | | Russia | MIR | The MIR card, which utilises a flavour of 3DS 1.0.2 compatible with Visa's standard for cardholder authentication, was released by the Russian Central Bank's subsidiary, NSPK, to combat sanctions imposed by Europe and the USA, and prevent any other external economic or political factors from influencing the in-country processing of card payments. | | Europe | PSD2 Directive | PSD2 allows for a more risk-based approach to payment authentication, whilst ensuring that strong authentication is used as de facto for online payments. The ultimate goal is to reduce fraud, whilst also offering better levels of usability. | 36. Ombudsman 36.1 Key Insight: The Ombudsman Scheme for Digital Transactions launched on January 31, 2019, was introduced with the objective to facilitate the redress of complaints regarding digital transactions undertaken by customers of a Payment System Participant viz., any person other than a bank participating in a payment system (banks are covered under the Banking Ombudsman Scheme). A separate Ombudsman Scheme for complaints relating to digital financial transactions does not exist in other major jurisdictions. Only in Australia, the Ombudsman attends to complaints on secure payment system transactions (such as PayPal or Safe2pay). 36.2 Benchmark Rating: Strong 36.3 Analysis: The grievance redress mechanism of a system is a measure of its efficiency and effectiveness as it provides important feedback on the working of that system. As stated in Reserve Bank of India’s Annual Report of 2017-18, the grievances relating to digital mode of financial transactions accounted for 19 per cent of total complaints during 2016-17 which has gone up to 28 per cent till end June 2018, particularly with the inclusion of deficiencies in mobile banking service as a ground of complaint under the scheme with effect from July 1, 2017. Although a separate Ombudsman Scheme for complaints relating to digital financial transactions does not exist in other major jurisdictions, the growing trend and increasing complexity of such complaints along with the emergence of non-bank service providers in the digital payment space underlines the need for designing a dedicated Ombudsman Scheme for redress of such grievances. With this in view Reserve Bank of India announced constituting an Ombudsman Scheme for Digital Transactions’ covering services provided by entities falling under Reserve Bank’s regulatory jurisdiction. (S) Securities Settlement and Clearing System 37. Central Counterparty (CCP) For the purpose of this study, we look into the operations of the CCP regulated by the Reserve Bank, viz., Clearing Corporation of India Limited (CCIL). 37.1 Key Insight: CCIL offers central counterparty (CCP) clearing services for trades in Indian Government Securities (outright, Repo, Tri-party Repo), Forex (including Forward trades) and Rupee OTC derivative trades (interest rate Swaps and Forward rate agreements). India ranks strong with reference to the services offered and the risk management policies in place. CCIL monitors its exposures on a real time basis and collects sufficient margins from member participants. It also has constituted a default fund from member contributions. Further, it has a Settlement Reserve Fund and a Contingency Reserve Fund, its skin in the game to cater to member-default and non-default related losses. 37.2 Benchmark Rating: Strong 37.3 Analysis: Central Counterparties typically handle large value transactions creating the possibility that a failure in such systems could cause broader financial and economic instability. Market liquidity is critically dependent on confidence in the safety and reliability of the clearing and settlement arrangements. Hence, a financial or operational problem in such systems or any issue affecting one of its major participants could result in systemic risks. In India, CCIL manages its exposures to participants in the following ways: -
Membership requirements: Membership and access criteria are different for different segments. Participation requirements are adequately tailored to ensure participation of all eligible entities and any restriction imposed is on account of the risk management guidelines or regulatory prescriptions. -
Member exposure monitoring: CCIL actively monitors its exposures arising out of CCP clearing on an online real time basis. -
Settlement Risk: CCIL eliminates settlement risk through a process of multilateral netting and delivery-versus-payment (DVP) or payment-versus-payment (PVP) modes of settlement, while settling transactions in the cash market. -
Margin collection: Current and potential future exposures to each participant are covered through margins collected (in the form of Government of India securities and cash) from them. -
Default Fund: Default Funds are calibrated monthly and tested daily to ensure sufficiency to withstand the default of the largest Clearing Member and its affiliates along with 5 weak entities that give rise to the largest losses calculated under scenarios of extreme conditions. -
Prefunded risk resources: CCIL has Settlement Reserve Fund (SRF) and Contingency Reserve Fund (CRF) out of its own funds to take care of losses arising from participant default and losses other than participant default. -
Recovery tools: CCIL has provided for its insolvency in its Bye-laws and has put in place recovery tools to cover liquidity shortfall (beyond LOC) and tools to handle various non-default losses. | Table 37: CCP Ownership and Product Scope | | Country | CCP | Ownership | Product Scope | | Australia | ASX Clearing Corporation Limited which has | Private company and a wholly owned subsidiary ASX Limited. | CCP services
1) ASX Clear: Traded cash equities, debt products, warrants and equity-related derivatives.
2) ASX Clear (Futures): (a) futures and options on traded interest rate, equity, energy and commodity and (b) Australian dollar-denominated over the counter (OTC) interest rate derivatives (IRD).
Securities settlement facilities (SSF) services
1) ASX Settlement: Traded cash equities, debt products and warrants.
2) Austraclear: Trades in debt securities, including government bonds and repurchase agreements. | | Brazil | BM&FBOVESPA Clearinghouse | Public company | Handles the registration, netting, liquidation and risk management of operations involving financial derivatives and commodities, OTC market (swaps, currency forward markets and flexible options), and gold spot market. | | China | China Securities Depository and Clearing Corporation | Jointly owned by Shanghai Stock Exchange and Shenzhen Stock Exchange | It is the central counterparty and guarantees securities and cash settlement for the transactions on both Shanghai and Shenzhen stock exchanges.
Services offered:
1) Registration, clearing, and settlement services. It offers registration, depository, clearing, and settlement services for cross-border securities;
2) Registration, clearing, settlement, and custodian services for open-ended fund;
3) Registration, clearing, and settlement services for margin financing loan business;
4) Physical delivery services for T-bond futures;
5) Centralized registration and depository services for non-listed public companies;
6) Centralized registration and depository services for non-overseas listed shares; and
7) cross-market custodian and registration transfer services for the bonds. | | France | LCH.Clearnet SA | Wholly owned subsidiary of the LCH.Clearnet Group Ltd, incorporated in the United Kingdom. | Provides central counterparty services for:
1) equity securities and equity and commodity derivatives listed on Euronext trading venues in Paris, Brussels, Amsterdam and Lisbon,
2) fixed income securities and repo transactions on euro-denominated French, Italian and Spanish sovereign bonds,
3) tri-party repo transactions on ECB-eligible collateral baskets with Euroclear France acting as tri-party agent and
4) OTC credit derivatives | | Germany | Eurex Clearing AG | Wholly owned subsidiary of Eurex Frankfurt AG, a German stock corporation which is wholly owned by Deutsche Börse AG, a German stock corporation listed at the Frankfurt Stock Exchange | It is a CCP and clears transactions concluded on Eurex Frankfurt AG and Eurex Zürich AG (Eurex exchanges); the Frankfurter Wertpapierbörse (the Frankfurt Stock Exchange), the Irish Stock Exchange; Eurex Repo GmbH; and Eurex Bonds GmbH as well as for OTC Interest Rate Swaps and Securities Lending transactions. | | India | CCIL | A user owned company and its shares are held by public and private sector banks and financial institutions. | CCIL has been authorized as a “System Provider” under Section 7 of the PSS Act to operate payment systems viz., (i) Securities Segment – Outright, Repo and Tri-party Repo trades in Government Securities, (ii) Forex Settlement Segment comprising of sub segments:- USD-INR Segment, CLS Segment and Forex Forward Segment and (iii) Rupee Derivatives Segment – Rupee Denominated IRS trades in IRS & FRA. | | Japan | JSCC | A majority-owned subsidiary of Japan Exchange Group, Inc. | It is the primary clearing house in Japan, providing clearing services for cash products on Tokyo Stock Exchange (TSE) and other exchanges / proprietary trading systems (PTS) in Japan, listed derivatives on Osaka Exchange (OSE), over-the-counter (OTC) credit default swaps (CDS), OTC interest rate swaps (IRS), and OTC Japanese Government Bond (JGB) transactions. | | Singapore | Singapore Exchange Derivatives Clearing (SGX-DC) | A wholly-owned subsidiary of Singapore Exchange Limited (SGX) | Provides CCP services for products listed on Singapore Exchange Derivatives Trading (SGX-DT), commodity trades registered via the SGX OTC Trade Registration Platform and OTC financial derivatives (OTCF) trades registered via (an) industry-used trade registration system(s). | | UK | LCH.Clearnet ltd | Wholly owned subsidiary of the LCH.Clearnet Group Ltd | Provides CCP services for a broad range of asset classes, including securities, exchange-traded derivatives, commodities, energy, freight, interest rate swaps, non-deliverable FX forwards, bonds and repurchase transactions. | | USA | CME Clearing | CME Clearing is part of the broader CME Group Inc. (“CME Group”). | Provides CCP services for a broad range of exchange-traded and OTC”) derivatives across all major asset classes, including interest rates; equity indexes; foreign exchange; energy, metals, agricultural commodities; and alternative investment products; and OTC IRS, OTC CDS, OTC FX, and OTC agriculture and metal products. | | ICE Clear Credit | ICC is a limited liability company and a wholly-owned subsidiary of ICE U.S. Holding Company L.P. which is owned in turn by Intercontinental Exchange Holdings, Inc. and ultimately by Intercontinental Exchange, Inc | Provides CCP) services for a range of OTC single name and index Credit Default Swaps (CDS) derivatives. | (T) Oversight 38. Oversight 38.1 Key Insight: The Oversight by Central Bank is explicitly and implicitly laid down in the statute and the Reserve Bank of India is empowered with a wide variety of tools to carry out this function. 38.2 Benchmark Rating: Leader 38.3 Analysis: The scope of central bank oversight pertaining to payment systems depends on national specificities and could include large-value and retail payment systems, payment instruments, clearing and settlement systems for financial instruments, and central counterparties. Payment systems oversight involves monitoring of the reliability and efficiency of payment systems operating in the country on an on-going basis, assessing systems’ features and fostering changes when necessary. The factors that contribute to the effectiveness of payment systems oversight are (a) the adequacy of legal powers of the central bank in the payment systems arena; (b) the internal organization of the central bank in relation to payment systems activities; and (c) the range of instruments that the central bank has as its disposal to oversee systems. The Reserve Bank’s oversight of the payment systems has legal backing, it has separate verticals to look after this task and has in its armoury tools like monitoring, dialogue, moral suasion, issuing regulations, imposing sanctions and on-site inspection to effectively carry out the oversight function. | Table 38: Oversight Role | | India’s Position: Leader | | Country | Empowerment | Tools Available | | Explicit | Implicit* | Monitoring | Dialogue and moral suasion | Producing and publishing statistics and / or payment system reports | Issuing regulations | Imposing sanctions | On-site inspections | | Australia | Y | | Y | Y | Y | Y | | | | Brazil | Y | | Y | Y | Y | Y | Y | Y | | Canada | Y | Y | Y | Y | Y | | | Y | | China | | Y | Y | Y | Y | Y | Y | Y | | ECB | Y | Y | Y | Y | Y | Y | Y | Y | | France | Y | Y | Y | Y | Y | | | Y | | Germany | | Y | Y | Y | Y | | | | | Hong Kong SAR | Y | Y | Y | Y | Y | Y | Y | Y | | India | Y | Y | Y | Y | Y | Y | Y | Y | | Indonesia | Data Not available | | Italy | Y | Y | Y | Y | Y | Y | Y | Y | | Japan | | Y | Y | Y | Y | | | Y | | Mexico | Y | Y | Y | Y | Y | Y | Y | Y | | Russia | Y | Y | Y | Y | Y | | | Y | | Saudi Arabia | | Y | Y | Y | Y | Y | Y | Y | | Singapore | Y | Y | Y | Y | Y | Y# | Y# | Y# | | South Africa | Y | | Y | Y | Y | Y | Y | Y | | South Korea | | Y | Y | Y | Y | | | | | Sweden | | Y | Y | Y | Y | | | Y | | Turkey | | Y | Y | Y | Y | Y | | | | United Kingdom | | | | | | | | | | United States$ | Y | | Y | Y | Y | Y | Y | Y | Source: Survey conducted by the Working Group on Central Bank Involvement in Retail Payments, 2012 (CPSS, BIS)
Note:
*Implicit – construed in the context of “ensuring the adequate and safe functioning of payments in the country”
# Operators, settlement institutions and participants in designated payment systems will be subject to MAS regulations
$ Authority is explicit where it is derived from the Federal Reserve’s role in banking supervision and regulation; the tools available will depend on the circumstances. | (U) Cross Border Personal Remittances 39. Availability 39.1 Key Insight: The Act governing cross border remittances is the Foreign Exchange Management Act, 1999 (FEMA). The main channel for remittance is through authorised dealer category - I banks which predominantly use the S.W.I.F.T. messaging system. Entities licenced as authorised dealer category - II are permitted to make inward remittances only. Outward remittances have to be channelized only through banks. In the absence of alternatives, the payment system is slow as compared to domestic payments. 39.2 Benchmark rating: Weak 39.3 Analysis: Cross border remittances comprising cross-border payments, notably trade-related payments and person-to-person international remittances, are increasingly relevant for economies and their societies as a result of current global realities – particularly growing economic integration and interdependence among countries at all levels, and the increasing flow of immigrants throughout the world. Remittances are a major source of foreign exchange earnings in many Low and Middle Income Countries (LMICs) like India. From a policy making perspective, retail cross-border payments share many of the features of domestic payments systems. In India, cross border remittances are mainly done through banks. While non-banks are permitted in the inward remittance domain, it is a strict no in the outward remittances space. Know Your Customer / Anti-Money Laundering (KYC / AML) and Combatting Financing of Terrorism (CFT) issues have made countries world-wide circumspect to flows leading to multiple checks and authentications. These restrictions make cross-border remittances slow. A good level of cross-border integration of payment systems should translate into cross-border payments being settled more efficiently and safely, which could result in relatively lower costs and faster transactions. A good example of this is entities like Paypal and authorised Money Transfer Service Scheme (MTSS) operators. 40. Flows 40.1 Key Insight: India is a leader with reference to inflows towards personal remittances. It received USD 79.5 billion in 2018. This can be attributed to the large Indian Diaspora outside sending remittances to the country. 40.2 Benchmark rating: Leader 40.3 Analysis: The upsurge is driven by stronger economic conditions in high-income economies (particularly the United States) and an increase in oil prices up to October 2018, which had a positive impact on remittance outflows from some Gulf countries (such as the United Arab Emirates, which reported 13 percent growth in outflows in the first half of 2018). With reference to non-personal remittances, the path has been chequered for India. Global cues increase outflows putting a pressure on the domestic currency. In the period from 2012, flows have been adverse in 2013 owing to “Taper Tantrum”. A stable capital account management, however, is in place to manage capital flows. 41. Costs of Cross Border remittances 41.1 Key Insight: Cost of sending remittances from India to Nepal was below 2% and from Singapore to India was in the range between 2% to 4% in the year 2018. The costs were high for remittances from Japan and South Africa and low for remittances from Russia. 41.1 Benchmark rating: Moderate 41.3 Analysis: According to the Migration and Development Brief 30, 2018, the global average cost of sending remittances has remained nearly stagnant, at 6.9 percent in the third quarter of 2018, more than double the target (Sustainable Development Goal or SDG) of 3 percent by 2030. The report states that South Asia had the lowest average remittance costs of any world region (at 5.4 percent) in the third quarter of 2018 which was higher than 5.2% in the previous quarter. The report states that remittances from India to Nepal and from Singapore to India are some of the less expensive. Factors contributing to high costs include de-risking measures taken by commercial banks (for ensuring compliance with KYC / AML guidelines) and exclusive partnerships between national post office systems and a single money transfer operator. Increased costs only increases remittances through non-banking channels. Harmonized regulation and adoption of innovative technologies could lower remittance costs by reducing intermediaries, enabling standardized and verifiable transactions, and smoothening AML / CFT regulatory processes. |