Today, the Reserve Bank released the results of the 93rd round of the Industrial Outlook Survey (IOS) conducted during January-March 2021. The survey encapsulates qualitative assessment of the business climate by Indian manufacturing companies for Q4:2020-21 and their expectations for Q1:2021-221. In all, 967 companies responded in this round of the survey. Owing to uncertainty driven by the COVID-19 pandemic, an additional block was included in this round of the survey for assessing the outlook on key parameters for two quarters ahead as well as three quarters ahead. Highlights: A. Assessment for Q4: 2020-21 -
Manufacturing companies assessed further strengthening of production, order books and employment during Q4:2020-21 (Table A). -
Sentiments on financial situation improved in terms of availability of finance from banks, internal accruals and overseas sources. -
Manufacturers perceived higher cost pressures mainly stemming from purchase of inputs and salary expenses and some increase in selling prices during the quarter. -
The business assessment index (BAI)2 extended further in expansion zone to 113.1 in Q4:2020-21 from 108.6 in the previous quarter (Chart 1). B. Expectations for Q1: 2021-22 -
Production volumes, new orders and job landscape are expected to strengthen in Q1:2021-22. -
Optimism prevails on the overall financial situation. -
Respondents expect more pressure from cost of finance, purchase of raw materials and salary outgo in Q1:2021-22. -
Selling prices as well as profit margins are expected to increase in Q1:2021-22. -
The business expectations index (BEI) increased further to 119.6 in Q1:2021-22 from 114.1 in Q4:2020-21 (Chart 1). C. Expectations for Q2:2021-22 and Q3:2021-22 -
Manufacturers perceived further improvement in production and overall business situation in Q2:2021-22 and Q3:2021-22 (Table B). -
Capacity utilisation and employment conditions are expected to improve. -
Respondents expected input cost pressure to continue, albeit with marginal easing and selling prices to harden gradually. 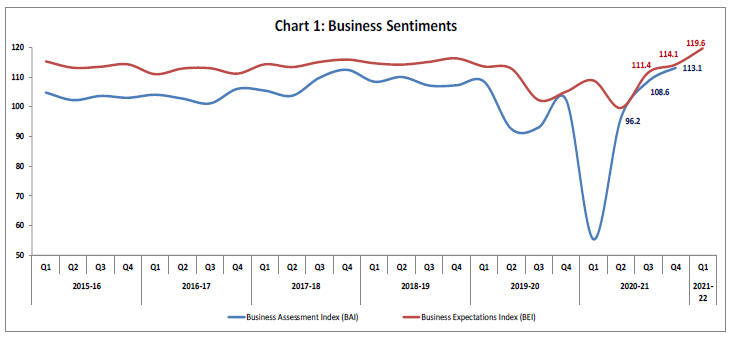 | Table A: Summary of Net responses3 on Survey Parameters | | (per cent) | | Parameters | Assessment period | Expectation period | | Q3:2020-21 | Q4:2020-21 | Q4:2020-21 | Q1:2021-22 | | Production | 27.2 | 36.3 | 31.5 | 43.7 | | Order Books | 20.5 | 33.1 | 27.3 | 43.2 | | Pending Orders | 12.0 | -3.0 | 9.2 | -2.4 | | Capacity Utilisation | 17.3 | 29.1 | 24.1 | 38.0 | | Inventory of Raw Materials | -5.4 | -11.1 | -6.7 | -11.8 | | Inventory of Finished Goods | -4.6 | -7.6 | -6.3 | -10.9 | | Exports | 4.6 | 15.5 | 13.0 | 29.6 | | Imports | 6.3 | 16.4 | 8.5 | 26.1 | | Employment | 3.9 | 10.9 | 7.2 | 17.9 | | Financial Situation (Overall) | 27.5 | 29.4 | 33.0 | 47.3 | | Availability of Finance (from internal accruals) | 17.4 | 23.7 | 22.8 | 34.7 | | Availability of Finance (from banks & other sources) | 14.9 | 16.5 | 15.3 | 25.6 | | Availability of Finance (from overseas, if applicable) | 0.8 | 2.7 | 3.8 | 13.4 | | Cost of Finance | 0.2 | -3.4 | -5.0 | -13.9 | | Cost of Raw Material | -51.6 | -69.0 | -42.7 | -62.4 | | Salary/ Other Remuneration | -14.0 | -18.7 | -16.0 | -41.6 | | Selling Price | 9.4 | 22.7 | 10.7 | 29.2 | | Profit Margin | -11.8 | 2.0 | -2.4 | 11.0 | | Overall Business Situation | 32.9 | 36.5 | 40.7 | 52.5 | | Note: Please see the excel file for time series data. |
| Table B: Business Expectations of Select Parameters for extended period – Net response | | (per cent) | | Parameters | Round 92 | Round 93 | | Q4:2020-21 | Q1:2021-22 | Q2:2021-22 | Q3:2021-22 | | Overall Business Situation | 40.7 | 52.5 | 56.1 | 60.4 | | Production | 31.5 | 43.7 | 52.7 | 58.3 | | Order Books | 27.3 | 43.2 | 49.1 | 53.4 | | Capacity Utilisation | 24.1 | 38.0 | 48.1 | 50.4 | | Employment | 7.2 | 17.9 | 21.9 | 24.6 | | Cost of Raw Materials | -42.7 | -62.4 | -61.8 | -57.8 | | Selling Prices | 10.7 | 29.2 | 31.7 | 31.8 |
| Table 1: Assessment and Expectations for Production | | (Percentage responses) | | Quarter | Total response | Assessment | Expectations | | Increase | Decrease | No change | Net response | Increase | Decrease | No change | Net response | | Q4:2019-20 | 860 | 33.6 | 19.8 | 46.6 | 13.8 | 35.4 | 18.2 | 46.4 | 17.2 | | Q1:2020-21 | 802 | 8.3 | 72.2 | 19.5 | -63.9 | 37.8 | 14.1 | 48.1 | 23.7 | | Q2:2020-21 | 959 | 42.4 | 32.1 | 25.5 | 10.3 | 41.4 | 30.2 | 28.5 | 11.2 | | Q3:2020-21 | 1,011 | 46.6 | 19.4 | 34.0 | 27.2 | 43.4 | 16.9 | 39.7 | 26.4 | | Q4:2020-21 | 967 | 48.9 | 12.6 | 38.5 | 36.3 | 43.7 | 12.2 | 44.0 | 31.5 | | Q1:2021-22 | | | | | | 53.3 | 9.7 | 37.0 | 43.7 | ‘Increase’ in production is optimistic.
Note: The sum of components may not add up to total due to rounding off (This is applicable for all tables). |
| Table 2: Assessment and Expectations for Order Books | | (Percentage responses) | | Quarter | Total response | Assessment | Expectations | | Increase | Decrease | No change | Net response | Increase | Decrease | No change | Net response | | Q4:2019-20 | 860 | 30.1 | 20.1 | 49.9 | 10.0 | 33.6 | 17.0 | 49.3 | 16.6 | | Q1:2020-21 | 802 | 8.9 | 63.8 | 27.3 | -54.9 | 33.5 | 15.1 | 51.4 | 18.4 | | Q2:2020-21 | 959 | 37.2 | 31.3 | 31.5 | 5.9 | 36.4 | 28.4 | 35.3 | 8.0 | | Q3:2020-21 | 1,011 | 40.3 | 19.8 | 40.0 | 20.5 | 39.2 | 18.6 | 42.2 | 20.6 | | Q4:2020-21 | 967 | 46.4 | 13.3 | 40.3 | 33.1 | 41.1 | 13.7 | 45.2 | 27.3 | | Q1:2021-22 | | | | | | 51.0 | 7.8 | 41.1 | 43.2 | | ‘Increase’ in order books is optimistic. |
| Table 3: Assessment and Expectations for Pending Orders | | (Percentage responses) | | Quarter | Total response | Assessment | Expectations | | Above Normal | Below Normal | Normal | Net response | Above Normal | Below Normal | Normal | Net response | | Q4:2019-20 | 860 | 4.1 | 18.5 | 77.4 | 14.4 | 3.7 | 19.5 | 76.8 | 15.9 | | Q1:2020-21 | 802 | 6.1 | 47.3 | 46.6 | 41.2 | 4.6 | 16.2 | 79.1 | 11.6 | | Q2:2020-21 | 959 | 7.2 | 30.1 | 62.7 | 22.8 | 5.8 | 31.8 | 62.4 | 26.0 | | Q3:2020-21 | 1,011 | 7.2 | 19.2 | 73.6 | 12.0 | 7.4 | 21.5 | 71.1 | 14.2 | | Q4:2020-21 | 967 | 13.2 | 10.2 | 76.6 | -3.0 | 5.6 | 14.8 | 79.7 | 9.2 | | Q1:2021-22 | | | | | | 11.6 | 9.2 | 79.3 | -2.4 | | Pending orders ‘Below Normal’ is optimistic. |
| Table 4: Assessment and Expectations for Capacity Utilisation (Main Product) | | (Percentage responses) | | Quarter | Total response | Assessment | Expectations | | Increase | Decrease | No change | Net response | Increase | Decrease | No change | Net response | | Q4:2019-20 | 860 | 21.0 | 19.0 | 60.0 | 2.0 | 23.1 | 15.2 | 61.6 | 7.9 | | Q1:2020-21 | 802 | 6.0 | 67.6 | 26.3 | -61.6 | 25.5 | 14.2 | 60.3 | 11.3 | | Q2:2020-21 | 959 | 31.8 | 30.2 | 37.9 | 1.6 | 36.2 | 28.6 | 35.2 | 7.6 | | Q3:2020-21 | 1,011 | 35.3 | 18.0 | 46.7 | 17.3 | 32.4 | 15.0 | 52.6 | 17.5 | | Q4:2020-21 | 967 | 40.6 | 11.5 | 47.9 | 29.1 | 34.7 | 10.6 | 54.7 | 24.1 | | Q1:2021-22 | | | | | | 45.2 | 7.3 | 47.5 | 38.0 | | ‘Increase’ in capacity utilisation is optimistic. |
| Table 5: Assessment and Expectations for Level of CU (compared to the average in last 4 quarters) | | (Percentage responses) | | Quarter | Total response | Assessment | Expectations | | Above Normal | Below Normal | Normal | Net response | Above Normal | Below Normal | Normal | Net response | | Q4:2019-20 | 860 | 7.6 | 21.6 | 70.7 | -14.0 | 7.9 | 18.5 | 73.6 | -10.6 | | Q1:2020-21 | 802 | 2.7 | 63.6 | 33.7 | -60.9 | 9.1 | 16.4 | 74.5 | -7.3 | | Q2:2020-21 | 959 | 5.9 | 43.4 | 50.8 | -37.5 | 5.8 | 39.2 | 55.0 | -33.5 | | Q3:2020-21 | 1,011 | 11.3 | 23.2 | 65.5 | -12.0 | 8.3 | 25.5 | 66.2 | -17.2 | | Q4:2020-21 | 967 | 21.3 | 12.2 | 66.5 | 9.1 | 11.7 | 15.3 | 73.0 | -3.6 | | Q1:2021-22 | | | | | | 25.3 | 8.4 | 66.2 | 16.9 | | ‘Above Normal’ in Level of capacity utilisation is optimistic. |
| Table 6: Assessment and Expectations for Assessment of Production Capacity (with regard to expected demand in next 6 months) | | (Percentage responses) | | Quarter | Total response | Assessment | Expectations | | More than adequate | Less than adequate | Adequate | Net response | More than adequate | Less than adequate | Adequate | Net response | | Q4:2019-20 | 860 | 14.3 | 9.5 | 76.2 | 4.8 | 14.6 | 11.4 | 74.0 | 3.2 | | Q1:2020-21 | 802 | 19.0 | 24.5 | 56.5 | -5.6 | 13.7 | 8.8 | 77.5 | 4.9 | | Q2:2020-21 | 959 | 15.9 | 17.2 | 66.9 | -1.3 | 18.7 | 17.3 | 64.0 | 1.3 | | Q3:2020-21 | 1,011 | 14.1 | 11.2 | 74.6 | 2.9 | 15.9 | 12.3 | 71.8 | 3.5 | | Q4:2020-21 | 967 | 15.5 | 10.0 | 74.5 | 5.5 | 14.2 | 9.3 | 76.5 | 5.0 | | Q1:2021-22 | | | | | | 20.2 | 7.3 | 72.5 | 12.9 | | ‘More than adequate’ in Assessment of Production Capacity is optimistic. |
| Table 7: Assessment and Expectations for Exports | | (Percentage responses) | | Quarter | Total response | Assessment | Expectations | | Increase | Decrease | No change | Net response | Increase | Decrease | No change | Net response | | Q4:2019-20 | 860 | 20.1 | 14.3 | 65.5 | 5.8 | 22.4 | 13.8 | 63.9 | 8.6 | | Q1:2020-21 | 802 | 8.7 | 50.4 | 40.9 | -41.7 | 22.5 | 11.5 | 66.0 | 11.0 | | Q2:2020-21 | 959 | 25.3 | 25.9 | 48.8 | -0.6 | 23.1 | 26.9 | 50.0 | -3.8 | | Q3:2020-21 | 1,011 | 22.5 | 17.9 | 59.5 | 4.6 | 25.1 | 17.6 | 57.3 | 7.5 | | Q4:2020-21 | 967 | 31.6 | 16.0 | 52.4 | 15.5 | 25.1 | 12.1 | 62.7 | 13.0 | | Q1:2021-22 | | | | | | 38.7 | 9.0 | 52.3 | 29.6 | | ‘Increase’ in exports is optimistic. |
| Table 8: Assessment and Expectations for Imports | | (Percentage responses) | | Quarter | Total response | Assessment | Expectations | | Increase | Decrease | No change | Net response | Increase | Decrease | No change | Net response | | Q4:2019-20 | 860 | 16.0 | 11.3 | 72.7 | 4.7 | 15.7 | 10.2 | 74.1 | 5.4 | | Q1:2020-21 | 802 | 7.6 | 40.5 | 51.8 | -32.9 | 16.9 | 10.3 | 72.8 | 6.6 | | Q2:2020-21 | 959 | 18.4 | 21.2 | 60.5 | -2.8 | 19.9 | 21.0 | 59.1 | -1.0 | | Q3:2020-21 | 1,011 | 19.6 | 13.3 | 67.2 | 6.3 | 17.3 | 12.4 | 70.4 | 4.9 | | Q4:2020-21 | 967 | 25.8 | 9.3 | 64.9 | 16.4 | 17.7 | 9.1 | 73.2 | 8.5 | | Q1:2021-22 | | | | | | 32.6 | 6.6 | 60.8 | 26.1 | | ‘Increase’ in imports is optimistic. |
| Table 9: Assessment and Expectations for level of Raw Materials Inventory | | (Percentage responses) | | Quarter | Total response | Assessment | Expectations | | Above average | Below average | Average | Net response | Above average | Below average | Average | Net response | | Q4:2019-20 | 860 | 12.9 | 7.8 | 79.3 | -5.1 | 10.6 | 7.0 | 82.4 | -3.6 | | Q1:2020-21 | 802 | 21.3 | 13.5 | 65.2 | -7.8 | 9.8 | 6.9 | 83.3 | -2.9 | | Q2:2020-21 | 959 | 16.7 | 10.9 | 72.3 | -5.8 | 15.5 | 9.7 | 74.8 | -5.9 | | Q3:2020-21 | 1,011 | 13.1 | 7.7 | 79.3 | -5.4 | 11.5 | 7.4 | 81.1 | -4.2 | | Q4:2020-21 | 967 | 17.5 | 6.5 | 76.0 | -11.1 | 12.0 | 5.3 | 82.8 | -6.7 | | Q1:2021-22 | | | | | | 17.2 | 5.4 | 77.4 | -11.8 | | ‘Below average’ Inventory of raw materials is optimistic. |
| Table 10: Assessment and Expectations for level of Finished Goods Inventory | | (Percentage responses) | | Quarter | Total response | Assessment | Expectations | | Above average | Below average | Average | Net response | Above average | Below average | Average | Net response | | Q4:2019-20 | 860 | 13.3 | 6.7 | 80.0 | -6.5 | 12.9 | 6.2 | 80.9 | -6.7 | | Q1:2020-21 | 802 | 27.0 | 14.3 | 58.7 | -12.6 | 10.4 | 6.2 | 83.4 | -4.3 | | Q2:2020-21 | 959 | 18.9 | 10.2 | 70.9 | -8.7 | 17.2 | 9.5 | 73.3 | -7.6 | | Q3:2020-21 | 1,011 | 12.8 | 8.1 | 79.1 | -4.6 | 12.4 | 7.2 | 80.4 | -5.3 | | Q4:2020-21 | 967 | 15.2 | 7.5 | 77.3 | -7.6 | 11.5 | 5.1 | 83.4 | -6.3 | | Q1:2021-22 | | | | | | 16.4 | 5.5 | 78.1 | -10.9 | | ‘Below average’ Inventory of finished goods is optimistic. |
| Table 11: Assessment and Expectations for Employment | | (Percentage responses) | | Quarter | Total response | Assessment | Expectations | | Increase | Decrease | No change | Net response | Increase | Decrease | No change | Net response | | Q4:2019-20 | 860 | 13.4 | 11.3 | 75.3 | 2.0 | 12.5 | 10.7 | 76.8 | 1.8 | | Q1:2020-21 | 802 | 3.9 | 32.5 | 63.7 | -28.6 | 14.3 | 9.0 | 76.7 | 5.2 | | Q2:2020-21 | 959 | 11.8 | 21.0 | 67.2 | -9.2 | 11.0 | 18.7 | 70.3 | -7.7 | | Q3:2020-21 | 1,011 | 15.5 | 11.6 | 73.0 | 3.9 | 14.5 | 12.1 | 73.3 | 2.4 | | Q4:2020-21 | 967 | 19.4 | 8.5 | 72.1 | 10.9 | 14.6 | 7.3 | 78.1 | 7.2 | | Q1:2021-22 | | | | | | 23.5 | 5.5 | 71.0 | 17.9 | | ‘Increase’ in employment is optimistic. |
| Table 12: Assessment and Expectations for Overall Financial Situation | | (Percentage responses) | | Quarter | Total response | Assessment | Expectations | | Better | Worsen | No change | Net response | Better | Worsen | No change | Net response | | Q4:2019-20 | 860 | 26.5 | 13.6 | 59.9 | 12.8 | 31.2 | 11.7 | 57.1 | 19.5 | | Q1:2020-21 | 802 | 8.7 | 57.6 | 33.6 | -48.9 | 33.1 | 8.8 | 58.0 | 24.3 | | Q2:2020-21 | 959 | 31.8 | 23.9 | 44.3 | 7.8 | 34.6 | 23.2 | 42.2 | 11.4 | | Q3:2020-21 | 1,011 | 40.4 | 12.9 | 46.7 | 27.5 | 36.7 | 11.4 | 51.9 | 25.3 | | Q4:2020-21 | 967 | 43.0 | 13.6 | 43.4 | 29.4 | 39.2 | 6.2 | 54.6 | 33.0 | | Q1:2021-22 | | | | | | 53.4 | 6.1 | 40.5 | 47.3 | | ‘Better’ overall financial situation is optimistic. |
| Table 13: Assessment and Expectations for Working Capital Finance Requirement | | (Percentage responses) | | Quarter | Total response | Assessment | Expectations | | Increase | Decrease | No change | Net response | Increase | Decrease | No change | Net response | | Q4:2019-20 | 860 | 28.3 | 6.4 | 65.4 | 21.9 | 27.3 | 5.7 | 66.9 | 21.6 | | Q1:2020-21 | 802 | 36.9 | 18.8 | 44.4 | 18.1 | 28.8 | 5.7 | 65.5 | 23.1 | | Q2:2020-21 | 959 | 33.3 | 11.4 | 55.3 | 21.9 | 37.2 | 11.5 | 51.3 | 25.7 | | Q3:2020-21 | 1,011 | 30.7 | 7.1 | 62.2 | 23.7 | 31.3 | 6.9 | 61.8 | 24.4 | | Q4:2020-21 | 967 | 30.8 | 7.7 | 61.4 | 23.1 | 28.5 | 3.7 | 67.8 | 24.8 | | Q1:2021-22 | | | | | | 37.6 | 5.2 | 57.3 | 32.4 | | ‘Increase’ in working capital finance is optimistic. |
| Table 14: Assessment and Expectations for Availability of Finance (from Internal Accruals) | | (Percentage responses) | | Quarter | Total response | Assessment | Expectations | | Improve | Worsen | No change | Net response | Improve | Worsen | No change | Net response | | Q4:2019-20 | 860 | 23.1 | 9.5 | 67.4 | 13.7 | 22.1 | 8.8 | 69.1 | 13.4 | | Q1:2020-21 | 802 | 7.2 | 38.0 | 54.8 | -30.8 | 23.1 | 6.0 | 70.9 | 17.0 | | Q2:2020-21 | 959 | 22.2 | 18.4 | 59.5 | 3.8 | 22.5 | 16.1 | 61.3 | 6.4 | | Q3:2020-21 | 1,011 | 27.2 | 9.7 | 63.1 | 17.4 | 24.8 | 9.7 | 65.5 | 15.1 | | Q4:2020-21 | 967 | 33.3 | 9.6 | 57.1 | 23.7 | 28.3 | 5.6 | 66.1 | 22.8 | | Q1:2021-22 | | | | | | 39.7 | 5.1 | 55.2 | 34.7 | | ‘Improvement’ in availability of finance is optimistic. |
| Table 15: Assessment and Expectations for Availability of Finance (from banks and other sources) | | (Percentage responses) | | Quarter | Total response | Assessment | Expectations | | Improve | Worsen | No change | Net response | Improve | Worsen | No change | Net response | | Q4:2019-20 | 860 | 16.9 | 6.1 | 76.9 | 10.8 | 17.7 | 5.9 | 76.4 | 11.7 | | Q1:2020-21 | 802 | 12.9 | 15.8 | 71.3 | -3.0 | 18.1 | 6.4 | 75.4 | 11.7 | | Q2:2020-21 | 959 | 20.3 | 8.3 | 71.4 | 12.0 | 20.4 | 9.8 | 69.8 | 10.6 | | Q3:2020-21 | 1,011 | 21.0 | 6.1 | 72.8 | 14.9 | 19.4 | 5.8 | 74.8 | 13.6 | | Q4:2020-21 | 967 | 23.1 | 6.6 | 70.3 | 16.5 | 19.6 | 4.3 | 76.1 | 15.3 | | Q1:2021-22 | | | | | | 30.0 | 4.4 | 65.6 | 25.6 | | ‘Improvement’ in availability of finance is optimistic. |
| Table 16: Assessment and Expectations for Availability of Finance (from overseas, if applicable) | | (Percentage responses) | | Quarter | Total response | Assessment | Expectations | | Improve | Worsen | No change | Net response | Improve | Worsen | No change | Net response | | Q4:2019-20 | 860 | 7.2 | 4.4 | 88.4 | 2.8 | 7.3 | 4.3 | 88.4 | 3.0 | | Q1:2020-21 | 802 | 3.2 | 13.5 | 83.3 | -10.3 | 7.9 | 4.0 | 88.1 | 4.0 | | Q2:2020-21 | 959 | 6.8 | 7.4 | 85.7 | -0.6 | 7.9 | 9.9 | 82.2 | -2.0 | | Q3:2020-21 | 1,011 | 5.8 | 5.0 | 89.2 | 0.8 | 7.2 | 6.6 | 86.1 | 0.6 | | Q4:2020-21 | 967 | 7.5 | 4.8 | 87.7 | 2.7 | 7.2 | 3.4 | 89.3 | 3.8 | | Q1:2021-22 | | | | | | 16.5 | 3.1 | 80.3 | 13.4 | | ‘Improvement’ in availability of finance is optimistic. |
| Table 17: Assessment and Expectations for Cost of Finance | | (Percentage responses) | | Quarter | Total response | Assessment | Expectations | | Increase | Decrease | No change | Net response | Increase | Decrease | No change | Net response | | Q4:2019-20 | 860 | 15.0 | 8.4 | 76.6 | -6.6 | 15.0 | 7.1 | 77.9 | -7.9 | | Q1:2020-21 | 802 | 16.3 | 15.9 | 67.8 | -0.4 | 12.7 | 6.6 | 80.6 | -6.1 | | Q2:2020-21 | 959 | 17.5 | 14.7 | 67.7 | -2.8 | 17.6 | 10.9 | 71.5 | -6.7 | | Q3:2020-21 | 1,011 | 13.3 | 13.5 | 73.2 | 0.2 | 15.5 | 8.8 | 75.7 | -6.7 | | Q4:2020-21 | 967 | 16.7 | 13.3 | 70.0 | -3.4 | 13.3 | 8.3 | 78.4 | -5.0 | | Q1:2021-22 | | | | | | 22.2 | 8.2 | 69.6 | -13.9 | | ‘Decrease’ in cost of finance is optimistic. |
| Table 18: Assessment and Expectations for Cost of Raw Materials | | (Percentage responses) | | Quarter | Total response | Assessment | Expectations | | Increase | Decrease | No change | Net response | Increase | Decrease | No change | Net response | | Q4:2019-20 | 860 | 41.1 | 7.1 | 51.8 | -34.1 | 35.6 | 5.6 | 58.8 | -30.0 | | Q1:2020-21 | 802 | 39.9 | 10.7 | 49.4 | -29.3 | 38.9 | 5.3 | 55.7 | -33.6 | | Q2:2020-21 | 959 | 46.1 | 8.2 | 45.7 | -38.0 | 37.8 | 5.7 | 56.5 | -32.0 | | Q3:2020-21 | 1,011 | 55.5 | 3.9 | 40.6 | -51.6 | 36.7 | 4.6 | 58.7 | -32.1 | | Q4:2020-21 | 967 | 71.0 | 2.0 | 26.9 | -69.0 | 45.2 | 2.6 | 52.2 | -42.7 | | Q1:2021-22 | | | | | | 64.9 | 2.5 | 32.6 | -62.4 | | ‘Decrease’ in cost of raw materials is optimistic. |
| Table 19: Assessment and Expectations for Salary/Other Remuneration | | (Percentage responses) | | Quarter | Total response | Assessment | Expectations | | Increase | Decrease | No change | Net response | Increase | Decrease | No change | Net response | | Q4:2019-20 | 860 | 27.1 | 2.3 | 70.6 | -24.8 | 25.1 | 3.0 | 71.9 | -22.1 | | Q1:2020-21 | 802 | 12.4 | 22.0 | 65.5 | 9.6 | 35.8 | 2.7 | 61.5 | -33.1 | | Q2:2020-21 | 959 | 15.7 | 12.9 | 71.4 | -2.8 | 16.5 | 12.5 | 70.9 | -4.0 | | Q3:2020-21 | 1,011 | 20.8 | 6.8 | 72.3 | -14.0 | 15.8 | 6.8 | 77.4 | -9.0 | | Q4:2020-21 | 967 | 21.8 | 3.1 | 75.1 | -18.7 | 19.9 | 3.9 | 76.2 | -16.0 | | Q1:2021-22 | | | | | | 42.7 | 1.2 | 56.1 | -41.6 | | ‘Decrease’ in Salary / other remuneration is optimistic. |
| Table 20: Assessment and Expectations for Selling Price | | (Percentage responses) | | Quarter | Total response | Assessment | Expectations | | Increase | Decrease | No change | Net response | Increase | Decrease | No change | Net response | | Q4:2019-20 | 860 | 16.4 | 13.9 | 69.7 | 2.5 | 15.2 | 13.0 | 71.9 | 2.2 | | Q1:2020-21 | 802 | 9.5 | 26.6 | 64.0 | -17.1 | 18.0 | 9.7 | 72.3 | 8.3 | | Q2:2020-21 | 959 | 13.9 | 19.7 | 66.4 | -5.8 | 12.9 | 18.9 | 68.1 | -6.0 | | Q3:2020-21 | 1,011 | 21.9 | 12.5 | 65.6 | 9.4 | 12.8 | 13.0 | 74.3 | -0.2 | | Q4:2020-21 | 967 | 31.3 | 8.6 | 60.1 | 22.7 | 19.6 | 8.9 | 71.5 | 10.7 | | Q1:2021-22 | | | | | | 35.0 | 5.8 | 59.1 | 29.2 | | ‘Increase’ in selling price is optimistic. |
| Table 21: Assessment and Expectations for Profit Margin | | (Percentage responses) | | Quarter | Total response | Assessment | Expectations | | Increase | Decrease | No change | Net response | Increase | Decrease | No change | Net response | | Q4:2019-20 | 860 | 15.8 | 27.4 | 56.8 | -11.6 | 16.3 | 26.4 | 57.3 | -10.2 | | Q1:2020-21 | 802 | 5.0 | 61.8 | 33.2 | -56.8 | 17.5 | 20.4 | 62.1 | -2.9 | | Q2:2020-21 | 959 | 15.3 | 41.8 | 43.0 | -26.5 | 13.7 | 40.5 | 45.8 | -26.8 | | Q3:2020-21 | 1,011 | 17.4 | 29.1 | 53.5 | -11.8 | 14.7 | 26.7 | 58.6 | -12.0 | | Q4:2020-21 | 967 | 24.9 | 22.9 | 52.1 | 2.0 | 17.8 | 20.1 | 62.1 | -2.4 | | Q1:2021-22 | | | | | | 28.8 | 17.8 | 53.4 | 11.0 | | ‘Increase’ in profit margin is optimistic. |
| Table 22: Assessment and Expectations for Overall Business Situation | | (Percentage responses) | | Quarter | Total response | Assessment | Expectations | | Better | Worsen | No change | Net response | Better | Worsen | No change | Net response | | Q4:2019-20 | 860 | 31.6 | 15.8 | 52.6 | 15.7 | 35.8 | 13.2 | 50.9 | 22.6 | | Q1:2020-21 | 802 | 8.3 | 68.5 | 23.2 | -60.2 | 38.6 | 10.4 | 50.9 | 28.2 | | Q2:2020-21 | 959 | 39.6 | 27.9 | 32.5 | 11.8 | 41.0 | 25.3 | 33.6 | 15.7 | | Q3:2020-21 | 1,011 | 46.7 | 13.8 | 39.6 | 32.9 | 45.7 | 12.8 | 41.6 | 32.9 | | Q4:2020-21 | 967 | 49.0 | 12.4 | 38.6 | 36.5 | 48.2 | 7.6 | 44.2 | 40.7 | | Q1:2021-22 | | | | | | 57.7 | 5.1 | 37.2 | 52.5 | | ‘Better’ Overall Business Situation is optimistic. |
| Table 23: Business Sentiments | | Quarter | Business Assessment Index (BAI) | Business Expectations Index (BEI) | | Q4:2019-20 | 102.2 | 105.0 | | Q1:2020-21 | 55.3 | 108.8 | | Q2:2020-21 | 96.2 | 99.5 | | Q3:2020-21 | 108.6 | 111.4 | | Q4:2020-21 | 113.1 | 114.1 | | Q1:2021-22 | | 119.6 |
1 The survey results reflect the respondents’ views, which are not necessarily shared by the Reserve Bank. Results of the previous survey round were released on the Bank’s website on February 5, 2021. This round of the survey was launched on January 22, 2021 and results were compiled with data received till March 27, 2021. 2 For each survey round, two indices are computed – one based on assessment [viz., Business Assessment Index (BAI)] and another based on expectations [viz., Business Expectations Index (BEI)]. Each index is a composite indicator calculated as a simple average of nine business parameters, where each parameter is derived as a weighted net response, weights being the share of industry groups in gross value added (GVA). The nine parameters considered are: (1) overall business situation; (2) production; (3) order books; (4) inventory of raw material; (5) inventory of finished goods; (6) profit margins; (7) employment; (8) exports; and (9) capacity utilisation. BAI/BEI gives a snapshot of the business outlook in every quarter and takes values between 0 and 200, with 100 being the threshold separating expansion from contraction. 3 Net Response (NR) is the difference between the percentage of respondents reporting optimism and those reporting pessimism. It ranges between -100 to 100. Any value greater than zero indicates expansion/optimism and any value less than zero indicates contraction/pessimism. In other words, NR = (I – D), where, I is the percentage response of ‘Increase/optimism’, and D is the percentage response of ‘Decrease/pessimism’ and E is the percentage response as ‘no change/equal’ (i.e., I+D+E=100). For example, increase in production is optimism whereas decrease in cost of raw material is optimism. |