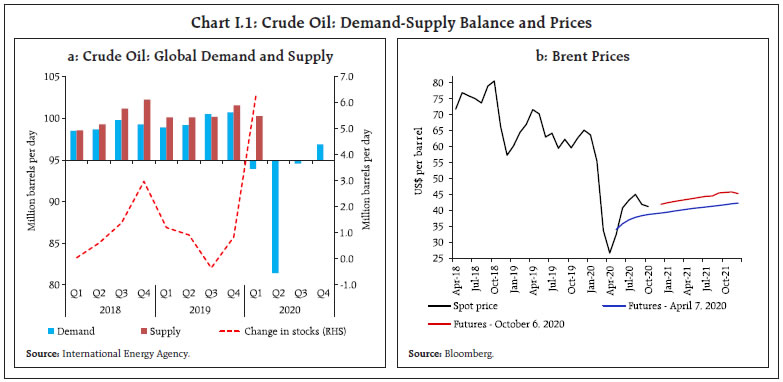
| I. Macroeconomic Outlook The global economy plunged into its deepest contraction in living memory in April-June 2020 as COVID-19 took its toll. In India, real GDP fell by a record low. Supply bottlenecks and higher taxes pushed inflation above the upper tolerance band of the target. Downside risks from a delayed vaccine, persistence of supply bottlenecks, volatile international financial markets and high food inflation acquiring a structural character are clear and present dangers to the macroeconomic outlook. 1.1 Key Developments Since the April 2020 MPR The COVID-19 pandemic has fundamentally altered the setting and conduct of monetary policy across the world. With the global economy having plunged into its deepest contraction in living memory in Q2:2020, with over 3.5 crore infections, including 10.4 lakh confirmed deaths as on October 7, 2020, with massive supply disruptions and demand destruction from employment and income losses on a scale not seen before, the unconventional has become conventional in the ethos of monetary policy making. Central banks have gone where they have feared to tread before: below the so-called zero lower bound on interest rates; to the outer limits of quantitative and credit easing and beyond. They have undertaken what even until recently they considered as the commission of original sins – the monetisation of fiscal deficits and the management of yield curves. Central bank communication has also turned a radical corner. Ultra-accommodative stances and more policy actions to fight the pandemic have been assured into the foreseeable future, even at the cost of volatility in financial markets shaken by this resolve, and untoward currency movements. This unprecedented monetary policy activism appears to have put equally unprecedented fiscal stimuli in the shade. In the event, their combined impulses have eased financial conditions substantially, helped buoy up global financial markets, and have driven up asset and commodity prices to a point widely regarded as a disconnect with the real economy. Crude oil prices have recovered since May on a gradual rise in demand and production cuts, before softening in September on concerns arising out of the surge in new infections. Gold prices remained elevated as heightened uncertainty continues to boost its safe haven appeal. Inflation, too, has rebounded, although it remains well below targets in advanced economies (AEs), but has risen more strongly on food prices in some emerging market economies (EMEs). The efficacy of these actions in reconstructing economic activity from the ravages of COVID-19 is yet to gain traction on a broad scale. In several economies, rebounds from troughs have begun in Q3, but the resurgence of infections and the lingering risk of a second wave in the absence of the elusive vaccine overshadows these early signs of revival, and contractions persist in several sectors. The balance of risks remains slanted to the downside. The next few quarters can be challenging. Global public debt is projected by the International Monetary Fund (IMF) at over 100 per cent of gross domestic product (GDP) in 2020. The G20 has supported time-bound suspension of the debt service obligations of the poorest countries. Model-based projections suggest that it could take several years for output and activity to recover to pre-pandemic levels in view of the lasting impact on potential output from the loss of human and physical capital. In India, with the second highest caseload in the world – over 67 lakh infections including 1 lakh deaths as of October 7, 2020, the highest daily infections, the severest lockdown in the world during April-May, and re-clamping of containment measures and localised lockdowns thereafter as infections surged into the interior, real GDP fell by a record 23.9 per cent year-on-year (y-o-y) in Q1:2020-21 (April-June 2020). Private consumption and investment slumped precipitously, only partly cushioned by government spending. On the supply side, industry as well as services sectors recorded deep contractions, and only agriculture exhibited resilience. Meanwhile, supply bottlenecks exacerbated by social distancing and higher taxes pushed up inflation sharply, with pressures evident in prices of both food and non-food items. At 6.7 per cent in August, consumer price index (CPI) inflation was ruling above the upper tolerance band of the inflation target, posing testing challenges for the conduct of monetary policy, going forward. Monetary Policy Committee: April-September 2020 The Monetary Policy Committee (MPC) met off-cycle on May 20-22, 2020 advancing its scheduled meeting in view of the exigencies imposed by COVID-19. The MPC noted that various sectors of the economy were experiencing more acute stress than initially anticipated and financial conditions needed further easing to prevent the deep distress in the economy, especially among the vulnerable and disadvantaged. While the inflation outlook remained uncertain, the forecast of a normal monsoon, subdued international commodity prices, deficient demand and favourable base effects offered some policy space. Against this backdrop, the MPC decided to cut the policy repo rate by 40 basis points (bps) to 4.0 per cent (5 members voted for a reduction of 40 bps while one member voted for a reduction of 25 bps) on top of the sizeable cut of 75 bps in its March 27 off-cycle meeting. Inflation surprised on the upside in the run up to the August 2020 meeting of the MPC. The persistence of supply chain disruptions and broad-based cost-push pressures were seen as keeping inflation elevated in Q2:2020-21 with some moderation only in H2:2020-21, aided by large favourable base effects. Real GDP growth for 2020-21 was expected to be negative. In these conditions, the recovery of the economy assumed primacy, but the MPC noted that the headline CPI prints of April-May 2020 required more clarity as the National Statistical Office (NSO) had to resort to imputations for many items as data collection was affected by the lockdowns. Given the uncertainty surrounding the inflation outlook and taking into consideration the extremely weak state of the economy in the midst of the unprecedented shock from the pandemic, the MPC decided unanimously that it was prudent to pause and remain watchful for a durable reduction in inflation to use the available space to support the revival of the economy. All members also voted to continue with the accommodative stance as long as necessary to revive growth and mitigate the impact of COVID-19 on the economy, while ensuring that inflation remains within the target going forward. The MPC’s voting pattern reflects the diversity in individual members’ assessments, expectations and policy preferences, a feature that is also reflected in voting patterns of other central banks (Table I.1). | Table I.1 Monetary Policy Committees and Voting Patterns | | Country | Policy Meetings: April - September 2020 | | Total Meetings | Meetings with Full Consensus | Meetings without Full Consensus | | Brazil | 4 | 4 | 0 | | Chile | 4 | 4 | 0 | | Colombia | 6 | 3 | 3 | | Czech Republic | 4 | 3 | 1 | | Hungary | 6 | 6 | 0 | | India | 2 | 1 | 1 | | Israel | 4 | 0 | 4 | | Japan | 5 | 0 | 5 | | South Africa | 4 | 1 | 3 | | Sweden | 3 | 3 | 0 | | Thailand | 4 | 3 | 1 | | UK | 4 | 4 | 0 | | US | 4 | 4 | 0 | | Source: Central bank websites. | Macroeconomic Outlook Chapters II and III analyse macroeconomic developments during H1:2020-21 (April-September). For the projections set out in this Chapter, the evolution of key macroeconomic and financial variables over the past six months warrants revisions in the baseline assumptions made in the April 2020 MPR (Table I.2). First, global crude prices have remained volatile on COVID-19-related uncertainty. An unprecedented spike occurred on April 20 when, for the first time ever, West Texas Intermediate (WTI) front month prices turned negative (US$ (-) 37.6 per barrel). Supported by the agreement between the Organization of the Petroleum Exporting Countries (OPEC) and non-OPEC partners (OPEC plus) in April 2020 to cut oil production by a record 9.7 million barrels a day, Brent prices recovered from US$ 19 per barrel in April to around US$ 45 in August, before softening in September (Chart I.1). Considering these developments, crude prices (Indian basket) are assumed at US$ 40.9 in the baseline, 17 per cent above the April MPR baseline. Second, the nominal exchange rate (the Indian rupee or INR vis-à-vis the US dollar) has moved in both directions since April 2020. The INR remained under depreciating pressures in April due to the generalised flight out of EMEs to the safety of the US dollar amidst COVID-related concerns. After being largely range-bound during May-July, the INR exhibited an appreciating bias in August. This was driven by the surge in portfolio inflows to India on expectations of highly accommodative monetary policies in advanced economies continuing for longer, and improving prospects of potential vaccines for COVID-19. In the light of these developments, the exchange rate is assumed at INR 73.6 per US dollar in the baseline. | Table I.2: Baseline Assumptions for Projections | | Indicator | MPR April 2020 | MPR October 2020 | | Crude Oil (Indian basket) | US$ 35 per barrel during 2020-21 | US$ 40.9 per barrel during 2020-21 | | Exchange rate | ₹ 75/US$ | ₹ 73.6/US$ | | Monsoon | Normal for 2020 | 9 per cent above long period average | | Global growth | Contraction in 2020 | -4.9 per cent in 2020
5.4 per cent in 2021 | | Fiscal deficit (per cent of GDP) | To remain within BE 2020-21
Centre: 3.5
Combined: 6.1 | Given the Covid-19 impact on activity, revenues and expenditures and factoring in the additional borrowings announced, fiscal deficits are expected to be significantly higher | | Domestic macroeconomic/ structural policies during the forecast period | No major change | No major change | Notes: 1. The Indian basket of crude oil represents a derived numeraire comprising sour grade (Oman and Dubai average) and sweet grade (Brent) crude oil.
2. The exchange rate path assumed here is for the purpose of generating the baseline projections and does not indicate any ‘view’ on the level of the exchange rate. The Reserve Bank is guided by the objective of containing excess volatility in the foreign exchange market and not by any specific level of and/or band around the exchange rate.
3. BE: Budget estimates.
4. Combined fiscal deficit refers to that of the Centre and States taken together.
Sources: RBI estimates; Budget documents; and IMF. |
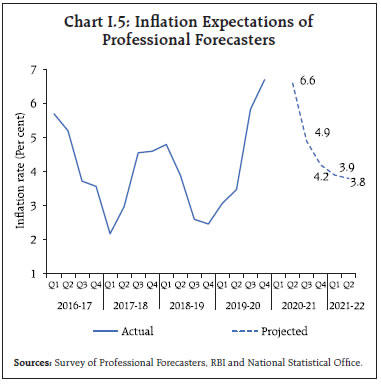
 Third, global economic activity has underperformed significantly relative to the April outlook. Global merchandise trade volumes fell by 14.3 per cent in Q2:2020 and the World Trade Organization’s Goods Trade Barometer points to only partial upticks in Q3. The global composite Purchasing Managers’ Index (PMI) moved into expansion zone in July-September after remaining in contraction for five months, but the outlook remains uncertain in view of the resurgence in infections in some AEs and EMEs. The IMF expects the global economy to contract by 4.9 per cent in 2020 (Chart I.2), while the World Bank and the OECD have projected a decline of 5.2 per cent and 4.5 per cent, respectively. I.2 The Outlook for Inflation Headline CPI inflation breached the upper tolerance band of the target during June-August 2020, propelled by a broad-based propagation of strong upside pressures (Chapter II). Supply chain disruptions and higher taxes on petroleum products and other items imparted these upward pressures on inflation in spite of muted demand conditions. Data-related uncertainties, as complete coverage of markets and quotes was disrupted by lockdowns, complicate the assessment of the outlook. Looking ahead, three months ahead median inflation expectations of urban households fell by 10 bps in the September 2020 round of the Reserve Bank’s survey while one year ahead median inflation expectations remained unchanged.1 The proportion of respondents expecting the general price level to increase by more than the current rate rose for both horizons vis-à-vis the previous round (Chart I.3). According to the Reserve Bank’s consumer confidence survey for September 2020, one year ahead inflation expectations remained at elevated level. Manufacturing firms polled in the July-September 2020 round of the Reserve Bank’s industrial outlook survey expected selling prices to remain unchanged in Q3:2020-21 on the back of benign input cost pressures (Chart I.4).2 The PMI for the manufacturing sector reported higher input prices in September though the rate of cost inflation softened from August 2020; output prices broadly stabilised in September after falling for five months in a row. Services sector firms also reported higher input costs due to fuel, meat and vegetables and some increase in output prices. Professional forecasters surveyed by the Reserve Bank in September 2020 expected CPI inflation to moderate from 6.7 per cent in August 2020 to 4.2 per cent in Q4:2020-21 and 3.8 per cent in Q2:2021-22 (Chart I.5).3 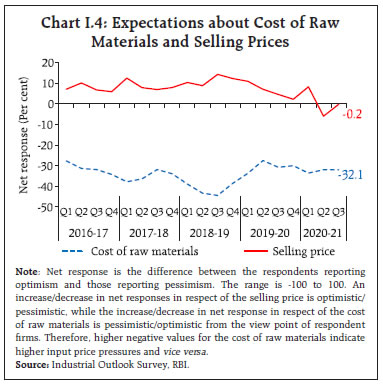
 A bumper rabi crop, moderate increases in minimum support prices (MSPs) for kharif crops, a normal monsoon, sizeable buffer stocks and good water storage levels in major reservoirs augur well for the inflation outlook. At the same time, the persistence of COVID-related supply bottlenecks, higher taxes and their cost-push implications could impart upward pressures on inflation. The inflation outlook will also depend on trade policies and effective supply management measures with respect to key inflation-sensitive items. As noted in the Monetary Policy Report of April 2020, the uncertainty about the depth, spread and duration of COVID-19 can produce drastic changes in the outlook. Hence, macroeconomic forecasts are subject to large revisions with every incoming data on the pandemic. The RBI Act, however, enjoins the Reserve Bank to, inter alia, publish and explain in the MPR the forecasts of inflation for 6-18 months from the date of its publication. Taking into consideration the statutory requirements, the initial conditions, the signals from forward-looking surveys and estimates from time-series and structural models, CPI inflation is projected at 6.8 per cent in Q2:2020-21; subsequently, large favourable base effects are expected to pull it down to 5.4 per cent in Q3, and 4.5 per cent in Q4 (Chart I.6). The 50 per cent and the 70 per cent confidence intervals for headline inflation in Q4:2020-21 are 3.2-5.9 per cent and 2.4-6.6 per cent, respectively. 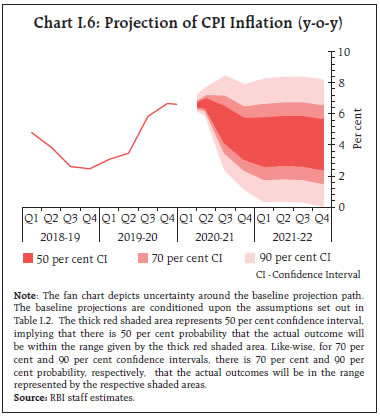 For 2021-22, assuming a normalisation of supply chains with the availability of effective vaccines against COVID-19, a normal monsoon, and no major exogenous or policy shocks, structural model estimates indicate that inflation will move in a range of 4.1-4.4 per cent. The 50 per cent and the 70 per cent confidence intervals for Q4:2021-22 are 2.5-5.8 per cent and 1.6-6.6 per cent, respectively. As explained earlier, an unusually high amount of uncertainty surrounds the inflation outlook. In particular, the persistence of the pandemic and delay in vaccine development could render projections of key macroeconomic variables even more uncertain (Box I.1). Box I.1: What will the Post-COVID Growth-Inflation Trajectory Look Like? Illustrative Simulations from the Quarterly Projection Model Under COVID-19 conditions, real GDP in India is projected to contract in 2020-21 under the baseline scenario, reflecting both demand and supply shocks. In contrast, consumer price inflation remains elevated, suggesting that supply bottlenecks are outweighing the softening impact expected from weaker demand. These counterintuitive inflation dynamics have complicated the macroeconomic outlook. The baseline scenario assumes that the recent spike in inflation is transient, and that there is no second wave of infections. Accordingly, two alternate scenarios are explored. A favourable scenario (Scenario 1) assumes a faster normalisation of supply chains on the back of an early breakthrough in the development of vaccines. On the other hand, an adverse scenario (Scenario 2) is built on assumptions of (i) a second wave of infections, pulling down global and domestic growth even further; (ii) recent inflation pressures taking a more persistent path a la 2009-10; (iii) a structural component crystallising in higher fiscal deficit and public debt, with implications for the inflation outlook; and (iv) heightened volatility in capital flows and exchange rates. The Quarterly Projection Model (QPM)4 - a semi-structural, forward-looking, open economy, calibrated, gap model in the New Keynesian tradition - is used to explore these alternate scenarios. In Scenario 1, the faster normalisation of supply chains leads to lower output losses in 2020-21 relative to the baseline. Real GDP contracts by 7.5 per cent in this scenario vis-à-vis the baseline of 9.5 per cent (Chart I.1.1). The GDP growth rebound in 2021-22 is stronger at 11.6 per cent in this benign scenario relative to 10.1 per cent in the baseline. Favourable base effects, normal supply chains and anchored inflation expectations contribute to a reduction in inflation from 4.1 per cent in the baseline to 4.0 per cent in Q4:2021-22, aligning it with the target. 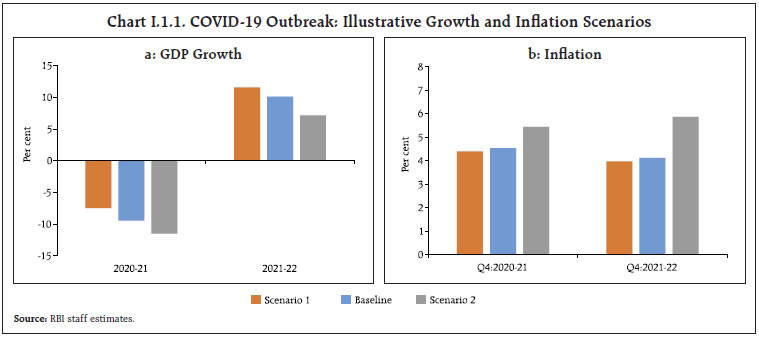 In the adverse case (Scenario 2), real GDP records a deeper contraction in 2020-21 (-11.5 per cent) and the recovery is tepid in 2021-22 (7.2 per cent). Persistent supply distortions, pressures on operating costs and unhinged expectations keep inflation elevated, more than offsetting the impact of weak demand conditions both in 2020-21 and 2021-22. Volatile capital flows and downward pressure on the exchange rate add to pressure on inflation, keeping it at 5.9 per cent in Q4:2021-22, close to the upper tolerance band, and 1.8 percentage points above the baseline. Overall, this scenario brings to the fore the trade-offs between the inflation objective and that of stabilising output. | I.3 The Outlook for Growth Real GDP declined by an unprecedented 23.9 per cent in Q1:2020-21 and domestic economic activity remains badly hit by the unrelenting pandemic. High frequency indicators, which were looking up in June with the phased unlocking of the economy, levelled off in July amidst re-imposition of local lockdowns due to a surge in fresh cases. In August, some indicators started improving again and strengthened in September. The agricultural sector remains a bright spot, supported by a normal monsoon, robust kharif sowing and adequate reservoir levels. The Pradhan Mantri Garib Kalyan Rojgar Yojana and increased wages under the Mahatma Gandhi National Rural Employment Guarantee Act (MGNREGA) are also supporting rural demand. On the other hand, urban demand remains weak. Indicators relating to industry and services present a mixed picture. Turning to the forward-looking surveys, consumer confidence for the year ahead improved in the September 2020 round, driven by improved sentiments on the general economic situation, the employment scenario and income (Chart I.7).5 The current situation index, however, fell to an all-time low in September 2020. Sentiments in the manufacturing sector for the quarter ahead bounced back into the expansion zone in the July-September 2020 round of the Reserve Bank’s industrial outlook survey, reflecting optimism on the overall business situation, production, order books, employment, exports and capacity utilisation (Chart I.8).
| Table I.3: Business Expectations Surveys | | Item | NCAER Business Confidence Index
(August 2020) | FICCI Overall Business Confidence Index
(August 2020) | Dun and Bradstreet Composite Business Optimism Index
(August 2020) | CII Business Confidence Index
(July 2020) | | Current level of the index | 46.4 | 50.6 | 29.4 | 41.0 | | Index as per previous survey | 77.4 | 42.9 | 49.4 | 53.4 | | % change (q-o-q) sequential | -40.1 | 17.9 | -40.6 | -23.2 | | % change (y-o-y) | -62.0 | -14.4 | -58.0 | -31.2 | Notes:
1. NCAER: National Council of Applied Economic Research.
2. FICCI: Federation of Indian Chambers of Commerce & Industry.
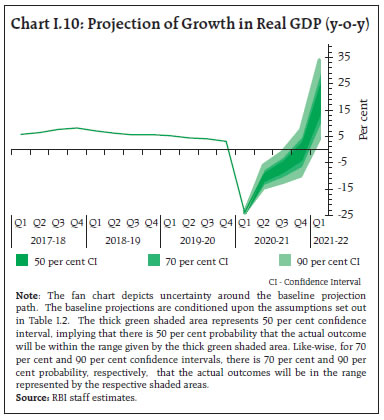
3. CII: Confederation of Indian Industry. | Surveys by other agencies indicate a mixed picture on future business expectations (Table I.3). According to the PMI for September 2020, the one year ahead business expectations of firms in the manufacturing sector strengthened on hopes of improvement in demand, while the expectations of firms in the services sector also turned somewhat optimistic after four months of negative or neutral sentiment. Professional forecasters polled in the September 2020 round of the Reserve Bank’s survey expected real GDP growth to remain in negative territory through Q3:2020-21, with a sharp pick up in Q1:2021-22 driven by base effects (Chart I.9 and Table I.4). Overall, the uncertainty about COVID-19’s spread and trajectory continues to fog the outlook and makes forecasts of real GDP growth extremely challenging. The baseline assumes that economic activity will gradually normalise in H2:2020-21, but a wide range of outcomes is possible. Taking into account the baseline assumptions, the survey indicators, and model forecasts, real GDP is projected to contract by 9.5 per cent in 2020-21, with risks tilted to the downside: (-)9.8 per cent in Q2, (-)5.6 per cent in Q3 and 0.5 per cent in Q4 (Chart I.10 and Table I.4). For 2021-22, assuming supply chains are fully restored with the availability of effective vaccines, a normal monsoon, no major exogenous or policy shocks and a large favourable base effect, structural model estimates indicate real GDP growth at 10.1 per cent. In such an environment, the significant monetary accommodation already provided through cuts in the policy repo rate, and ample liquidity infusion through conventional and unconventional measures and fiscal stimulus and other structural reform measures announced by the government would be expected to add to the upside. On the other hand, a more protracted spread of the pandemic, delayed development and availability of vaccines, deviations from the forecast of a normal monsoon in 2021-22 and global financial market volatility are the key downside risks. The recent inflation elevation acquiring a persistent character also poses downside risks to the baseline. 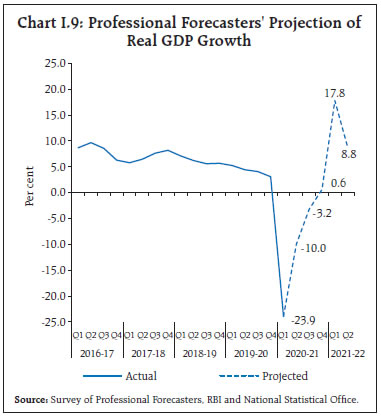
| Table I.4: Projections - Reserve Bank and Professional Forecasters | | (Per cent) | | | 2020-21 | 2021-22 | | Reserve Bank’s Baseline Projections | | | | Inflation, Q4 (y-o-y) | 4.5 | 4.1 | | Real GDP growth | -9.5 | 10.1 | | Median Projections of Professional Forecasters | | | | Inflation, Q4 (y-o-y) | 4.2 | - | | Real GDP growth | -9.1 | 8.2 | | Gross domestic saving (per cent of GNDI) | 26.0 | 27.0 | | Gross capital formation (per cent of GDP) | 25.4 | 27.7 | | Credit growth of scheduled commercial banks | 5.0 | 8.5 | | Combined gross fiscal deficit (per cent of GDP) | 12.0 | 9.0 | | Central government gross fiscal deficit (per cent of GDP) | 7.5 | 5.5 | | Repo rate (end-period) | 4.0 | - | | Yield on 91-days treasury bills (end-period) | 3.4 | 4.0 | | Yield on 10-year central government securities (end-period) | 6.0 | 6.5 | | Overall balance of payments (US$ billion) | 71.3 | 50.0 | | Merchandise exports growth | -14.7 | 10.2 | | Merchandise imports growth | -22.7 | 20.6 | | Current account balance (per cent of GDP) | 0.5 | -0.6 | Note: GNDI: Gross National Disposable Income.
Sources: RBI staff estimates; and Survey of Professional Forecasters (September 2020). |
 I.4 Balance of Risks The baseline projections of inflation and growth are conditional on the assumptions relating to the key variables set out in the preceding sections. Uncertainties surrounding these assumptions, especially relating to COVID-19, could lead to large deviations in either direction. This section assesses the balance of risks to the baseline projections in plausible alternative scenarios. (i) Global Growth Uncertainties The global output losses from COVID-19 have turned out to be more severe than anticipated, despite sizeable monetary and fiscal stimuli by many countries. Given the spread of the pandemic and recurrent bouts of resurgence, the recovery is expected to be protracted and there are large downside risks to the baseline assumptions. In such a scenario, the quarterly projection model’s simulations suggest that if global growth slips by 100 bps vis-à-vis the baseline, domestic growth and inflation could be lower by around 40 bps and 20 bps, respectively, from the baseline trajectories. Conversely, an early breakthrough in the development of an effective COVID-19 vaccine and its widespread distribution could boost global trade and demand. In this scenario, assuming global growth surprises by 100 bps on the upside, domestic growth and inflation could edge higher by around 40 bps and 20 bps, respectively (Charts I.11a and I.12a). (ii) International Crude Oil Prices Crude prices rebounded from May 2020 on the back of supply cuts by oil producing countries (OPEC plus) and improved demand prospects due to the gradual easing of lockdown restrictions. Looking ahead, international crude prices may increase more than expected in the event of a quicker containment of COVID-19, a sharper global recovery or an agreement among suppliers on further production cuts. For a net energy importer like India, the dynamics of international crude price movements have significant macroeconomic implications. Assuming crude prices are 10 per cent higher, inflation could increase by 30 bps and growth could be weaker by around 20 bps over the baseline. Conversely, crude prices could soften from the current levels if the agreed production cuts are not adhered to or a second wave of the pandemic further weakens the demand for oil. In this event, if crude prices fall by 10 per cent, inflation could ease by around 30 bps with a boost of 20 bps to growth (Charts I.11a and I.12a). 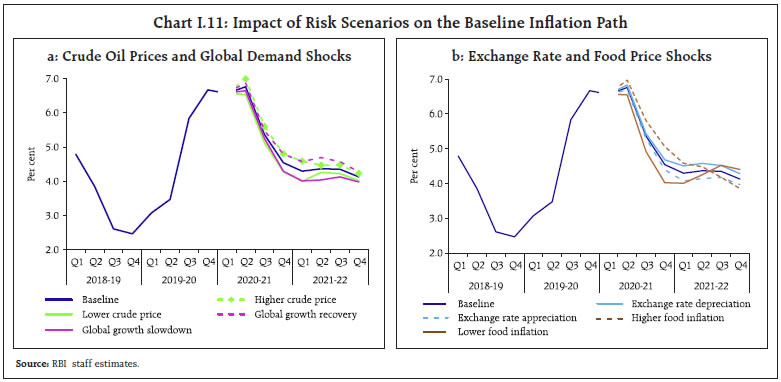
 (iii) Exchange Rate The INR has exhibited two-way movements over the past six months, reflecting global risk-on risk-off sentiments driven by vacillating views on the spread and containment of COVID-19. A renewed surge in COVID-19 infections and safe haven demand could induce capital outflows across EMEs, putting depreciation pressure on the INR. If the INR depreciates by 5 per cent from the baseline, inflation could edge up by around 20 bps and GDP growth could be higher by 15 bps (Charts I.11b and I.12b). On the other hand, if COVID-19 normalises quicker than assumed under the baseline, strong capital inflows could put appreciating pressure on the INR. In such a scenario, if the INR appreciates by 5 per cent, inflation and GDP growth could moderate by around 20 bps and 15 bps, respectively, vis-à-vis the baseline. (iv) Food Inflation Food inflation has remained elevated in recent months driven by price pressures in vegetables, cereals and protein items such as pulses, eggs and meat. The normal south-west monsoon, increased sowing of kharif crops, moderate MSP hikes, and high reservoir storage are expected to soften food inflation going forward. However, a delayed normalisation of supply chains, heavy rains and floods in some states and demand-supply imbalances in key items such as pulses could exert further upward pressure on the headline inflation and keep it higher by around 50 bps (Charts I.11b and I.12b). On the other hand, an accelerated softening of food inflation due to an early restoration of supply chains, ample buffer stocks and efficient food stock management by the Government could bring headline inflation below the baseline by up to 50 bps. I.5 Conclusion At this juncture, global outlook is heavily contingent upon the uncertain trajectory of COVID-19, with significant implications for key variables such as crude oil and commodity prices, global growth, and financial markets. Consequently, the forecasts for domestic inflation and output could change significantly relative to baseline expectations. The behaviour of inflation holds the key to the conduct of monetary policy going forward. The gradual restoration of supply lines, good progress of kharif sowing, sizeable buffer stocks, effective food supply management and a faster progress on the vaccine could pull inflation down from current elevated levels and open up space for addressing the urgent need to repair and revive the economy from the blows it has suffered from the pandemic. Yet, the downside risks from a delayed vaccine, more than expected persistence of supply bottlenecks, volatile international financial markets and high food inflation acquiring a structural character and spilling to non-food items are clear and present dangers that could potentially push inflation above the baseline. By current assessment, real GDP growth can post a modest recovery during H2:2020-21, aided by early containment of COVID-19 and the monetary and fiscal stimuli. Nonetheless, it is prudent to recognise and brace up for the downside risks described earlier.
_________________________________________________________
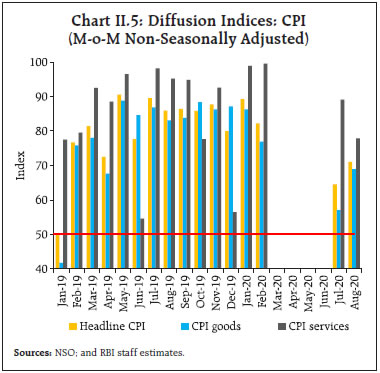
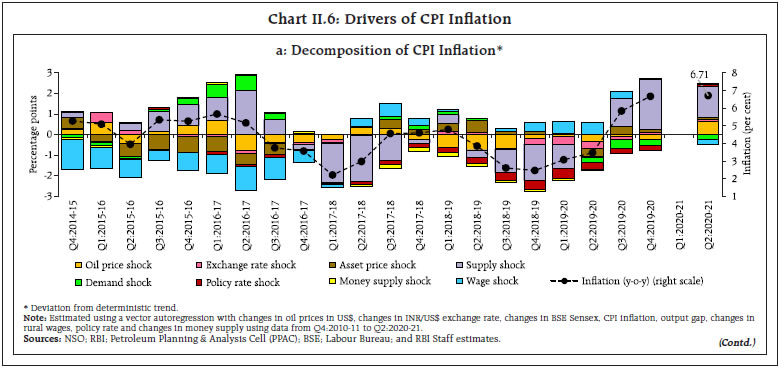
II. Prices and Costs A broad-based elevation in consumer price index (CPI) inflation between March and July 2020 emanated from tight demand supply balances in protein-based food items, floods damaging the output of vegetables, increase in retail margins due to the pandemic, tax increases in petrol and diesel, safe haven demand for gold and cost-push pressures. At the time of the Monetary Policy Report (MPR) of April 2020, headline inflation1, which was ruling above the upper tolerance level of the inflation target, was projected to decline, with rabi crop arrivals inducing a softening of food inflation. COVID-19 has drastically altered that prognosis. The pandemic and the response in the form of social distancing and the severest lockdown in the world caused a virtual seizure of transactions in non-essential items and threw into complete disarray the price collection system. The National Statistical Office (NSO) suspended the publication of the headline consumer price index (CPI) for April and May. It was not until July 13, 2020 with the lifting of some pandemic-related restrictions and the partial restoration of non-essential activities that the provisional index for June 2020 could be compiled. Even so, prices could be collected from 1030 urban markets and 998 villages that accounted for only 88 per cent of the total sample. As such, the data collected did not meet the adequacy criteria for generating robust estimates of CPI at the state level. Headline indices for April and May were imputed for business continuity purposes. In its resolution of August 6, 2020, the monetary policy committee (MPC) expressed the view that for the purpose of monetary policy formulation and conduct, the imputed prints for April and May can be regarded as a break in the CPI series. In terms of acceptable standards of data collection, it is appropriate to compare the headline inflation reading for July 2020 with that of March 2020. The surge in inflation by 90 basis points between these reference dates was diffused across the board, partly offset by a significant moderation in fuel inflation (Chart II.1). 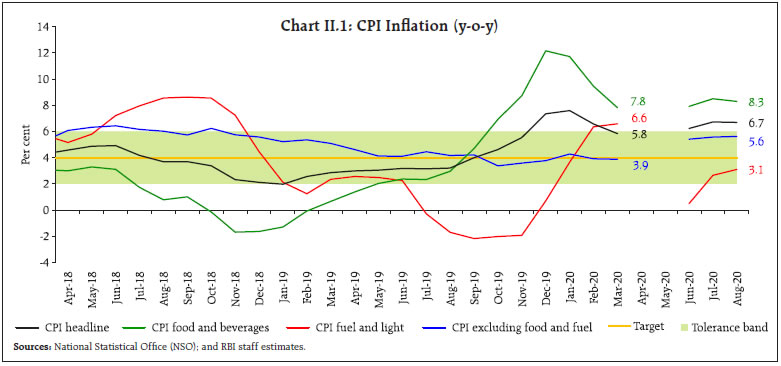 The Reserve Bank of India (RBI) Act, 1934 (amended in 2016) enjoins the RBI to set out deviations of actual inflation outcomes from projections, if any, and explain the underlying reasons thereof. The April 2020 MPR had projected a moderation in CPI inflation during H1:2020-21 from 6.6 per cent in Q4:2019-20 to 4.8 per cent in Q1:2020-21 and to 4.4 per cent in Q2:2020-21, with the caveat that the uncertainty about the depth, spread and duration of COVID-19 could produce drastic changes in these forecasts. With data for Q1 being regarded as a break in the CPI series as cited above, actual inflation outcomes overshot projections by 2.3 percentage points in Q2 (Chart II.2), largely reflecting the destructive impact of COVID-19. Price spikes became evident in April during the nation-wide lockdown as usurious margins chased panic buying and stocking. Although there was some ebbing in May, these price pressures resurfaced in June and persisted in July-August due to a variety of shocks: an increase in the prices of vegetables due to floods in eastern India; elevated edible oils prices on the back of higher international prices; pressures on meat and fish prices once the initial apprehension of their link with COVID-19 infections was allayed; and supply bottlenecks in the availability of cereals and pulses. From February 2020, international gold prices increased to historic highs on safe haven demand, pushing up prices of personal care and effects by around 10 per cent. International crude oil prices jumped from US $35 per barrel assumed in the April MPR to US $44 per barrel by end-August. Domestic petrol and diesel pump prices rose more than proportionately in view of the sharp increase in excise duties on petrol and diesel by ₹10 per litre and ₹13 per litre, respectively, and state VAT by up to ₹7 per litre in the post-lockdown period. Inflation excluding food, fuel, petrol, diesel and gold from the CPI edged up as costs associated with disruption of supply chains, labour shortages and transportation fed into a host of goods and services. Overall, the supply shocks caused by COVID-19 overwhelmed the collapse in demand. 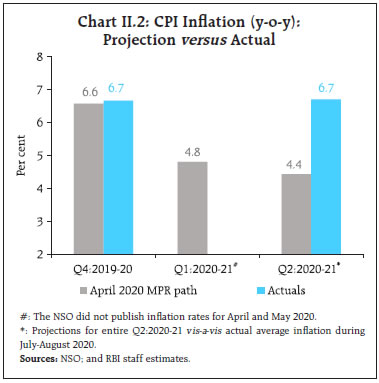 II.1 Base Effect and Momentum A decomposition of changes in year-on-year (y-o-y) inflation2 indicates that the sharp increase in headline inflation between March and July was the result of a substantial and broad-based jump in price momentum. By August, the price momentum moderated across food and core groups, and declined in respect of the fuel group; however, favourable base effects across food and core also diminished in August, resulting in headline inflation remaining broadly unchanged at 6.7 per cent during July and August (Chart II.3). The distribution of CPI inflation over January-August 20203 reveals that the median inflation rate shifted up to 4.6 per cent from around 4 per cent in recent years, indicating a broad-based increase in price pressures (Chart II.4). The diffusion indices of price changes in CPI items4 on a non-seasonally adjusted basis5 also attest to this cross-sectional spread of price increases in the post-lockdown period (Chart II.5). II.2 Drivers of Inflation A historical decomposition in a vector autoregression (VAR) framework can help to disentangle the relative role of various factors driving the inflation process. This empirical analysis indicates the predominant role of unfavourable supply side shocks in keeping inflation at elevated levels in recent quarters. Food supply and crude oil price shocks together contributed around 80 per cent of the deviation in inflation from target in Q2:2020-21 (Chart II.6a). Muted demand conditions contributed negatively to the inflation deviation by around 10 per cent in Q2 but were dwarfed by the supply-side shocks. The sizeable repo rate cuts, expansion in money supply and the firming up of equity prices – representing asset prices – together contributed around 10 per cent to the inflation deviation in Q2.6 
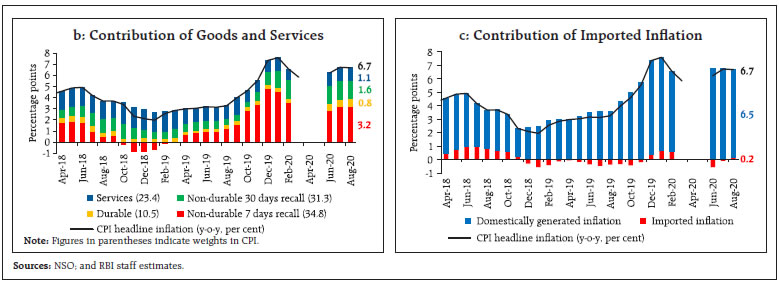 The contribution of perishable goods (non-durable goods with a 7-day recall7) in overall inflation, during June-August 2020, remained elevated at 46.8 per cent due to supply disruptions. Semi-perishable goods (non-durable goods with a 30-day recall) and durable goods contributed to headline inflation to the extent of 35.7 per cent. During June-August 2020, the contribution of services to headline inflation also edged up to 17.5 per cent compared to February 2020 (15.1 per cent), indicating generalised cost-push pressures (Chart II.6b). Contributions to headline inflation from imported components8 turned positive and amounted to 0.2 percentage points in August 2020 (Chart II.6c). Food Group Food inflation, which was at 7.8 per cent in March, increased to 8.4 per cent by July-August, reflecting primarily the impact of adverse supply shocks. Protein-based food items, especially meat products and pulses, emerged as the key driver and their contribution to overall food inflation also remained elevated (Chart II.7a). Elevated inflation pressures in milk prices also contributed to the surge (Chart II.7b). Inflation in prices of oils and fats and spices was in double digits in H1:2020-21 creating another pressure point. Taken together, the price build-up was close to historical average (Chart II.8). In the case of cereals (weight of 9.7 per cent in the CPI and 21.1 per cent in the food and beverages group), the conundrum of co-existing supply gluts and price pressures complicated inflation dynamics. Cereals inflation remained elevated despite massive buffer stockpiling after the nation-wide lockdown on account of higher procurement. With the easing of lockdown conditions, cereals prices moderated in July-August 2020. Inflation in prices of vegetables (weight of 6.0 per cent in the CPI and 13.2 per cent in the food and beverages group) exhibited high volatility (Chart II.9). Potato price inflation remained elevated at 79.5 per cent in August 2020, contributing 10.6 per cent to headline inflation. Unseasonal rain in Uttar Pradesh in March 2020 and cyclone-related damage to the crop in West Bengal in May 2020, the two major potato producing states, resulted in considerable supply disruptions. Price pressure in potatoes were further exacerbated by labour shortages at mandis, lower stock availability in cold storage and higher exports during 2019-20. 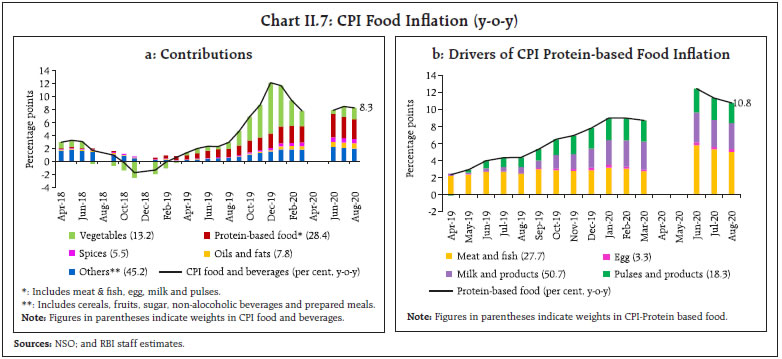 Inflation in onion prices surged from September 2019 onwards and reached a peak of 327.4 per cent in December 2019, contributing 4.8 percentage points to food inflation and 2.1 percentage points to headline inflation. These spikes generally occur in the lean months of July-September during which the entire domestic supply is met through onions procured in the rabi season. With the arrival of the late kharif crop and a large rabi crop, onion prices went into deflation of (-) 4.0 per cent in August 2020. Prices of tomatoes picked up during June-July 2020 due to lower supplies coming from damage to crops in some regions from pre-monsoon rains. Anecdotal evidence suggests that farmers in some states/areas planted less area with tomatoes than a year ago due to the collapse of prices in major centres in May 2020, which might have also contributed to the spike in prices in July. Tomato prices eased slightly in August 2020, with fresh supplies coming into the market.
Inflation in prices of fruits (weight of 2.9 per cent in the CPI and 6.3 per cent within the food and beverages group) declined from a peak of 5.8 per cent in January 2020 to 0.1 per cent in July 2020 but picked up to 1.0 per cent in August 2020 due to higher demand for dry fruits during the pandemic. Within protein-based food items (weight of 13.0 per cent in the CPI and 28.4 per cent in the food and beverages group), inflation in prices of pulses (weight of 2.4 per cent in the CPI and 5.2 per cent in the food and beverages group) exhibits a cobweb phenomenon – lower production and higher prices in a deficit season spur increased acreage in the following season, leading to excess supply and consequent fall in prices. In the short-run, demand-supply mismatches are met mainly through imports, the transit time varying and imposing volatility (Chart II.10). The decline in kharif pulses production (by 4.6 per cent in the 4th advance estimates for 2019-20 over 2018-19 final estimates) and especially, urad production (by 44.9 per cent) led to persistent price pressures, which were accentuated by lockdown-related supply uncertainties and stockpiling by consumers during April-May 2020. With the easing of the lockdown and improved kharif sowing, pulses inflation eased to 14.4 per cent in August.  Inflation in prices of meat and fish (weight of 3.6 per cent in the CPI and 7.9 per cent within the food and beverages group) increased from 9.2 per cent in March to 18.9 per cent in June 2020 before moderating to 16.5 per cent in August 2020. Prices of chicken and eggs eased during February-March 2020 due to a fall in consumption demand on pandemic fears, with poultry farmers culling to avoid feeding costs. With demand recovering from May, inflation in prices of chicken rose to 25.4 per cent in June 2020 while inflation in prices of eggs increased to 10.1 per cent in August 2020. With the onset of the rainy season, prices of mutton, fish and chicken eased as per the usual seasonal pattern in July-August 2020. Milk and products price inflation (weight of 6.6 per cent in the CPI and 14.4 per cent in the food and beverages group), which were impacted by price hikes by major co-operatives last year (in May 2019 and December 2019), remained elevated at 6.2 per cent in August due to supply disruptions. Higher global prices of skimmed milk products also impacted domestic prices. Inflation in prices of sugar and confectionery (weight of 1.4 per cent in the CPI and 3.0 per cent in the food and beverages group) moderated from 3.9 per cent in March to 2.9 per cent in June due to the decline in demand from bulk segments (hotels and restaurants). In July 2020, Andhra Pradesh increased the PDS sugar prices from ₹20 per kg to ₹34 per kg imparting pressures to both PDS and non-PDS sugar prices. Inflation in prices of oils and fats (weight of 3.6 per cent in the CPI and 7.8 per cent in the food and beverages group) increased in January 2020 and remained elevated, reaching 12.4 per cent in August 2020. The rise in global prices of this highly import dependent item was the major reason for the firming up of domestic prices. Domestically, lower production of rapeseed, mustard and soybeans (as per the 4th advance estimates for 2019-20) added to the price pressures. Fuel Group Inflation in fuel prices moderated from 6.4 per cent in February 2020 to 0.5 per cent in June due to a steep fall in domestic LPG and kerosene prices in tandem with the collapse in international benchmark product prices (Chart II.11a). Subsidised domestic kerosene prices firmed up till March and the domestic kerosene price was higher than international prices for the first time. Accordingly, oil marketing companies (OMCs) stopped the calibrated increase in administered kerosene prices from April and linked them to international prices movements with price revisions at the start of every month. As a result, domestic kerosene prices fell sharply during April-May, tracking international prices. By July 2020, international prices reversed, and domestic LPG and kerosene prices edged up (Chart II.11b and Chart II.11c). Prices of items of rural fuel consumption registered some moderation in the post-lockdown period, but the contribution of electricity prices to overall fuel inflation increased (Chart II.11a). CPI excluding Food and Fuel CPI inflation excluding food and fuel (core inflation) rose from 3.9 per cent in February-March 2020 to 5.6 per cent in July-August (Chart II.12). This price build-up was much higher than the historical average (Chart II.13). 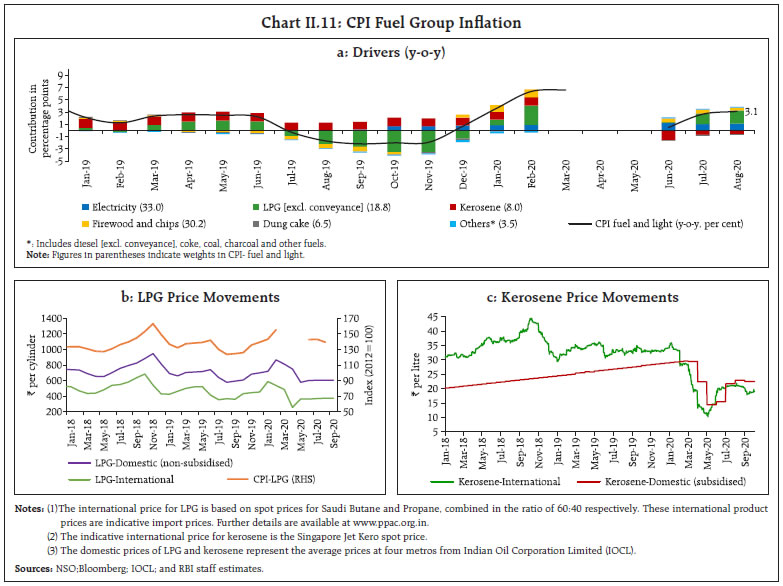
 International crude oil prices plummeted after the imposition of lockdowns globally, pulling down the price of Indian basket of crude oil to around US$ 16 per barrel on April 21, 2020. Thereafter, the Indian basket crude oil price increased to US$ 44 per barrel by end-August 2020. With the incidence of higher taxes, domestic petrol pump prices9 increased from ₹72.4 per litre at end-March to ₹84.8 per litre by end-August (Chart II.14a). On May 6, 2020, the central government raised the excise duty on petrol and diesel again10 by ₹10 per litre and ₹13 per litre, respectively. There was, however, no commensurate increase in the pump prices, as it was absorbed into the large mark-up over international prices.11 Faced with large revenue shortfalls, various states also increased value added taxes (VATs) since early April12. Coupled with the increase in international prices, this pushed up domestic pump prices sharply during June. CPI petrol inflation jumped from 3.2 per cent in February to 12.1 per cent in August 2020. On the other hand, inflation in respect of wholesale prices of petrol and diesel, which captures prices net of any tax impact, moved from (-) 1.5 per cent in February to (-) 33.4 per cent in May and to (-) 14.2 per cent in August, broadly mirroring international price movements (Chart II.14b). 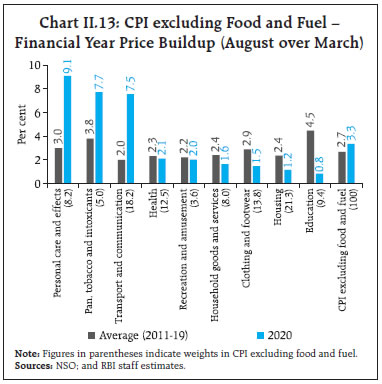
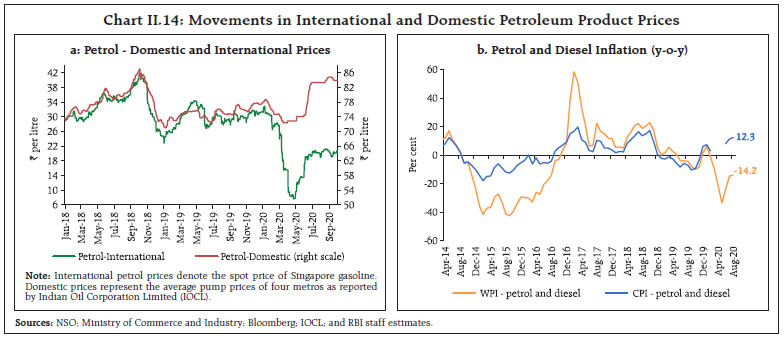 Even abstracting from the effects of prices of petroleum products, CPI inflation excluding food, fuel, petrol and diesel increased from 4.0 per cent in February to 5.4 per cent in July-August 2020. A major contributor was the increase in gold prices to historic highs by August 2020. CPI inflation excluding food, fuel, petrol, diesel, gold and silver also increased from 3.6 per cent in February 2020 to 4.5 per cent in July-August 2020, indicating broad-based cost-push pressures in the post-lockdown period that were more acute in urban areas than in rural areas (Box II.1). Inflation in the prices of goods component of CPI excluding food, fuel, petrol, diesel, gold and silver (with a weight of 20.7 per cent in CPI) rose from 2.9 per cent in February 2020 to 4.7 per cent in August 2020 due to pan, tobacco and intoxicants, transport and communications goods, clothing and footwear and household goods (Chart II.15a). Box II.1: Whose Inflation is It? The Rural-Urban Divide Compilation of all-India CPI entails a bottom-up aggregation process, starting from state-wise price indices for rural and urban areas. Any inflation impulse at the national level has thus an underlying rural-urban distinction as was evident in the onion price shock of November 2019-February 2020 and the COVID-19 related lockdown shock of June-August 2020. The former saw similar inflation distributions in the rural and urban areas with fat tails due to spike in vegetable inflation, whereas the rural-urban inflation distributions showed divergence post lockdown (Chart II.1.1). During June-August, 2020 urban inflation was predominantly concentrated in the non-food sub-groups. Inflation in the prices of household goods and services was higher in urban areas by 2.9 percentage points. On the other hand, rural areas saw substantially higher vegetables inflation in the post-lockdown period (Chart II.1.2). In the past, these divergences have been short-lived; over time, there is an inherent tendency for rural and urban inflation to converge and this is reflected in data for most recent months (Bhoi et al., 2020). An empirical exercise using fully modified ordinary least squares (FMOLS), based on monthly inflation data for January 2012-July 2020 confirms a co-integrating relationship, i.e., there exists a long-run co-movement between rural and urban inflation at the all-India level. Moreover, the significant error correction term [(-) 0.12] suggests that 12 per cent of the previous period’s deviation between actual and long-run inflation is corrected every month.
Long run-cointegration Equation Adj. R2 = 0.93; Engle-Granger tau-statistic and z-statistic confirms cointegration at 1 per cent level of significance. Error Correction Mechanism Adj. R2 = 0.78; LM test for the null hypothesis of no serial correlation up to 3 lags (p-value) =0.26. Note: Figures in parentheses denote p-values. References: Bhoi, Binod. et al. (2020) “Rural Urban Inflation Dynamics”, mimeo. | Core services inflation (with a weight of 23.0 per cent in CPI) rose from 4.4 per cent in February 2020 to 4.7 per cent in August 2020, led by prices of transportation and communications services as well as those of household services, the latter due to an increase in price of services provided by domestic servants, cooks and sweepers (Chart II.15b). Other Measures of Inflation Inflation measured by sectoral CPIs for agricultural labourers (CPI-AL) and rural labourers (CPI-RL) after hovering above the headline CPI inflation during 2019-20, with a sharp fall in food and fuel components, fell below CPI-Combined inflation during July and August 2020. Inflation in terms of CPI for industrial workers (CPI-IW) also fell below headline CPI inflation in March 2020 with a steep decline in food inflation. Thereafter, a further moderation in inflation in the food group, coupled with disinflation in the clothing group, kept CPI-IW inflation below headline CPI (Chart II.16a). 
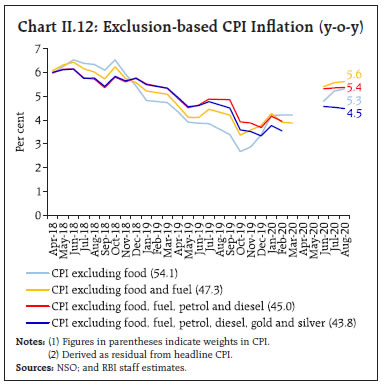
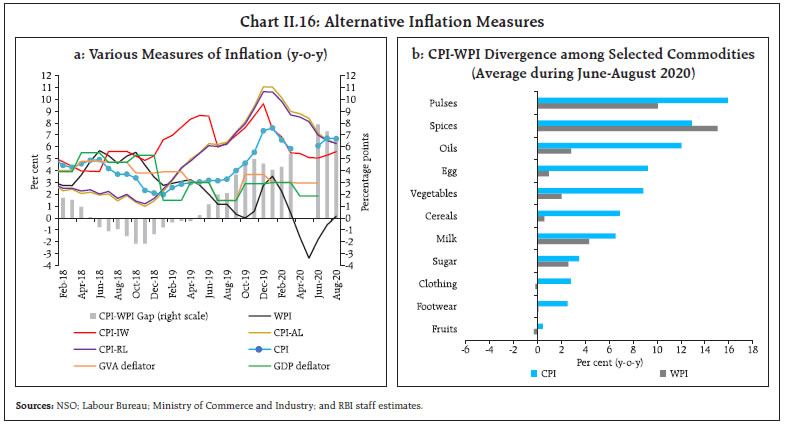 Inflation in terms of the wholesale price index (WPI) was on a different trail altogether. It sank into deflation in April, which persisted through till July, with non-food manufactured products in deflation for over a year. Fuel inflation moved into negative territory in March 2020 as a result of the large contraction in mineral oil inflation during March that persisted till August 2020. In August, WPI inflation turned marginally positive (0.2 per cent) due to a sharp uptick in inflation in non-food manufactured products. WPI food inflation remained above 4 per cent but exhibited lower inflationary pressures than in CPI across major sub-groups (Charts II.16b). The WPI measures basic prices less trade discounts, thereby leaving out indirect taxes by definition while retail prices are inclusive of taxes. Gross domestic product (GDP) and gross value added (GVA) deflators sank in Q1:2020-21 in line with the WPI. Trimmed means of inflation provide a measure of underlying inflation dynamics and are computed by statistically eliminating large positive and negative changes. Exclusion based measures of CPI also capture persistent trends in inflation by removing volatile components. Both trimmed means and exclusion-based measures have moved up – barring a slight reversal in August – suggesting generalised inflationary pressures (Charts II.12 and II.17). II.3 Costs The wholesale cost of farm inputs and industrial raw materials entered into deflationary territory in March and dipped to a 55-month low in May 2020, mirroring soft global oil and other commodity prices, and subdued demand (Chart II.18). There was a moderation in coal inflation, given low demand from end-user industries for steel and power, and contraction in international coal prices. Among other non-food items, deflation in prices of fibres intensified during April-August 2020 on account of subdued exports and domestic demand. Amongst farm sector inputs, inflation in the case of fodder prices moderated during June-August 2020, owing to the early onset and good distribution of monsoon. In the case of fertilisers and pesticides, inflation remained muted, reflecting deflation in international prices of phosphate, di-ammonium phosphate (DAP), triple superphosphate (TSP) and urea. Electricity prices have eased since April in view of weak demand conditions. Inflation in agricultural machinery and implements eased to 1.2 per cent during April-August 2020 due to subdued momentum in prices of tractors and agriculture implements.
Growth in nominal rural wages, both for agricultural and non-agricultural labourers, showed a sharp uptick in May 202013 (Chart II.19). Growth in staff costs in the organised sector decreased for listed firms in the manufacturing and services sectors during Q1:2020-21 over layoffs and salary cuts. However, unit labour costs (measured as a ratio of staff cost to value of production) increased during Q1:2020-21 due to contraction in the value of production14. Unit labour cost rose from 6.8 per cent in Q4:2019-20 to 10.2 per cent in Q1:2020-21 for firms in the manufacturing sector15 and from 29.2 per cent to 35.5 per cent for firms in the services sector16 (Chart II.20). Manufacturing firms polled in the Reserve Bank’s industrial outlook survey reported higher input cost pressures during Q2:2020-21 owing to supply shortages and transport delays (Chart II.21). Salary outgoes, which fell in Q1 as firms reported contraction in the level of employment, rose in Q2 and are expected to increase further in Q3. The cost of finance remained subdued. Reflecting cost pressures, selling prices edged up in Q2 and are expected to firm up further in Q4 and Q1:2021-22. Households’ inflation expectations, as polled in the September 2020 round of the Reserve Bank’s survey, remained elevated but eased modestly over the three-months ahead horizon. 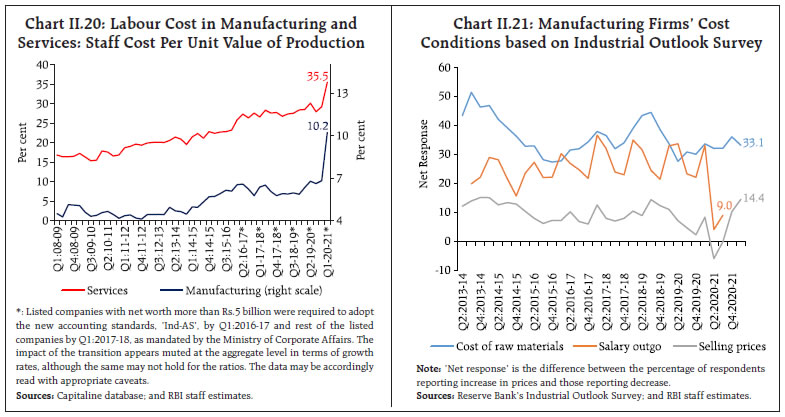 Manufacturing as well as services firms polled for the purchasing managers’ index (PMI) reported sharp declines in both input cost and selling prices during Q1:2020-21. In August-September 2020, input prices for the manufacturing firms registered an uptick as raw material costs, particularly for iron and steel, rose. Output prices, however, remained tepid and broadly stabilised in September after declining for five months in a row. For services firms, higher fuel and food prices pushed up input costs during Q2:2020-21, leading to a soft uptick in selling prices in August-September. II.4 Conclusion Inflationary pressures have firmed up in H1 on supply shocks and cost push pressures brought about by COVID-19. In this situation, proactive supply side management holds the key to containment of price pressures within broader supply side reforms. Timely and adequate release of cereal stocks including sales, meeting shortfalls in the availability of pulses through imports, rationalisation of the import duty structure for pulses and for edible oils for which around two-thirds of domestic demand is met by imports, steps to fully restore supply chains for poultry, goat and sheep, and adequate procurement and buffer stocks for stabilisation of vegetables prices, particularly key vegetables like onions and potatoes are the main elements of this approach. Furthermore, the high level of taxes on petroleum products needs to be revisited to ameliorate cost push pressures as the economy recovers. Effective supply side interventions and the presence of large favourable base effects are expected to bring about a moderation in inflation in H2:2020-21 but the uncertainties surrounding the COVID-19 trajectory pose substantial risks to the outlook. In absence of sufficient supply-side responses, the risk of cost push pressures translating to a generalised increase in inflation and its persistence is a serious threat to the evolving macroeconomic outlook.
_________________________________________________________
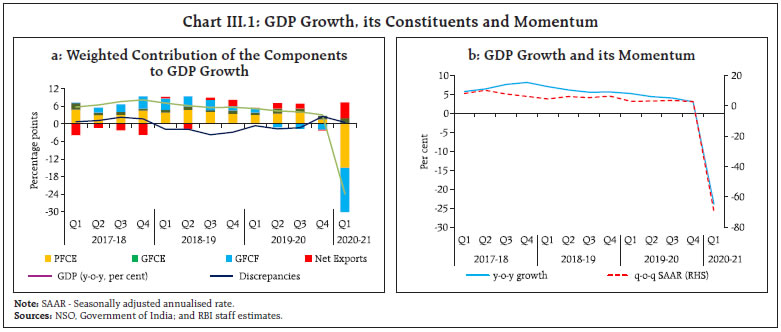
III. Demand and Output After an unprecedented decline in fixed investment, private consumption and exports in Q1:2020-21, aggregate demand recorded sequential improvement in Q2 on the back of robust rural demand and some uptick in urban consumption. On the supply side, the steep decline in manufacturing and plummeting construction activity in Q1 was followed by a gradual easing of contraction in Q2. In the period following the release of the April 2020 MPR, economic activity plunged into a contraction in Q1:2020-21 that is unparalleled in India’s history. The combined impact of demand compression and supply disruptions has produced an unprecedented decline in fixed investment, private consumption and exports. Government expenditure, including in the form of counter-pandemic measures, has cushioned the deterioration. Without it, the downturn would have been even deeper. On the supply side, the stringent nation-wide lockdown, social distancing norms and the mass exodus of migrant workers led to a steep decline in manufacturing and plummeting construction activity. Trade and transportation went down to a fraction of their pre-COVID-19 levels. Credit conditions also remained muted. The only silver lining was the resilience of agriculture and allied activities on the back of record production of rabi and horticulture crops in 2019-20. The bountiful and widespread southwest monsoon in the 2020 season and higher kharif sowing have brightened the outlook for rural consumption. With the gradual unlocking of the economy from May/June 2020, signs of stabilisation appeared but the resurgence of infections especially in the interior part of the country levelled them off in July. High frequency indicators exhibited signs of some recovery again in August, which strengthened in September 2020. III.1 Aggregate Demand The August 2020 data release of the National Statistical Office (NSO) revealed that aggregate demand measured in terms of year-on-year changes in real gross domestic product (GDP) underwent a contraction of 23.9 per cent in Q1:2020-21, taking GDP to its lowest in the history of the quarterly series (Table III.1 and Chart III.1a). As reflected in quarter-on-quarter (q-o-q) seasonally adjusted annualised rates (SAAR) of GDP, this was essentially a cliff effect embodied in a sudden and steep drop in momentum in that quarter (Chart III.1b). Moreover, excluding the support from government expenditure, real GDP would have slumped by 29.3 per cent. | Table III.1: Real GDP Growth | | (y-o-y, per cent) | | Item | 2018-19 | 2019-20 | Weighted Contribution* | 2018-19 (FRE) | 2019-20 (PE) | 2020-21 | | (FRE) | (PE) | 2018-19 | 2019-20 | Q1 | Q2 | Q3 | Q4 | Q1 | Q2 | Q3 | Q4 | Q1 | | 1. Private final consumption expenditure | 7.2 | 5.3 | 4.0 | 3.0 | 6.7 | 8.8 | 7.0 | 6.2 | 5.5 | 6.4 | 6.6 | 2.7 | -26.7 | | 2. Government final consumption expenditure | 10.1 | 11.8 | 1.0 | 1.2 | 8.5 | 10.8 | 7.0 | 14.4 | 6.2 | 14.2 | 13.4 | 13.6 | 16.4 | | 3. Gross fixed capital formation | 9.8 | -2.8 | 3.0 | -0.9 | 12.9 | 11.5 | 11.4 | 4.4 | 4.6 | -3.9 | -5.2 | -6.5 | -47.1 | | 4. Exports | 12.3 | -3.6 | 2.4 | -0.8 | 9.5 | 12.5 | 15.8 | 11.6 | 3.2 | -2.2 | -6.1 | -8.5 | -19.8 | | 5. Imports | 8.6 | -6.8 | 2.0 | -1.6 | 5.9 | 18.7 | 10.0 | 0.8 | 2.1 | -9.4 | -12.4 | -7.0 | -40.4 | | GDP at market prices | 6.1 | 4.2 | 6.1 | 4.2 | 7.1 | 6.2 | 5.6 | 5.7 | 5.2 | 4.4 | 4.1 | 3.1 | -23.9 | FRE: First Revised Estimates; PE: Provisional Estimates.
*: Component-wise contributions to growth do not add up to GDP growth in the table because change in stocks, valuables and discrepancies are not included.
Source: National Statistical Office (NSO). |
 In Q2, aggregate demand recorded sequential improvement on the back of robust rural demand and some uptick in urban consumption. Indicators of rural demand, viz., tractor sales, fertilisers production and non-durable consumer goods, have exhibited resilience. Amongst indicators of urban demand, passenger vehicles sales emerged out of contraction in August. The contraction in production of consumer durables is still high. We can not say that a revival has taken place, while domestic air passenger traffic trailed below pre-COVID levels. In Q2, investment remained subdued, as reflected in coincident indicators – steel consumption; cement production; and production and imports of capital goods. The record issuance of corporate bonds in H1:2020, however, suggests financing conditions remain congenial for enabling traction in investment appetite. Although government expenditure tapered off in August after robust growth in July, it strengthened in later part of September with additional support from supplementary demands of ₹1.67 lakh crore by the central government. Nowcasting – the prediction of the present or the very near future of the state of the economy – has become popular among central banks in the face of long lags and frequent revisions in official measures of economic activity. Historically, nowcasting techniques have been based on simplified heuristic approaches, but more recently, they rely on statistical approaches to produce predictions that eliminate the need for informal judgement. Nowcast models can exploit information from a large quantity of data series at different frequencies and with different publication lags to extract signals from noise on economic activity1. Methods based on social media content have also been developed to estimate hidden sentiment analysis on the 'mood' of a population. Regression-based approaches, mixed data sampling, Bayesian approaches and dynamic factor models are now being employed to improve the forecasting power of nowcasting models. In this context, a dynamic factor model using 27 monthly indicators grouped2 under industry, services, global and miscellaneous activities reveals that an index of economic activity (IEA) plunged to -6.3 in April and moderated to -2.4 in September 2020 after a sharp rebound in May and June with the reopening of the economy (Chart III.2a). Sub-indices for industry, services, global and miscellaneous activities show that the decline in industrial and services activity was synchronous and of equal magnitude in the wake of the lockdown. The recovery has been more rapid for industry, however, and slower for services, pointing to a two-speed recovery (Chart III.2b and c). Contact-intensive service sectors (retail trade; transport; hotels; restaurants; recreation) remain sluggish in the face of continuing health risks. In contrast, the global activity sub-index seems to have posted a stronger recovery, albeit with some tapering in July and August. GDP growth nowcast for Q2:2020-21 is obtained at -9.8 per cent on a year-on-year basis (Chart III.2d).3 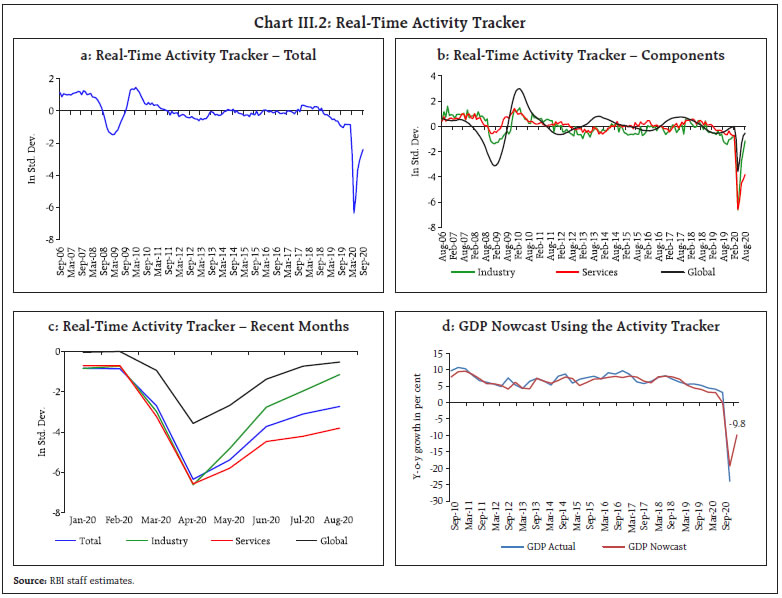 Nowcasting exercises offer rich scope of refinement to enhance predictive efficiency by augmenting existing models with spatial and real-time indicators on a daily basis that are becoming available, including through the application of machine learning tools, web scraping and artificial intelligence (Box III.1). Box III.1: Real-Time Economic Activity Index Indicators with monthly frequency such as electricity consumption, industrial activity, automobile sales, cargo handling and air passenger traffic are used to monitor economic activity in normal times. In a pandemic environment, however, monitoring economic activity in real time becomes critical to draw appropriate inferences for nimble-footed policy decisions. In this context, coincident indices (CIs) based on high frequency data have been employed by combining indicators over time and space (Federal Reserve Bank of Philadelphia4 and Federal Bank of New York5). In the Indian context, a CI is constructed with four indicators representing a mix of demand and supply dynamics and based on availability of data at daily frequency at the state level: (i) total vehicle registrations [Vahan dashboard of Ministry of Road Transport & Highways (MoRTH), Government of India]; (ii) electricity consumption (Power System Operation Corporation Limited); (iii) air quality index (Central Pollution Control Board); and iv) Google and Apple mobility data. Y-o-Y growth in these indicators, standardised with the year 2019 as base, reflect movements in consumer demand, activity in trade and transportation, commercial and industrial activity, agricultural and domestic energy demand, manufacturing activity and movements of the labour force. The choice of states for the construction of the CI is largely based on data availability. Accordingly, data from 14 states were used, accounting for 81 per cent of total national GVA. A dynamic factor model (DFM)6 is applied using the factor analyser module of Python. 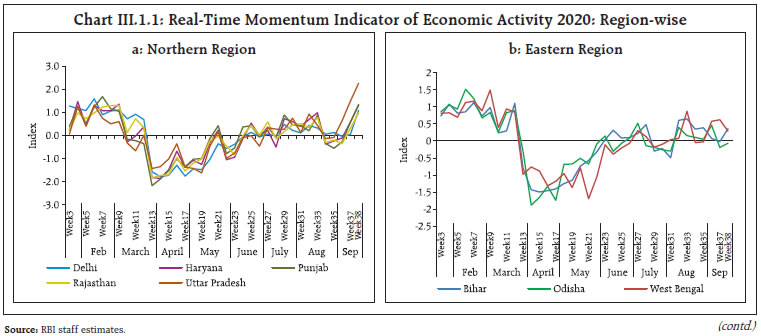
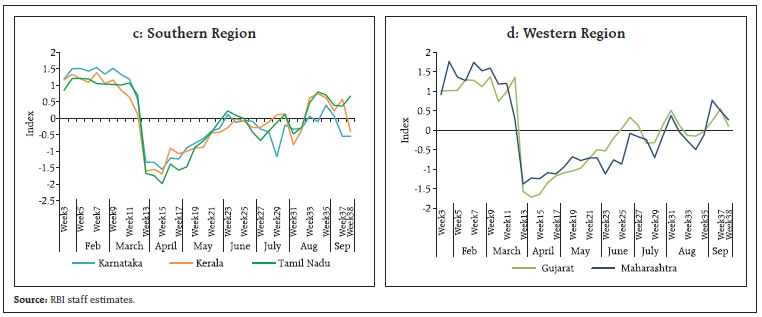 The CI shows that all regions experienced sharp fall in the cyclical component of economic activity in April before registering a slow recovery in the following months. The northern region registered positive momentum from mid-June but lost steam in the second half of August before gaining traction again in September. On the other hand, western and southern regions have experienced a fall in the momentum in the September after registering some signs of recovery. An All-India CI, constructed as a weighted average of state CIs by using the share of states in overall GVA as weights (Chart III.1.2), captures the collapse in activity in Q1 and a hesitant recovery in ensuing months with the gradual opening of the economy. References: Crone, T. (2004), “A Redefinition of Economic Regions in the U.S.”, Federal Reserve Bank of Philadelphia Working Paper No. 04-12. Osborne, J. W., Costello, A. B., & Kellow, J. T. (2008), ';Best Practices in Exploratory Factor Analysis';, In J. W. Osborne (Ed.), Best Practices in Quantitative Methods, Thousand Oaks, CA: Sage Publishing. Stock, J. H., & Watson, M. W. (1998, April), “Business Cycle Fluctuations in US Macroeconomic Time Series.”, NBER Working Paper 6528. | III.1.1 Private Final Consumption Expenditure (PFCE) Private consumption, with a share of around 55 per cent in GDP, is the mainstay of aggregate demand. The destruction of consumption demand by COVID-19 can be gauged from the sheer decline in nominal expenditure on private final consumption in Q1:2020-21– it fell by a third to ₹21.7 lakh crore from its pre-COVID level of ₹32.5 lakh crore recorded in Q3:2019-20 ahead of the onset of the coronavirus in the world. In Q2:2020-21, there were signs of recovery in private consumption in terms of high frequency indicators, but it is far from gaining full and broad-based traction in the face of rising infections as lockdowns are hesitantly eased. 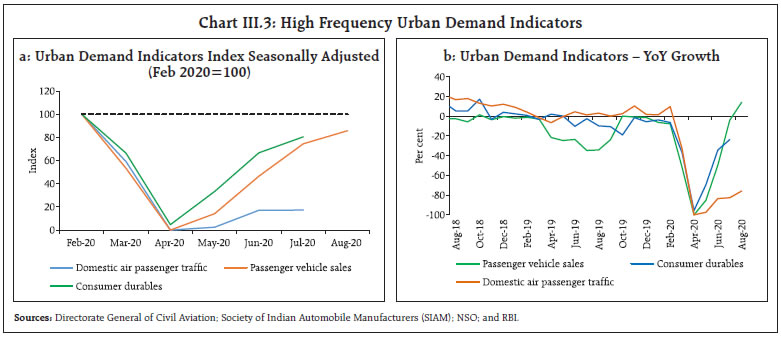 Drilling down into underlying dynamics of PFCE, it is found that though the retrenchment occurred across constituents, the contraction in private consumption seems to have been more pronounced in urban areas. Illustratively, domestic air passenger traffic and production of consumer durables remained dormant during the entire period of the lockdown (Chart III.3a & b). Turning to Q2, the recovery in this segment that became evident in May 2020 has been tepid. Although passenger vehicles sales and production of consumer durables have shown a better revival relative to domestic air passenger traffic in July and August, they still trail below pre-COVID levels. The subdued movements in household credit in the form of credit card outstanding, vehicle loans and other personal loans corroborates the muted state of urban consumption (Chart III.4). Indicators of rural demand reveal a relatively better picture. The production of consumer non-durables and sales of tractors, for instance, exhibited robust growth from June onwards (Chart III.5a and b). Rainfall in the current monsoon season has been 9 per cent above the long period average (LPA) (till September 30), which should augur well for the prospects of rural income and demand. This is also reflected in accelerated growth in fertilisers production and progress of kharif sowing. The increasing spread of COVID-19 infections into smaller towns and rural areas, however, imparts some uncertainty to the outlook, with implications for public health infrastructure in these areas. A priority, therefore, is to build on the government’s relief package and offset reduction in remittance flows to rural households post the exodus of migrant workers by actions that restore jobs and livelihood.
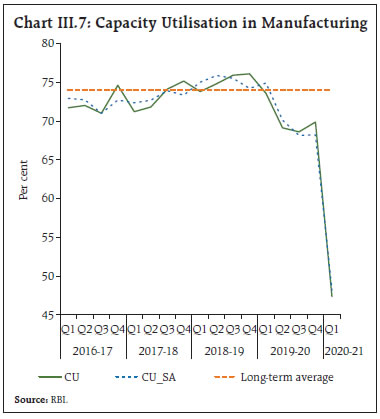
III.1.2 Gross Fixed Capital Formation (GFCF) Investment, which was already in contraction mode since Q2:2019-20, suffered a massive knock-on effect from the pandemic. Fixed investment shrank by 47.1 per cent in Q1:2020-21, taking its share in aggregate demand down to 22.3 per cent from 32 per cent year ago. In Q2, the investment climate remained subdued. Still muted consumption demand and excess capacity are holding back new investments, despite easing of financial conditions. Investment in dwellings, other buildings and structures, dropped precipitously under the weight of a confluence of factors working in tandem, viz., large inventory overhang in housing, tapering of incomes and hence, EMI-servicing capacity, and high stress in the balance sheets of non-banking finance companies (NBFCs) and housing finance companies (HFCs). This is also reflected in proximate coincident indicators – steel consumption; cement production; and production and imports of capital goods (Chart III.6). As per the order books, inventories and capacity utilisation survey (OBICUS) of the Reserve Bank, capacity utilisation (CU) in the manufacturing sector declined sharply to 48.2 per cent in Q1:2020-21 from 68.2 per cent in the previous quarter on a seasonally adjusted basis (Chart III.7). Manufacturing firms responding to the Reserve Bank’s industrial outlook survey expect domestic demand to recover gradually from Q2:2020-21 and to sustain through Q1:2021-22. 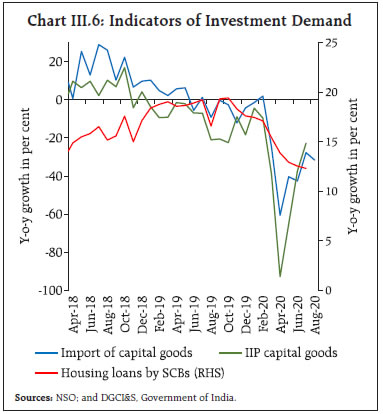
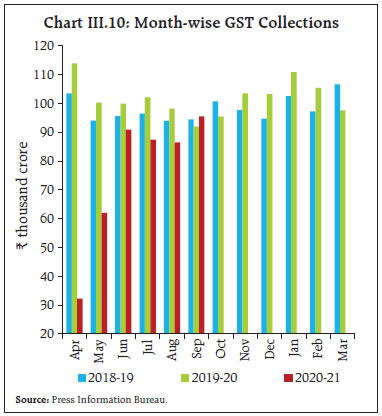
 Meanwhile, a favourable configuration is forming to support a revival in investment appetite. Domestic financial conditions have eased substantially, with systemic liquidity in large surplus and a significant narrowing of spreads on all financial instruments, irrespective of ratings, spurring a record issuance of corporate bonds in H1:2020 relative to a year ago. Even though bank lending remains lacklustre, especially to large, medium and small industries, the mandated linking of interest rates on new floating rate loans to external benchmarks for select sectors has improved transmission of changes in policy rates to banks’ lending rates (Chapter IV). Among the emerging risks, a decrease in the interest coverage ratio, indicating falling debt servicing capacity, could weigh on investment going forward (Chart III.8). III.1.3 Government Final Consumption Expenditure (GFCE) In recent years, government expenditure has counter-cyclically supported aggregate demand as evident in a growth of 16.4 per cent in government final consumption expenditure (GFCE) in Q1:2020-21. In Q2, the overall fiscal stimulus of around 10 per cent of GDP to support vulnerable sections of the population continues to play out, providing direct and indirect fiscal support to the economy. Furthermore, speedier implementation of the National Infrastructure Pipeline (NIP), which involves an investment of around ₹111 lakh crore by 2025 in various projects with participation of central government, state governments and the private sector, could boost overall investment spending (Chart III.9). Government finances have come under stress due to a sharp fall in revenues. The central government’s gross fiscal deficit (GFD) and revenue deficit (RD) stood at 109.3 and 121.9 per cent of BE, respectively, during April-August 2020-21 (Table III.2). This has led to some expenditure reprioritization. Accordingly, expenditure rationalisation measures have been stipulated for the ministries during Q1-Q3 to curb avoidable outgoes. The central government, however, sought parliament’s nod for net additional spending of ₹1.67 lakh crore in 2020-21. On the other hand, states’ expenditure has not shown any significant pick-up so far remaining broadly in line with budget estimates. This could be attributed to the curtailment of some revenue expenditure by various state governments [e.g., dearness allowances (DA) freeze; deferment of part of full salary and wages; deduction of salary]. Going ahead, the contribution of government expenditure could taper as revenue shortfalls stretch the finances of both the central government and state governments. 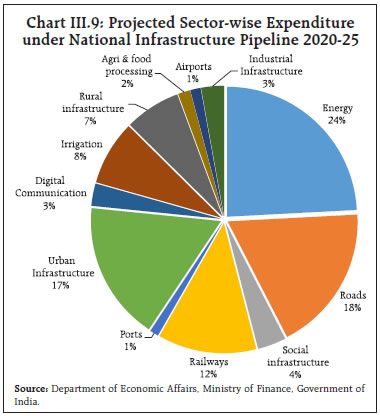 The central government’s revenue receipts were impacted during April-August 2020 by large declines in both direct and indirect tax collections (Table III.3) in all categories except union excise duties which were supported by increases in taxes on petroleum products. The decline in customs duty collections mirrored the ongoing contraction in imports. Total GST collections were severely hit by the lockdown during April-May 2020 but recovered partly during June-September 2020 (Chart III.10). In September GST collections were recorded at ₹ 95 thousand crore. During April-August 2020, the central government’s revenue expenditure received a boost from increased agricultural, rural, and defence spending, while there were lower outgoes on major subsidies (food, fuel and fertilizers). Capital expenditure registered a contraction of 1.3 per cent in this period (Chart III.11). Over 75 per cent of the capital expenditure was incurred by the ministries of defence, railways, and road transport and highways. With the continuing decline in private investment, a step-up in government capital expenditure could perform the twin roles of gap-fill and potential crowding-in. | Table III.2: Budgetary Position of the Central Government during April-August 2020-21 | | Item | (₹ thousand crore) | (Per cent) | | Budget Estimates | Actuals | Percent to BE | Growth Rate | | 2019-20 | 2020-21 | Apr-Aug | Apr-Aug | Apr-Aug | Apr-Aug | Apr-Aug | Apr-Aug | | 2019 | 2020 | 2019 | 2020 | 2019 | 2020 | | 1. Revenue Receipts | 1,963 | 2,021 | 603 | 371 | 30.7 | 18.3 | 29.8 | -38.6 | | 2. Tax Revenue (Net) | 1,650 | 1,636 | 405 | 284 | 24.5 | 17.4 | 10.5 | -29.7 | | 3. Non-Tax Revenue | 313 | 385 | 199 | 86 | 63.4 | 22.4 | 102.0 | -56.6 | | 4. Non-Debt Capital Receipts | 120 | 225 | 18 | 7 | 15.2 | 3.0 | 21.6 | -63.5 | | 5. Total Receipts (1+4) | 2,083 | 2,246 | 621 | 377 | 29.8 | 16.8 | 29.6 | -39.3 | | 6. Total Expenditure (7+8) | 2,786 | 3,042 | 1,175 | 1,248 | 42.2 | 41.0 | 9.8 | 6.2 | | 7. Revenue Expenditure | 2,448 | 2,630 | 1,039 | 1,113 | 42.5 | 42.3 | 10.7 | 7.1 | | 8. Capital Expenditure | 339 | 412 | 136 | 134 | 40.2 | 32.6 | 3.0 | -1.3 | | 9. Revenue Deficit (7-1) | 485 | 609 | 436 | 743 | 89.9 | 121.9 | -8.1 | 70.3 | | 10. Fiscal Deficit (6-5) | 704 | 796 | 554 | 870 | 78.7 | 109.3 | -6.3 | 57.1 | | 11. Gross Primary Deficit | 43 | 88 | 335 | 633 | 773.4 | 717.9 | -10.0 | 89.0 | | Source: Controller General of Accounts. |
| Table III.3: Central Government’s Tax Collection | | Item | ₹ thousand crore | Per cent | | Budget Estimates | Actuals | Percent to BE | Growth Rate | | 2019-20 | 2020-21 | Apr-Aug 2019 | Apr-Aug 2020 | Apr-Aug 2019 | Apr-Aug 2020 | Apr-Aug 2019 | Apr-Aug 2020 | | A. Direct Taxes | 1,335 | 1,319 | 281 | 187 | 21.0 | 14.2 | 9.4 | -33.3 | | Of which | | | | | | | | | | 1. Corporation Tax | 766 | 681 | 111 | 65 | 14.5 | 9.5 | 4.6 | -41.8 | | 2. Income Tax | 556 | 625 | 166 | 118 | 29.8 | 18.8 | 13.2 | -28.9 | | B. Indirect Taxes | 1,126 | 1,104 | 380 | 316 | 33.7 | 28.6 | 0.7 | -16.8 | | Of which | | | | | | | | | | 1. Total GST | 666 | 694 | 240 | 182 | 36.0 | 26.3 | 1.0 | -23.9 | | 2. Custom Duties | 156 | 138 | 62 | 32 | 39.8 | 23.4 | 16.5 | -47.9 | | 3. Union Excise Duties | 300 | 267 | 76 | 100 | 25.3 | 37.6 | -6.6 | 32.0 | | C. Gross Tax Revenue | 2,461 | 2,423 | 661 | 504 | 26.8 | 20.8 | 4.2 | -23.7 | | D. Assignment to States/UTs | 809 | 784 | 256 | 218 | 31.6 | 27.8 | -4.4 | -14.7 | | E. Net Tax Revenue | 1,650 | 1,636 | 405 | 284 | 24.5 | 17.4 | 10.5 | -29.7 | | Source: Union Budget Documents and Controller General of Accounts. |
 Several states had presented their budgets before the onset of the pandemic, which implies substantial revisions as the year progresses. States’ own tax revenue as well as central transfers have been adversely impacted, while pandemic-related expenditure has been heavy. In this context, the additional borrowings limits for states of up to 2 per cent of gross state domestic product (GSDP) or ₹4.28 lakh crore, partly linked to specific reforms7, can expand their total borrowing during 2020-21. Most states may be able to meet the first two specified reforms (viz., one-nation-one-ration-card and ease of doing business), which would allow them to borrow up to 4.0 per cent of GDP, on an average. The central government is also working out modalities to compensate states with respect to the expected shortfall of compensation cess during 2020-21. 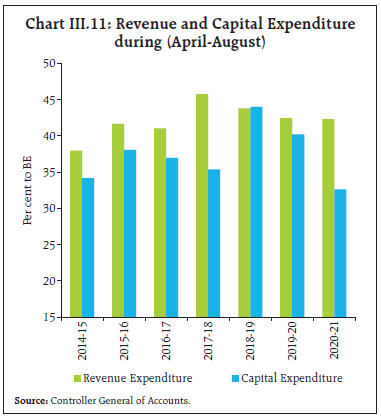 Given the stress on state finances, the Reserve Bank increased ways and means advances (WMA) limits by 60 per cent over and above the level as on March 31, 2020, which has been extended for a further period of 6 months till March 31, 2021. Rules governing withdrawals from the Consolidated Sinking Fund (CSF) scheme were relaxed to enable them to meet a larger proportion of their redemptions from the CSF. Given the fact that capital expenditure by states accounts for two-thirds of total capital expenditure of general government, it is imperative not to cut down capital expenditure in the coming quarters if the revival in overall economic activity has to be supported (Chart III.12 a and b). The limit for WMA for the centre for the first half of 2020-21 was revised upward to ₹2 lakh crore from ₹1.2 lakh crore. Furthermore, Center's WMA limit for H2:2020-21 has been kept higher at ₹1.25 lakh crore vis-a-vis ₹35,000 crore in the same period of last year. Moreover, limits for foreign portfolio investment in government securities have been expanded and a fully accessible route has been introduced for investment by non-residents in government securities without any limit. As at end-September, ₹7.66 Lakh crore or 63.8 per cent of the revised gross market borrowings of the central government for the full year 2020-21 has been completed (Table III.4). The central government’s market borrowing calender for H2 has planned gross issuances of ₹4.34 Lakh crore, sticking to the revised estimate of ₹12 Lakh crore for the full fiscal year. States completed gross market borrowings of ₹3,53,596 crore during the year (up to September 30), comprising 115.8 per cent of the calendar for H1:2020-21. 
| Table III.4: Government Market Borrowings | | (₹ crore) | | Item | 2018-19 | 2019-20 | 2020-21 (up to Sep 30, 2020) | | Centre | States | Total | Centre | States | Total | Centre | States | Total | | Net borrowings | 4,22,737 | 3,48,643 | 7,71,380 | 4,73,972 | 4,87,454 | 9,61,426 | 6,35,428 | 2,98,989 | 9,34,417 | | Gross borrowings | 5,71,000 | 4,78,323 | 10,49,323 | 7,10,000 | 6,34,521 | 13,44,521 | 7,66,000 | 3,53,596 | 11,19,596 | | Sources: Government of India; and RBI staff estimates. | III.1.4 External Demand In spite of the deterioration of external demand, net exports contributed positively to aggregate demand in Q1:2020-21, as imports contracted faster than exports (Chart III.13). India’s exports marked a turnaround and entered positive territory in September after six months of contraction, while imports declined for the seventh consecutive month (Chart III.13a). In Q2, India’s exports were US$ 73.7 billion and imports were US$ 88.3 billion. Despite limited participation, India’s merchandise exports were impacted by the massive disruption in global value chains (GVCs) inflicted by COVID-19. Disaggregated data available for July-August 2020 suggests that among non-oil exports, the decline was pronounced in respect of gems and jewellery, engineering goods, readymade garments and electronic goods (Chart III.14a). On the other hand, exports of drugs and pharmaceuticals, iron ore and rice recorded robust growth due to increased demand even during the pandemic, underlying their innate resilience. The decline in imports was broad-based. During July-August, 25 out of 31 major commodity groups, which accounted for 81 per cent of the import basket, witnessed contraction (Chart III.14b). A steep reduction in crude oil prices and lower domestic demand for petroleum products led to a decline in POL imports, while gold imports plunged with a slump in domestic demand and high gold prices, although a revival of investment demand for gold rekindled imports in August 2020. The decline in non-POL non-gold imports in July-August 2020 was primarily contributed by electronic goods, pearls, precious and semi-precious stones, machinery and coal, coke and briquettes. 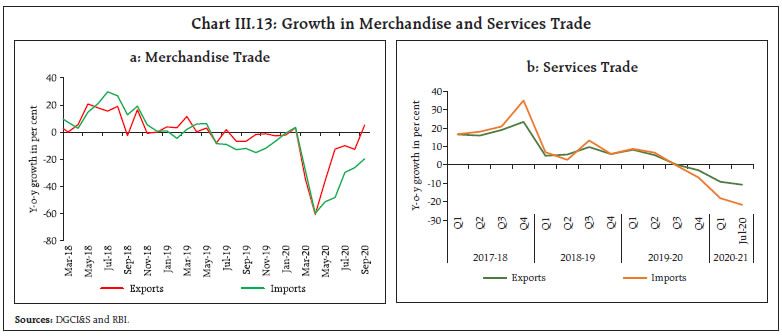
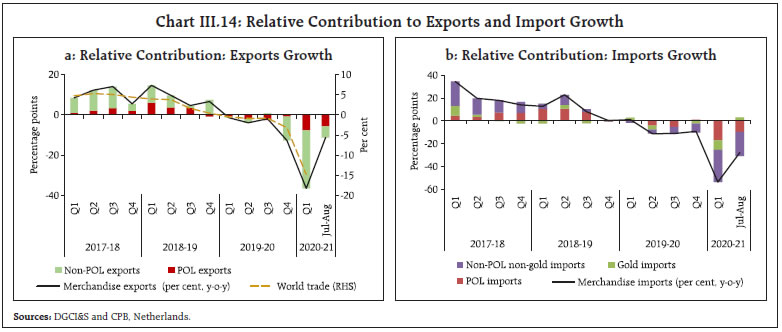 The merchandise trade deficit had narrowed substantially to US$ 9.0 billion in Q1:2020-21 from US$ 49.2 billion a year ago with the first trade surplus of US$ 0.8 billion after a gap of over eighteen years in June 2020. The trade balance, however, turned into deficit in Q2 (US$ 14.5 billion). The current account balance, which had recorded a marginal surplus of US$ 0.6 billion (0.1 per cent of GDP) in Q4:2019-20 after a gap of twelve years, posted a record surplus of US$ 19.8 billion (3.9 per cent of GDP) in Q1:2020-21. Invisible receipts moderated marginally in Q1:2020-21, mainly due to a decline in inward remittances on account of the global recession, decline in crude oil prices and loss of employment opportunities overseas. Notwithstanding the sharp decline in travel receipts due to restrictions on tourist arrivals and a few other categories of services, net services receipts remained relatively stable due to steady software earnings, which accounted for 48 per cent of total services receipts in Q1:2020-21. Despite a fall in the overall global IT spending, software exports may remain relatively resilient with companies focusing on digital workplace support, adoption of cloud services and infrastructure modernisation in the face of pandemic challenges. Net outgo on account of investment and other income increased in Q1:2020-21, with an uptick in dividend payments on foreign equity and investment funds in India. In the financial account, portfolio flows made a gradual rebound with the renewal of risk-on sentiment. Net FPI inflows stood at US$ 8.3 billion in 2020-21 (up to October 6) as compared with US$ 2.8 billion a year ago. While the equity segment recorded inflows of US$ 11.1 billion as against outflows of US$ 0.6 billion a year ago, in the debt segment (general route), there were outflows of US$ 4.2 billion as against inflows of US$ 3.4 billion a year ago. Under the voluntary retention route (VRR), there were net inflows of US$ 1.4 billion during the same period. Net FDI flows moderated in April-July 2020 on the back of higher repatriation relative to fresh equity investments. Net ECBs to India recorded an outflow of US$ 8.5 billion in April-August 2020 due to slowdown in fresh disbursals and higher repayments, while net flows under NRI deposits were higher than a year ago. As on October 02, 2020, India’s foreign exchange reserves stood at US$ 545.6 billion, equivalent to 15.9 months of imports, reflecting an increase of US$ 67.8 billion over the level at end-March 2020. | Table III.5: Sector-wise Growth in GVA | | (y-o-y, per cent) | | Sector | 2018-19 (FRE) | 2019-20
(PE) | Weighted Contribution 2019-20 | 2018-19 (FRE) | 2019-20 (PE) | 2020-21 | | Q1 | Q2 | Q3 | Q4 | Q1 | Q2 | Q3 | Q4 | Q1 | | Agriculture, forestry and fishing | 2.4 | 4.0 | 0.6 | 3.8 | 2.5 | 2.0 | 1.6 | 3.0 | 3.5 | 3.6 | 5.9 | 3.4 | | Industry | 4.5 | 0.8 | 0.2 | 7.8 | 4.7 | 4.4 | 1.4 | 3.8 | -0.2 | -0.4 | 0.0 | -33.8 | | Mining and quarrying | -5.8 | 3.1 | 0.1 | -7.3 | -7.0 | -4.4 | -4.8 | 4.7 | -1.1 | 2.2 | 5.2 | -23.3 | | Manufacturing | 5.7 | 0.0 | 0.0 | 10.7 | 5.6 | 5.2 | 2.1 | 3.0 | -0.6 | -0.8 | -1.4 | -39.3 | | Electricity, gas, water supply and other utilities | 8.2 | 4.1 | 0.1 | 7.9 | 9.9 | 9.5 | 5.5 | 8.8 | 3.9 | -0.7 | 4.5 | -7.0 | | Services | 7.5 | 5.0 | 3.1 | 7.3 | 7.2 | 7.3 | 8.3 | 5.5 | 6.1 | 4.9 | 3.5 | -24.3 | | Construction | 6.1 | 1.3 | 0.1 | 6.4 | 5.2 | 6.6 | 6.0 | 5.2 | 2.6 | 0.0 | -2.2 | -50.3 | | Trade, hotels, transport, communication | 7.7 | 3.6 | 0.7 | 8.5 | 7.8 | 7.8 | 6.9 | 3.5 | 4.1 | 4.3 | 2.6 | -47.0 | | Financial, real estate and professional services | 6.8 | 4.6 | 1.0 | 6.0 | 6.5 | 6.5 | 8.7 | 6.0 | 6.0 | 3.3 | 2.4 | -5.3 | | Public administration, defence and other services | 9.4 | 10.0 | 1.3 | 8.8 | 8.9 | 8.1 | 11.6 | 7.7 | 10.9 | 10.9 | 10.1 | -10.3 | | GVA at Basic Prices | 6.0 | 3.9 | 3.9 | 6.9 | 6.1 | 5.6 | 5.6 | 4.8 | 4.3 | 3.5 | 3.0 | -22.8 | FRE: First Revised Estimates; PE: Provisional Estimates.
Source: NSO. | III.2 Aggregate Supply Gross value added (GVA) at basic prices which contracted in Q1:2020-21 (Table III.5) on a steep downswing in industrial and services sectors, appears to have stabilised. in Q2. The first advance estimates of production of major kharif crops for 2020-21 placed foodgrains production 0.8 per cent higher than last year’s level. Coincident indicators of industry and some indicators of services also suggest that the pace of contraction is moderating in Q2. III.2.1 Agriculture Value added in agriculture and allied activities improved on the back of higher production of foodgrains and oilseeds. The fourth advance estimates for 2019-20 released in August 2020 placed foodgrains production at 2,966.5 lakh tonnes – 4.0 per cent higher than in the previous year – driven by the rabi output (Table III.6). While rice and wheat achieved record production levels for the fourth consecutive year, coarse cereals and oilseeds notched a record production level. Horticulture crops achieved production of 3,195.7 lakh tonnes in 2019-20 (growth of 2.7 per cent), driven by productivity growth (0.8 per cent) and increased area under cultivation of vegetables (2.4 per cent) and fruits (1.6 per cent) (Table III.6). | Table III.6: Agriculture Production | | Item | Lakh tonnes | Growth (%) | | 2018-19 | 2019-20 | 2019-20 over final estimate 2018-19 | | I. Total foodgrains | 2,852.1 | 2,966.5 | 4.0 | | Rice | 1,164.8 | 1,184.3 | 1.7 | | Wheat | 1,036.0 | 1,075.9 | 3.9 | | Coarse cereals | 430.6 | 474.8 | 10.3 | | Pulses | 220.8 | 231.5 | 4.8 | | II. Commercial crops | | | | | Sugarcane | 4,054.2 | 3,557.0 | -12.3 | | Cotton | 280.4 | 354.9 | 26.6 | | Oilseeds | 315.2 | 334.2 | 6.0 | | III. Total Horticulture Crops | 3,110.5 | 3,195.7 | 2.7 | | III.1 Total Fruits | 979.7 | 1004.5 | 2.5 | | Banana | 304.6 | 317.8 | 4.3 | | Citrus | 134.0 | 140.3 | 4.7 | | Mango | 213.8 | 205.3 | -4.0 | | III.2 Total Vegetables | 1,831.7 | 1,894.6 | 3.4 | | Onion | 228.2 | 261.5 | 14.6 | | Potato | 501.9 | 486.6 | -3.0 | | Tomato | 190.1 | 212.0 | 11.5 | | III.3 Plantation Crops | 165.9 | 160.3 | -3.4 | | III.4 Total Spices | 95.0 | 97.5 | 2.7 | | III.5 Flowers and Aromatics | 29.1 | 29.9 | 2.9 | | Source: Ministry of Agriculture and Farmers’ Welfare, Government of India. | The stock of cereals at the end of October 1, 2020 was 2.2 times the buffer norms for Q3:2020-21. Minimum support prices (MSPs) announced for various crops for the both kharif and rabi season were higher in the range of 2.1 per cent to 12.7 per cent than in the previous year and assured a return of at least 50 per cent over the cost of production (as measured by A2 plus FL) across all crops. The 2020 southwest monsoon arrived on time and made rapid progress, covering the entire country by June 26, 2020, i.e., 12 days prior to the normal date. Notwithstanding a loss of momentum in the month of July, the monsoon revived subsequently, and the cumulative southwest monsoon rainfall stood at 9 per cent above the long period average (LPA) as on September 30, 2020 (Chart III.15a). As regards the spatial distribution, while 85 per cent of the sub-divisions received normal and above normal rainfall, the cumulative rainfall in North-West India remained 16 per cent below LPA (Chart III.15b). As on October 1, 2020, the live storage in major reservoirs was 87 per cent of the full reservoir level (FRL), marginally lower than previous year's level (88 per cent) but higher than decadal average of of 76 per cent (Chart III.15c). Spurred by the progress of precipitation, kharif sowing also started on higher note in the month of June. Standing at 4.6 per cent higher than the full season normal area, the overall kharif acreage has set a new record as on September 25, 2020 (Chart III.15d). Accounting for 48.9 per cent of the overall kharif acreage, rice and pulses sowing were higher by 5.6 per cent and 4.1 per cent, respectively, over the previous year’s level which augurs well for foodgrains availability. The first advance estimates of production of major kharif crops for 2020-21 placed foodgrains production at 1,445.2 lakh tonnes, 0.8 per cent higher than last year’s level. Production of total kharif pulses and oil seeds is estimated to be substantially higher than in the previous year (Chart III.16). 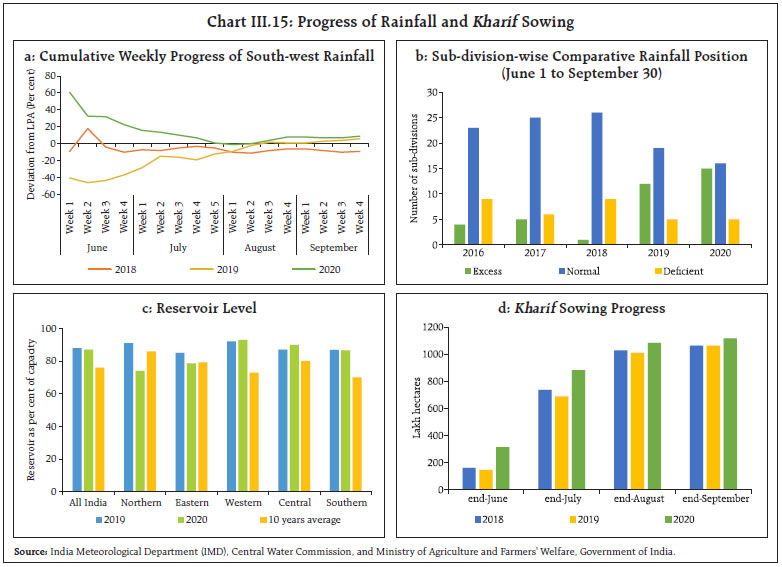
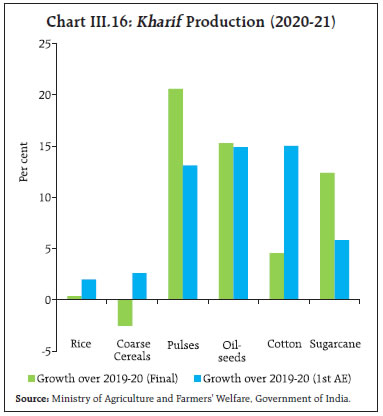 High frequency indicators relating to the farm sector also reflect a strong momentum. After a dip in April, tractor sales improved sharply in the subsequent months (Table III.7). Farm exports recorded a turnaround from June after experiencing contraction in the three preceding months. The demand for jobs under the Mahatma Gandhi National Rural Employment Guarantee scheme (MGNREGA) has surged, with a y-o-y growth of 74.2 per cent in June, although increased employment opportunities during the kharif sowing season and reverse migration to cities is also underway. Under the Atmanirbhar Bharat Abhiyan Package, the government has announced measures to strengthen infrastructure logistics, capacity building, governance and administrative reforms for agriculture, animal husbandry, fisheries and food processing. These measures include 8 development schemes8 with fund allocation of ₹1.6 lakh crore. In addition, the government has also legislated three important governance and administrative reforms to attract private investments to the agriculture sector and make it competitive, viz., amendment of the Essential Commodities Act, and promulgation of the Farming Produce Trade and Commerce (Promotion and Facilitation) bill and Farmers (Empowerment and Protection) Agreement on Price Assurance and Farm Services bill. These measures represent long awaited reforms in the agriculture sector, and much hinges around successful implementation. | Table III.7: High Frequency Indicators for Rural Economy | | (Per cent) | | Items | Growth | Jan-20 | Feb-20 | Mar-20 | Apr-20 | May-20 | Jun-20 | Jul-20 | Aug-20 | Sep-20 | | Tractor sales | y-o-y | 4.8 | 21.3 | -49.9 | -79.4 | 4.0 | 22.4 | 38.5 | 74.7 | | | Two wheeler sales | y-o-y | -16.1 | -19.8 | -39.8 | 0.0 | -83.8 | -38.6 | -15.2 | 3.0 | | | Fertliliser Sales | y-o-y | 48.2 | 13.8 | -15.1 | 47.5 | 22.2 | 10.9 | 25.4 | 8.1 | | | Demand for employment (MGNREGA) | m-o-m | 10.8 | 17.9 | -6.6 | -35.6 | 178.6 | 20.0 | -28.6 | -24.0 | 0.3 | | | y-o-y | -11.2 | 4.8 | 2.5 | -37.2 | 48.9 | 74.2 | 73.6 | 66.6 | 71.1 | | Export - agri and allied sector | y-o-y | -5.5 | 1.4 | -23.7 | -26.4 | -0.1 | 22.0 | 24.4 | 19.1 | | | Agriculture credit (Outstanding) | y-o-y | 6.5 | 5.8 | 4.2 | 3.9 | 3.5 | 2.4 | 5.4 | | | | Stocks-cereals (ratio of actual stocks to quarterly buffer norms) | Rice | 5.4 | 6.6 | 6.5 | 3.3 | 3.1 | 2.9 | 2.8 | 2.2 | 2.4 | | Wheat | 2.2 | 2.0 | 1.8 | 4.8 | 7.5 | 7.4 | 2.0 | 1.7 | 2.1 | III.2.2 Industry Massive supply side disruptions due to COVID-19 and the ensuing lockdown resulted in industrial GVA contracting by 33.8 per cent during Q1:2020-21. (Chart III.18a). The fall was widespread across manufacturing and mining and quarrying activity (Chart III.17). The index of industrial production (IIP) shrank by an unprecedented 35.5 per cent during Q1:2020-21. The extent of contraction in IIP, however, moderated in July, cushioned by electricity generation and this was also reflected in exclusion-based measures (Chart III.18b). On the other hand, the momentum gained in May, weakened in June and July due to re-imposition of lockdowns by some states (Chart III.18c). In terms of the use-based classification, the contraction in Q1:2020-21 was dispersed across all categories (Chart III.18d).
Consumer non-durables production, however, exhibited resilience and registered growth in June-July on the back of increase in the output of essential goods. Consumer durables fell substantially, with auto components, two wheelers, passenger cars, jewellery and textiles contributing the most to the decline. Capital goods, already on a declining trajectory since January 2019, plunged further during Q1:2020-21 and recorded moderation in contraction in July 2020, with commercial vehicles contributing highest to the decline. A silver lining, however, was provided by agricultural machinery, tractors, and solar power, which recorded positive growth. Electricity generation also contracted during Q1:2020-21 due to shrinking demand, although the pace moderated considerably in May and June. Some signs of recovery became evident in July-August 2020 as demand improved with the easing of the lockdown. Hydro-electricity generation registered double-digit growth in July but contraction in August. while thermal power production remained in contraction during July-August 2020 (Chart III.19).
The contraction in manufacturing GVA in Q1:2020-21 was mirrored in sales of manufacturing companies (Chart III.20). Profit before taxes of manufacturing firms also dropped substantially (Chart III.21). Only IT companies maintained sales growth although at a decelerating pace. 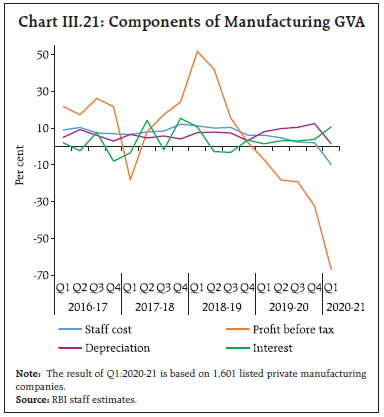
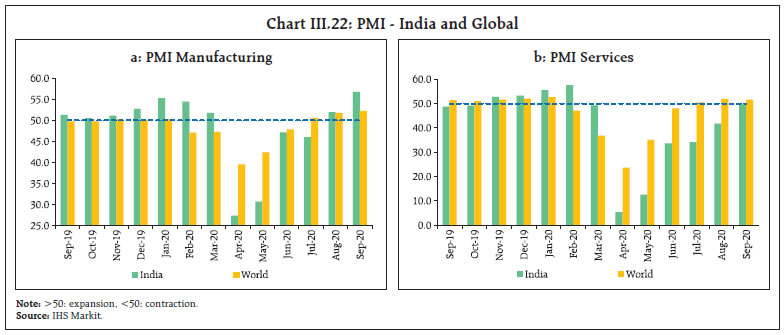 As regards the overall business environment, the Reserve Bank’s business assessment index moved to 96.2 in Q2 (the 91st round of the industrial outlook survey) from 55.3 – the lowest in the series starting March 2000 after large deterioration in demand conditions but it remained in contraction zone. The business expectations index (BEI) also improved to 111.4 for Q4:2020-21 from 99.5 for Q3:2020-21. The manufacturing purchasing managers’ index (PMI) reached 56.8 in September, the highest reading since January 2012, supported by accelerated increases in new orders and production (Chart III.22a). Almost one-third of manufacturers expect output growth in the coming 12 months, as against 8 per cent that foresee a contraction, resulting in the strongest degree of overall optimism. III.2.3 Services In Q1:2020-21, COVID-19 brought major services activities to a near halt and the sector contracted in a broad-based manner by 24.3 per cent as against a growth of 5.5 per cent a year ago. Construction recorded the steepest decline (by 50.3 per cent), followed by trade, hotels, transport, communication and services related to broadcasting (Chart III.23a). Indicators of construction activity – finished steel consumption and cement production – bottomed out in April 2020, the month of complete shutdown, and recovered in the following months, albeit still in contraction on a year-on-year basis (Chart III.23b). Commercial vehicle sales – a lead indicator of transportation services – contracted by 84.8 per cent in Q1:2020-21. Vehicle registrations for July and August, however, showed signs of sequential improvement. Other indicators of transport segment –rail freight traffic, cargo handled by major ports and air cargo – registered sequential recoveries. Rail freight posted growth for the second consecutive month in September (Table III.8). Air passenger traffic, both domestic and international, came to an abrupt halt during April-May owing to restrictions on travel and posted sluggish growth thereafter. The services PMI sequentially improved to 49.8 in September 2020, albeit remained in contraction zone reflecting subdued domestic and tepid external demand (Chart III.22b). The rural sector showed resilience, with robust sales of tractors – a key agricultural machinery investment –during May-August. 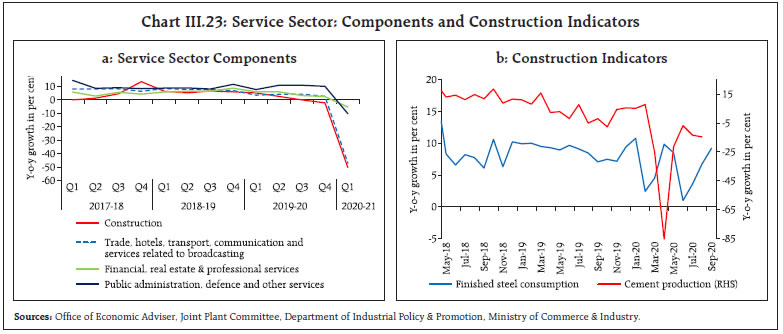 In Q1:2020-21, decline in private education, health, entertainment and recreation activity led to fall in public administration, defence and other (PADO) services. Growth in revenue expenditure, excluding interest payments and subsidies of central government, was robust in Q1:2020-21 and upto July before it tapered off in August. Supplementary demands of ₹1.67 lakh crore by the central government will support GVA in PADO during Q2. GVA in financial, real estate and professional services fell in Q1:2020-21 due to weak performance of information technology companies after closing down of businesses in travel, tourism and hotel industries due to the pandemic. Real estate companies also suffered due to subdued sales growth. In financial services, bank credit growth decelerated while deposits growth marginally improved during May-September. | Table III.8: Services Sector: High Frequency Indicators | | (YoY Growth in Per cent) | | Sr. No. | Indicator | Jan-20 | Feb-20 | Mar-20 | Apr-20 | May-20 | Jun-20 | Jul-20 | Aug-20 | Sep-20 | | 1 | Transport | | | | | | | | | | | | Commercial Vehicles Sales | -14.0 | -32.9 | -88.1 | | -84.8 | | | | | | | Passenger Vehicles Sales | -6.2 | -7.6 | -51.8 | -100 | -85.3 | -49.6 | -3.9 | 14.2 | | | | Two-wheeler Sales | -16.1 | -19.8 | -39.8 | -100 | -83.8 | -38.6 | -15.2 | 3.0 | | | | Tractor Sales | 4.8 | 21.3 | -49.9 | -79.4 | 4.0 | 22.4 | 38.5 | 74.7 | | | | Railway Freight Traffic | 2.8 | 6.5 | -13.9 | -35.3 | -21.3 | -7.7 | -4.6 | 3.9 | 15.5 | | | Port Freight Traffic | 2.2 | 4.6 | -5.3 | -21.1 | -23.3 | -14.6 | -13.2 | -10.4 | -1.9 | | | Domestic Air Passenger Traffic | 1.5 | 9.8 | -32.9 | -99.9 | -97.4 | -83.5 | -82.6 | -75.8 | | | | Domestic Air Cargo Traffic | 0.8 | 1.7 | -32.6 | -92.8 | -82.9 | -48.0 | -41.4 | -36.0 | | | | International Air Passenger Traffic | 0.2 | -3.4 | -56.2 | -99.1 | -98.0 | -93.0 | -90.4 | -89.7 | | | | International Air Freight Traffic | -2.9 | -3.1 | -31.7 | -77.0 | -58.2 | -35.7 | -30.1 | -24.9 | | | 2 | Communications | | | | | | | | | | | | Telephone Subscribers Base | -2.2 | -2.0 | -0.5 | -1.2 | -1.6 | -2.2 | | | | | | Mobile/Wireless | -2.2 | -2.0 | -0.4 | -1.1 | -1.6 | -2.1 | | | | | 3 | Construction | | | | | | | | | | | | Cement Production | 5.1 | 7.8 | -25.1 | -85.2 | -21.4 | -6.8 | -13.5 | -14.6 | | | | Steel Consumption | 4.1 | -6.5 | -29.2 | -85.5 | -48.3 | -28.3 | -11.7 | -16.5 | -5.7 | | 4 | Financial services | | | | | | | | | | | | Non-food Credit | 8.5 | 7.3 | 6.7 | 7.3 | 6.8 | 6.0 | 5.4 | 5.5 | 5.3 | | | Aggregate Deposits | 9.9 | 9.0 | 7.9 | 9.9 | 10.6 | 11.0 | 11.1 | 10.9 | 10.5 | | 5 | Public Administration & Defence | | | | | | | | | | | | Revenue Expenditure* | -7.0 | 14.3 | 69.8 | 53.4 | -26.4 | 97.7 | 24.4 | -26.6 | | | *: excluding Interest payments and Subsidies. |
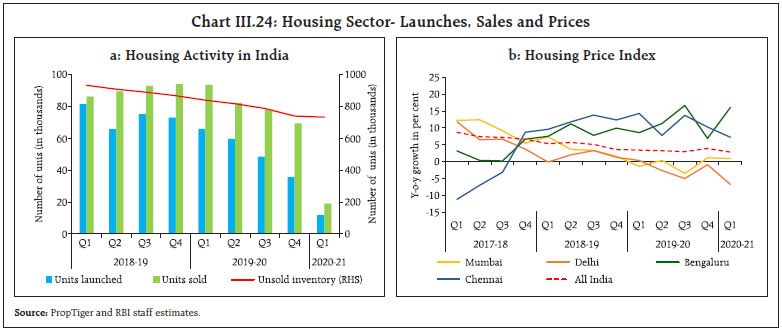 In residential real estate, both sales and new launches contracted in Q1:2020-21, primarily due to the lockdown and sluggish consumer sentiment, leading to rise in inventory overhang (Chart III.24a). The all-India housing price index of RBI decelerated in Q1:2020-21. The sub-indices for Delhi contracted substantially from the previous quarter while that for Bengaluru registered a substantial growth (Chart III.24b). III.3. Conclusion Available information suggests a gradual recovery is under way with the re-opening of the economy. While the rising number of COVID-19 infections continues to weigh on the near-term outlook, private consumption may recover faster than other components of aggregate demand with a boost from rural demand on the back of bright agricultural prospects. Private investment may, however, take longer to stabilize, hamstrung by low capacity utilisation, still subdued bank credit and the global recession. The prospects for the industrial sector hinge around the response to the government’s initiatives, including Make in India. The gamechanger would be public capital spending, given its high multiplier effect. An early containment of the pandemic should also speed up the revival. The outlook for the services sector also improved with activity gaining some momentum in Q2.
_________________________________________________________
IV. Financial Markets and Liquidity Conditions During H1:2020-21, domestic financial markets returned to normalcy with a recovery in trading volumes, narrowing of spreads and rebounds in financial asset prices. Equity markets recovered strongly from panic sell-offs in March tracking global movements. The Indian rupee (INR) appreciated vis-à-vis the US dollar with the return of investor appetite for EME assets. In the credit market, transmission has improved considerably relative to the historical experience. Going forward, liquidity conditions would continue to be calibrated, consistent with the stance of monetary policy while ensuring normalcy in the functioning of financial markets and institutions and conducive financial conditions. In Q2:2020-21, global financial markets have stabilised after recovering from the tailspin during February and March 2020. In more recent weeks, sentiments have been intermittently dampened by rising infections and geo-political tensions or lifted by news on the progress on the vaccine. In large measure, the calm in financial markets after the turbulence in March has been engendered by liquidity infusions, monetary policy actions by central banks and stimulus measures undertaken by national governments. Equity markets in major advanced economies (AEs) and emerging market economies (EMEs) have registered handsome gains with the return of risk-on sentiments. Gold prices surged to record highs in early August, but have been range-bound more recently. Bond yields softened and spreads narrowed in the wake of substantial unconventional liquidity operations and strong demand for safe assets; relative to other segments, however, bond markets have moved sideways and in a narrow range. In currency markets, the US dollar depreciated markedly as fatalities increased amid rising infection numbers and with signals from the US Federal Reserve (FED) that monetary policy would continue to remain accommodative for a long period, reinforced by an average inflation targeting framework allowing transitory target overshoot to support maximum employment. Most EME currencies have appreciated against a weakening dollar and the return of capital flows after a hiatus. IV.1 Domestic Financial Markets During H1:2020-21, domestic financial markets returned to normalcy with a recovery in trading volumes, narrowing of spreads and rebounds in financial asset prices after a near collapse in market activity, post the imposition of the nation-wide lockdown to combat COVID-19. A slew of monetary, liquidity, credit easing and regulatory measures by the Reserve Bank of India (RBI) and the government’s stimulus package enthused market sentiment. Nevertheless, concerns about the duration of the pandemic, the large expansion in market borrowings by the public sector, border tensions and rising inflation prints intermittently kept markets on edge. In money and bond markets, spreads compressed to below pre-COVID levels, spurring record corporate bond issuances. Equity markets recovered strongly from panic sell-offs in March tracking global movements. The Indian rupee (INR) initially came under pressure with the spread of the pandemic, but has subsequently appreciated vis-à-vis the US dollar with the return of investor appetite for EME assets. In the credit market, transmission has improved considerably relative to the historical experience, facilitated by large policy rate cuts, persisting abundance of liquidity and the introduction of the external benchmark system for the pricing of loans in select sectors. Bank credit growth has, however, remained tepid. IV.1.1 Money Market Money markets have remained broadly stable during H1:2020-21 due to proactive liquidity management by the Reserve Bank. In the overnight uncollateralised segment, the weighted average call rate (WACR) – the operating target of monetary policy – remained within the policy corridor although it traded with a distinct downward bias, reflecting the comfortable liquidity and financing conditions (Chart IV.1). In the call money segment, the weighted average rate on traded deals persisted above rates on reported deals.1 The share of reported deals increased to 57 per cent in May 2020 from 49 per cent in the previous month due to increase in lending activity by co-operative banks whose share increased to 68 per cent in May (Chart IV.2). The increasing share of reported deals also contributed to pulling down the WACR closer to the reverse repo rate in May 2020. The share of reported deals moderated in September (41 per cent) in tandem with reduced lending (58 per cent) by co-operative banks. 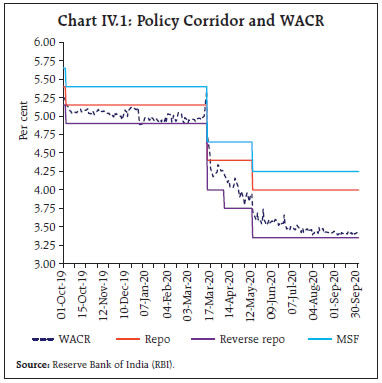
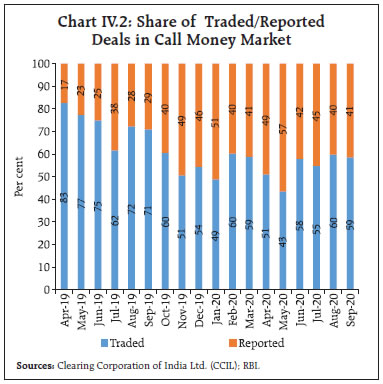 The secured segments (triparty repo and market repo) remained dominant in overnight money market activity in H1:2020-21, with a share of more than 95 per cent in total volumes (Chart IV.3). Within the secured segment, market repos gained in turnover, reflecting (i) increase in participant base and (ii) increased lending by mutual funds. The shares of borrowings by public sector banks in both the triparty repo and market repo segments moderated in H1, while private sector banks increased their share of borrowings in the triparty repo segment. 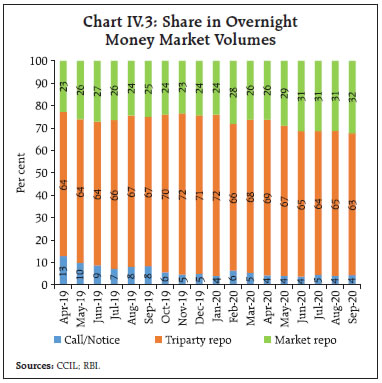 Interest rates in the secured overnight segments traded below the reverse repo rate in H1 reflecting the surplus system liquidity conditions and increased lending by mutual funds. As a result, the spread between the collateralised rates and the uncollateralised rate (WACR) widened (Chart IV.4): the triparty repo rate and the market repo rate traded below the WACR by 59 basis points (bps) and 58 bps, respectively, in H1:2020-21 as against 36 bps and 37 bps, respectively, in H2:2019-20. 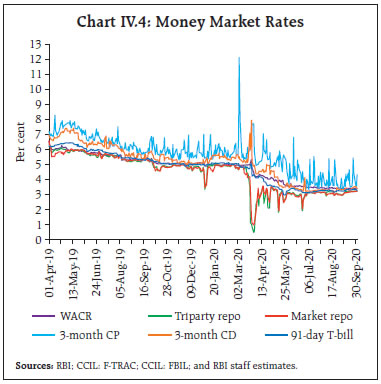 Interest rates on money market instruments such as certificates of deposit (CDs), commercial papers (CPs) and Treasury Bills (T-bills) of 3-month maturity softened by 156 bps, 155 bps and 97 bps, respectively, in H1:2020-21, reflecting the policy rate cuts and liquidity augmenting measures. Fresh issuance of CDs by banks moderated to ₹45,165 crore during H1:2020-21 (up to September 11, 2020) from around ₹1.75 lakh crore in the corresponding period of H1:2019-20 in view of surplus liquidity and muted credit demand. Aggregate CP issuances declined to ₹7.9 lakh crore during H1:2020-21 from ₹11.9 lakh crore during H1:2019-20 (Chart IV.5a), although corporates took advantage of lower interest rates and increased their share. The share of non-banking financial companies (NBFCs) in CP issuances, which was low at the beginning of H1, increased sharply in September 2020 in response to the measures taken by the Government to provide liquidity support to the non-bank lenders through the special liquidity scheme and partial credit guarantee scheme. The share of government owned NBFCs, however, declined in September 2020 as they preferred longer-term borrowings (Chart IV.5b). 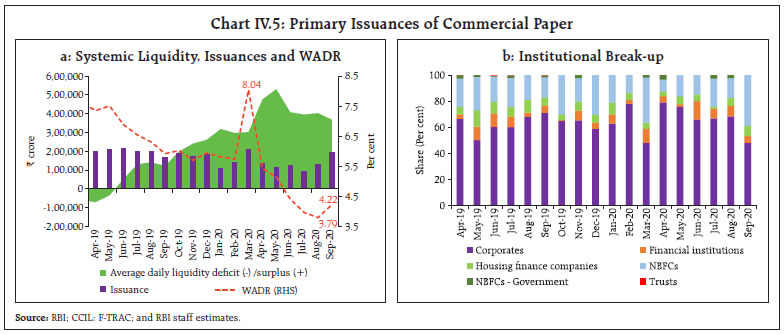 IV.1.2 Government Securities (G-sec) Market During H1:2020-21, yields on government bonds moderated, with the 10-year paper softening by 29 bps in response to the slew of conventional and unconventional measures taken by the Reserve Bank to enhance systemic liquidity and compress term spreads. These measures headed off persistent upward pressures on yields from the higher supply of paper. The hardening of yields at the beginning of Q1:2020-21 was mitigated by liquidity augmenting measures announced in the second half of April and May (Section IV.3 provides details).2 With the announcement of an enhancement of Central Government market borrowings by about 54 per cent – from ₹7.8 lakh crore to ₹12.0 lakh crore – for 2020-21, however, the benchmark yield rose by 20 bps on May 11, 2020. In June, several factors viz., low demand for dated securities; border tensions; rating downgrade by Fitch Ratings; and supply fatigue from increased issuances of T-bills and state development loans (SDL) kept yields firm. Subsequently, however, softening US treasury yields, fall in crude oil futures, and the announcement of special open market operations (OMOs) or “Operation Twist”, eased pressure on yields by end-June (Chart IV.6). Overall, the 10-year benchmark yield softened by 15 bps in Q1:2020-21. 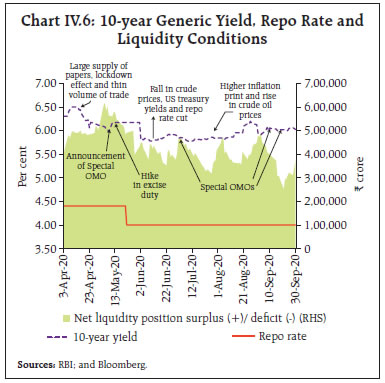 In Q2:2020-21, yields exhibited a hardening bias on a rise in fuel prices and higher inflation prints for June and July. The Reserve Bank conducted five operation twist auctions during July-September and backed them up with an increase in the limit of SLR securities kept under the held to maturity (HTM) category by 2.5 per cent of NDTL – from 19.5 per cent to 22 per cent. Overall, the 10-year yield (5.79 per cent GS 2030) hardened by 12 bps in Q2, mainly reflecting a 24 bps rise in August. Trade in Dated Securities Owing to the near cessation of market activity after the imposition of the nation-wide lockdown, the growth of average trading volume in G-sec segment was 32.3 per cent lower during H1:2020-21 than a year ago (Chart IV.7a). In contrast, the growth of average trading volume in T-bills (including cash management bills) was 62.3 per cent higher, reflecting the market preference for securities of shorter tenor to minimise duration risk amidst the uncertainty caused by the pandemic (Chart IV.7b). 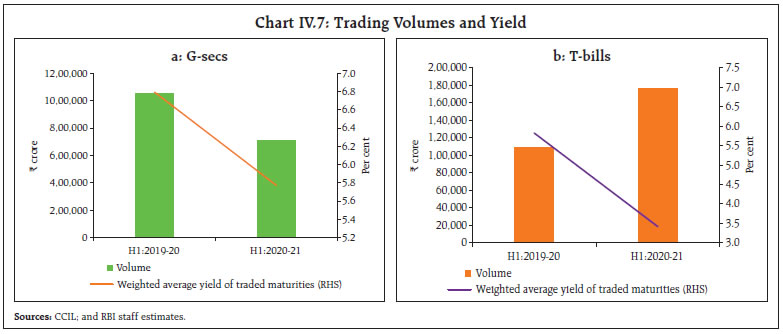 The yield curve responded to policy measures as well as to evolving global/domestic developments during H1:2020-21, as reflected in shifts in latent factors viz., level and slope (Chart IV.8a).3 The average level softened by 15 bps in H1 while the slope of the yield curve steepened considerably (76 bps), the latter reflecting the softening of rates at the shorter-end due to monetary easing and persistent pressures at the longer end from apprehensions of higher supply of papers in that segment (Chart IV.8b). FPI Investment in G-Sec After the outbreak of the pandemic, foreign portfolio investors (FPIs) turned net sellers in both the equity and the debt segments in April 2020. With receding uncertainty and improvement in market sentiment, FPIs turned net buyers in the equity markets beginning in May. In the debt segment, however, they largely remained net sellers during May and July owing to India’s outlook downgrade by Fitch and Moody’s and escalation of trade tension between the US and China. Measures to infuse additional liquidity globally and favourable domestic and international factors turned FPIs into net buyers in the equity segment (May-August) and in the debt segment during August. Renewed concerns about domestic growth prospects, coupled with weak global cues, turned FPIs into net sellers in the equity segment as against net buyers in the debt segment in September (Chart IV.9). Treasury Bills After a 75 bps policy rate cut and the announcement of liquidity augmenting measures on March 27, 2020, yields on T-bills softened sharply, dipping below the reverse repo rate (Chart IV.10). In the face of pandemic-induced uncertainty, the demand for short-term and liquid securities increased significantly. Accordingly, the Reserve Bank in consultation with the GoI increased the issuance limit of T-bills from ₹25,000 crore per week to ₹45,000 crore per week for the quarter ending June. This was subsequently reduced to ₹35,000 crore per week in Q2:2020-21. State Development Loans The weighted average spread of cut-off yields on state development loans (SDLs) over the G-sec yield of corresponding maturity at 53 bps during H1:2020-21 was marginally higher by 1 bps on a year-on-year basis (Chart IV.11). The average inter-state spread on securities of 10-year maturity (fresh issuance) was higher at 9 bps in H1:2020-21 (4 bps in H1:2019-20). In order to enable states/UTs to counter the pandemic-related stress on their finances, the ways and means advances (WMA) limit for State Governments was increased by 60 per cent in two stages (April 1 and April 17). The number of days for which a state/UT can be in overdraft was also increased, effective April 7, 2020. Switching of Securities In order to facilitate debt consolidation, the Reserve Bank conducted five switch operations on behalf of the government amounting to ₹76,047 crore during H1:2020-21. Reflecting these operations, the weighted average maturity (WAM) of outstanding stock of G-secs increased to 10.97 years as at end-September from 10.54 years at end-March 2020. As at end -September, the weighted average coupon (WAC) at 7.44 per cent was lower than 7.69 per cent at end-March 2020. IV.1.3 Corporate Bond Market The corporate bond market, which experienced severe stress during March-April 2020 after the outbreak of COVID-19, regained normalcy during the rest of H1:2020-21 with decadal low yields, record primary market issuances and increased secondary market turnover. During H1:2020-21, yields on AAA-rated 3-year bonds issued by NBFCs; corporates; and public sector undertakings (PSUs), financial institutions (FIs) and banks moderated significantly – by 157 bps, 170 bps and 114 bps, respectively – aided by surplus liquidity conditions, targeted long-term repo operations (TLTROs) and “operation twist” auctions (Chart IV.12a). The fall in yields (of similar maturity) was also evident across issuer categories and credit ratings (Chart IV.12b). 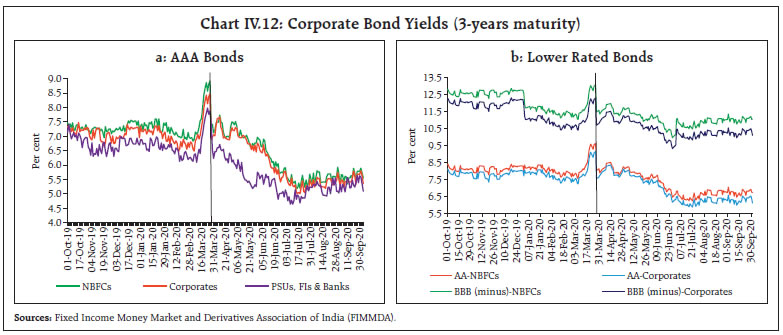 Resource mobilisation through issuances of corporate bonds in the primary market at ₹3.2 lakh crore during H1:2020-21 (up to August 2020) was higher by 23.5 per cent than ₹2.6 lakh crore during the corresponding period of the previous year (Chart IV.13a). Almost the entire resource mobilisation in the corporate bond market (99.7 per cent) was through the private placement route. Outstanding investments by FPIs in corporate bonds declined to ₹1.5 lakh crore at end- September 2020 from ₹1.7 lakh crore at end-March 2020. Consequently, FPIs’ utilisation of the approved limit for investment in corporate bonds declined to 33.8 per cent at end-September 2020 from 54.5 per cent at end-March 2020. The daily average secondary market trading volume in the corporate bond market increased by 8.9 per cent to ₹8,985 crore during H1:2020-21 over the corresponding period of the previous year (Chart IV.13b), boosted by the regulatory requirement of investing a part of TLTRO funds in the secondary market. 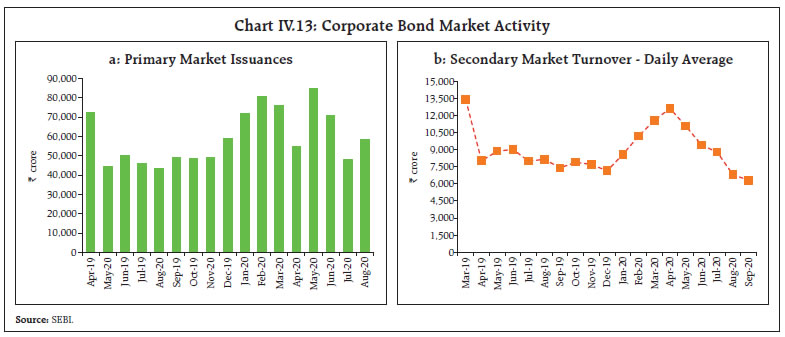 Following the outbreak of the pandemic, global spillover effects resulted in a significant tightening of domestic financial conditions, which peaked between end-March and mid-April but moderated gradually thereafter (Chart IV.14a). The spread on 3-month CPs (over 91-day T Bills) reduced from 170 bps on March 26, 2020 to 105 bps by September 30, 2020 while that on AAA-rated 3-year bonds (over 3-year G-sec) issued by corporates fell from 276 bps to 43 bps during the same period (Chart IV.14b). Over the same period, the spreads on lower rated corporate bonds also moderated significantly: by 223 bps for AA-rated 3-year bonds and by 140 bps on BBB- (BBB minus) rated 3-year bonds – the lowest rated investment grade bonds (Table IV.1). The market perception of credit risk also eased with the gradual unlocking of the economy: State Bank of India’s and ICICI Bank’s 3-year credit default swap (CDS) spreads reduced by 77 bps and 85 bps, respectively, during H1:2020-21. | Table IV.1: Financial Markets - Rates and Spread | | | Interest Rates (per cent) | Spread in bps (over corresponding risk-free rate) | | Instrument | As on March 26, 2020 | As on September 30, 2020 | Variation
(in bps) | As on March 26, 2020 | As on September 30, 2020 | Variation
(in bps) | | (1) | (2) | (3) | (4 = 3-2) | (5) | (6) | (7 = 6-5) | | CP (3-month) | 6.74 | 4.32 | -242 | 170 | 105 | -65 | | Corporate Bonds# | | | | | | | | (i) AAA (1-yr) | 7.76 | 4.35 | -341 | 246 | 47 | -199 | | (ii) AAA (3-yr) | 8.47 | 5.35 | -312 | 276 | 43 | -233 | | (iii) AAA (5-yr) | 7.84 | 6.10 | -174 | 141 | 50 | -91 | | (iv) AA (3-yr) | 9.15 | 6.13 | -302 | 344 | 121 | -223 | | (v) BBB-minus (3-yr) | 12.29 | 10.10 | -219 | 658 | 518 | -140 | | 10-yr G-sec | 6.22 | 6.01 | -21 | - | - | - | #: Issued by Corporates.
Sources: CCIL: F-TRAC; FIMMDA; and Bloomberg. | Summing up, the measures undertaken by the Reserve Bank and the Government have restored stability in financial markets and institutions. Fears of illiquidity, which froze market activity across various segments, have been dispelled as reflected in softening of yields and narrowing of spreads across money and bond market instruments (Box IV.1). Box IV.1: Unconventional Monetary Policy Measures: Impact on Bond Market Various measures undertaken by the Reserve Bank to augment system-level and targeted liquidity produced differential responses in terms of varying intensity of appetite for funds as reflected in the bid-cover ratio (Chart IV.1.1). The announcement effects of LTROs and TLTROs on the benchmark 10-year G-sec yield is examined over a 3-hour period (windows of 15 minutes interval) prior to and after the announcement. Based on the two-sample Wilcoxon rank-sum (Mann-Whitney) tests, six out of the eight announcements had a statistically significant downward impact on yields prior to and post announcement of auctions (Table IV.1.1).4 | Table IV.1.1: Difference in G-Sec Yields Pre- and Post-Announcement of Auctions – Tests of Significance | | Announcement Dates | LTROs | TLTROs | | Feb,07 | Feb,25 | Mar,16 | Mar,27 | Mar,30 | Apr,03 | Apr,15 | Apr,17 | | z-stat | 4.157 | 0.693 | -3.637 | 2.744 | 4.157 | -4.157 | 3.465 | 4.157 | | Probability that post-announcement yield is lower than pre-announcement | 1.000 | 0.583 | 0.063 | 0.830 | 1.000 | 0.000 | 0.917 | 1.000 | For the six announcements for which the decline in yields was statistically significant, the duration and magnitude of the announcement effect on intra-day yields can be examined by the average difference in yields at intervals of 15 minutes post-announcement from that of the average yield an hour prior to the auction announcement. The maximum average impact is found fifteen minutes after the announcement with a moderation of about 4 bps in yields from the average of the hour before announcement (Chart IV.1.2). An hour after the announcement, the moderation in yields turns statistically insignificant. 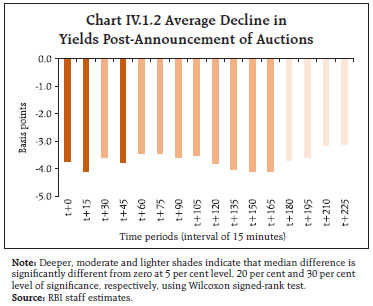 In order to explore the impact of the actual auction outcome on yields and their persistence in an event study framework (Hartley and Rebucci, 2020), an autoregressive (AR) model is estimated, based on data spanning December 2019-August 2020, for daily changes in 10-year bond yields (G-sec as well as corporate bonds separately) regressed on LTRO and TLTRO auction dates (as dummies) with controls for other key variables that can impact yields, viz., changes in the policy repo rate, and changes in the US economic policy uncertainty5 (as a proxy for factors such as international oil prices and yield movements), with the following specifications: 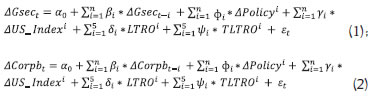 The estimates indicate that the LTRO and TLTRO auctions softened yields on 10-year G-secs and on 10-year corporate bonds by around 29 bps and 47 bps, respectively (Table IV.1.2)6. The reduction in the policy rate (from 5.15 per cent to 4.0 per cent over the sample period) is estimated to have softened G-sec and corporate bond yields by another 8-9 bps. Overall, the measures undertaken by the Reserve Bank had a sobering impact on yields and risk spreads, which helped in easing market stress and softening financing conditions. | Table IV.1.2: UMP Impact on Bond Yields | | Variables | ΔG-sec | ΔCorporate bond | | ΣLag (-1 to -2) | -0.067 | 0.025 | | ΔPolicy rate | 0.082*** | 0.069*** | | ΔUS policy uncertainty (-1) | 0.00006 | 0.0003 | | ΣLTRO | -0.0566* | -0.227*** | | ΣTLTRO | -0.238*** | -0.242*** | | ΣLTRO + ΣTLTRO | -0.294*** | -0.470*** | | Diagnostic tests (p-values) | | BG LM test for the null of no autocorrelation of residuals | 0.325 | 0.192 | | ARCH LM test for conditional heteroscedasticity | 0.310 | 0.923 | Notes: *,**, ***: Denote 10, 5 and 1 per cent level of significance, respectively;
Source: RBI staff estimates. | Reference: Hartley, J. S. and A. Rebucci (2020), “An Event Study of COVID-19 Central Bank Quantitative Easing in Advanced and Emerging Economies”, NBER Working Paper No. 27339, June. | IV.1.4 Equity Market After undergoing intense volatility in Q4:2019-20 following the COVID-19 outbreak with a massive disruption in business activity, the Indian equity market made a strong V-shaped recovery in H1:2020-21. The BSE Sensex gained 46.5 per cent in H1:2020-21 after hitting a low of 25981 on March 23, 2020 (Chart IV.15a). Strong rallies in global equity markets on the back of massive fiscal and monetary stimuli in major countries and the measures undertaken in India boosted domestic market sentiments. In Q1:2020-21, the equity market had posted its biggest monthly gain in 11 years in April 2020, with the BSE Sensex increasing by 14.4 per cent. In the later part of April, the closure of six debt fund schemes by a mutual fund weighed adversely on domestic market sentiment. This was quickly reversed, however, following the Reserve Bank’s announcement of liquidity augmenting measures, including the special liquidity facility for mutual funds (SLF-MF) on April 27, 2020. Bearish sentiments gripped the stock market in early May, with the Sensex declining by 2002 points (5.9 per cent) on May 4 in sync with global peers amidst (i) escalating tensions between US and China; (ii) dismal quarterly earnings results of corporates; and (iii) extension of lockdown till end-May. The announcement of the ₹20 lakh crore “Atmanirbhar Bharat” stimulus package by the Government and a large policy repo rate cut by the Reserve Bank on May 22 boosted investor sentiment. The market rebounded in June 2020 with the BSE Sensex posting its best quarterly return (18.5 per cent) since 2009. Border tensions and downward revision in India’s GDP growth projections for 2020-21 by various agencies capped the upside in equities. The recovery continued in July and August on the back of positive news from encouraging trials of the coronavirus vaccine and hopes of more supportive measures by national authorities globally. On the domestic front, the rally in equities was also supported by improvement in the manufacturing PMI for June 2020, reports of disengagement between India and China over border issues and better than expected Q1:2020-21 corporate earnings results. Domestic market sentiment was tempered during August by contraction in manufacturing PMI and higher-than-expected CPI inflation print for July 2020. The stock market plummeted sharply in the last trading session of the month due to fresh escalation in Indo-China border tensions and witnessed cautious trading ahead of the implementation of new trading norms on margin requirements by the Securities and Exchange Board of India (SEBI) from September 1, 2020. Investor sentiment remained insipid in September 2020 amidst concerns over steady increase in coronavirus infections and weak global cues. After registering moderate gains due to improvement in domestic manufacturing PMI for August 2020, equity sentiments turned negative with the BSE Sensex witnessing its biggest intra-day fall in more than four months on September 24 as spike in infections in some European countries triggered fears of a second round of lockdown. Bullish sentiments, however, returned towards the end of the month amid expectations of further stimulus measures by the government. During H1:2020-21, FPIs turned net buyers in the Indian equity market after panic sales in March due to flight to safety. MFs, however, were net sellers to the tune of ₹24,801 crore during H1:2020-21 (Chart IV.15b). Resource mobilisation through public and rights issues of equity increased to ₹76,830 crore during H1:2020-21 from ₹60,133 crore in the corresponding period of the previous year. IV.1.5 Foreign Exchange Market The INR exhibited movements in both directions against the US dollar during H1:2020-21. After depreciating to its lowest level of ₹76.81 on April 22, 2020, the INR subsequently appreciated owing to FPI flows to the domestic equity market with the return of risk appetite for EME assets and the depreciation of the US dollar. The appreciation of the INR against the US dollar was modest as compared with EME peers (Chart IV.16a). In terms of the 36-currency nominal effective exchange rate (NEER), the INR depreciated by 0.6 per cent (as at end-September 2020 over the average of March 2020), but it appreciated by 2.1 per cent in terms of the 36-currency real effective exchange rate (REER) during the same period (Table IV.2). Between March and August 2020, the appreciation of the INR in terms of the REER was lower than that of the Indonesian rupiah, the Taiwan dollar and the Philippine peso (Chart IV.16b). Table IV.2: Nominal and Real Effective Exchange Rates – Trade-based Weights
(Base: 2004-05 = 100) | | Item | Index:
end-September 2020(P) | Appreciation (+) / Depreciation (-)
(Per cent) | | end-September 2020 over March (average) 2020 | | 36-currency REER | 117.0 | 2.1 | | 36-currency NEER | 70.8 | -0.6 | | 6-currency REER | 123.8 | 1.8 | | 6-currency NEER | 59.6 | -2.0 | | ₹/US$ | 73.8 | 0.7 | P: Provisional.
Sources: RBI; and FBIL. | Financial Markets Barometer A cross-market barometer illustrates vividly the recovery in financial markets from the disruptions caused by the pandemic.7 The barometer consists of nine indicators across markets (money, bonds, foreign exchange and equities) and compares the level of each indicator on a certain day with its pre-turmoil level (calibrated as zero on the scale) and with its level at a ‘peak’ in the turmoil (calibrated as 100).8 The pre-turmoil level for all indicators is taken as January 1, 2020, while the peak turmoil day is indicator specific and happens to concentrate around March 24, 2020 (the day of imposition of country-wide lockdown) and in some cases in May 2020 (Chart IV.17). The barometer presents four different stages after the declaration of the COVID-19 pandemic (by construction, a decreasing tendency indicates recovery of the market segment). In response to the gradual opening of the economy and the proactive measures taken by the Reserve Bank and the Government, an improvement in sentiments in the foreign exchange and stock market indicators took hold from May onwards. Money and bond market spreads started easing following (i) the introduction of the new benchmark paper on May 8, 2020; (ii) the announcement of Atmanirbhar Bharat stimulus package by the Government; and (iii) policy rate cut of 40 bps on May 22, 2020. All nine indicators suggest improvement in financial market sentiments in September vis-à-vis the elevated stress levels of March and May. 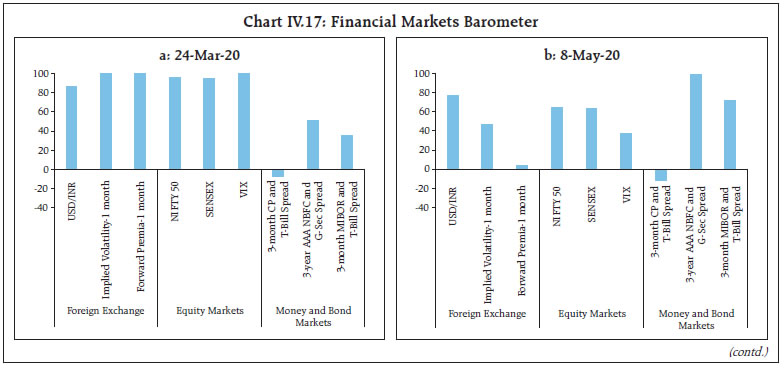
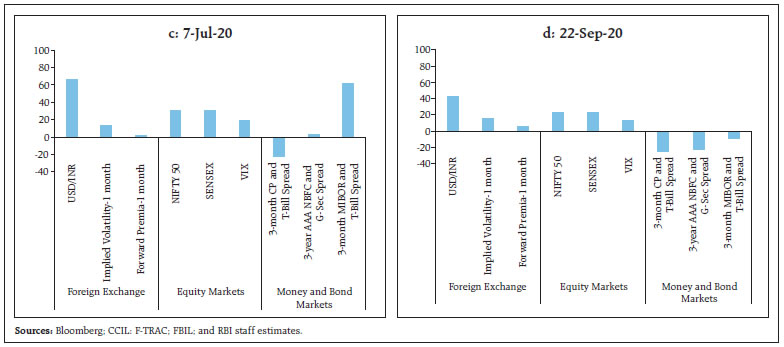 IV.1.6 Credit Market During H1:2020-21, bank credit offtake was anaemic, reflecting weak demand and uncertainty in the wake of the pandemic. Non-food credit growth (y-o-y) at 5.1 per cent as on September 25, 2020 was lower than 8.6 per cent a year ago, driven by weak momentum and base effects (Chart IV.18). The slowdown in credit growth was spread across all bank groups, especially foreign banks. Credit growth of the public sector banks remained modest, although with some uptick since March 2020 (Chart IV.19a). Of the incremental credit extended by the scheduled commercial banks (SCBs) on a year-on-year basis (September 27, 2019 to September 25, 2020), 62.3 per cent was provided by the public sector banks and 41.2 per cent by the private sector banks, while the share of the foreign banks turned negative (Chart IV.19b). The deceleration in non-food credit growth was broad-based with credit offtake slowing down in all the major sectors. Though personal loans and credit to agriculture registered some improvement in July 2020, the momentum could not be sustained in August. Credit growth to services and industrial sectors has also tapered off after showing some promise in Q1; 2020-21 (Chart IV.20a). Personal loans accounted for the largest share of total credit flow in August 2020, followed by services. While the share of personal loans, services and agriculture increased in August 2020 vis-a-vis the previous year, the share of industry contracted (Chart IV.20b). 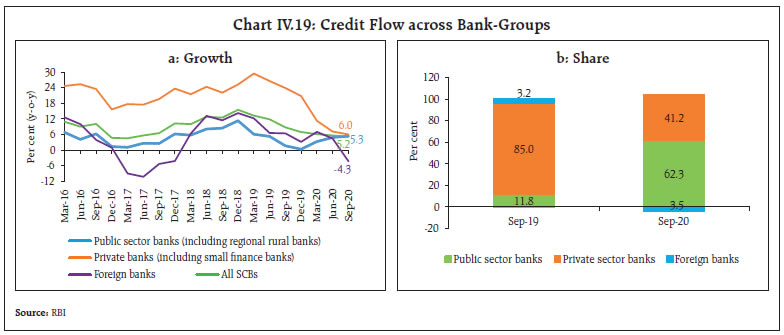
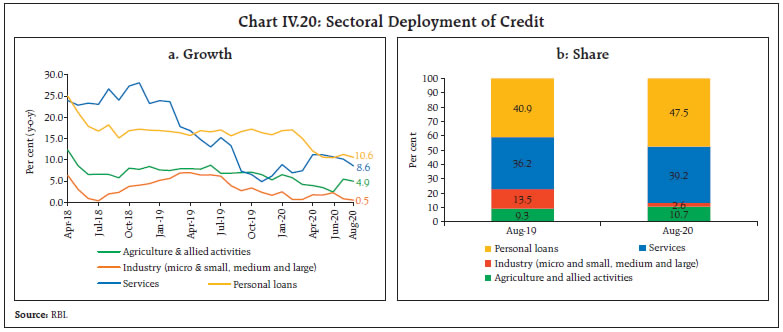 Within industry, credit growth to food processing, mining and quarrying, petroleum, coal products and nuclear fuels, leather and leather products, wood and wood products, and paper and paper products accelerated in August 2020 as compared with a year ago. In contrast, credit growth to chemicals and chemical products, rubber plastic and their products, infrastructure, construction, gems and jewellery, glass and glassware, basic metal and metal products and beverage and tobacco decelerated/contracted. In the services sector, credit growth to computer software picked up significantly in recent months, reflecting the increased use of digital technology during the COVID-19 period (Chart IV.21a). Credit to the NBFC sector decelerated to 17.1 per cent in August 2020 from 38.8 per cent a year ago. In the personal loan segment, growth in vehicle loans accelerated from 3.7 per cent in August 2019 to 8.4 per cent in August 2020; during the same period, growth in housing loans decelerated from 16.6 per cent to 11.1 per cent. The share of trade in non-food credit flow increased sharply in August 2020 vis-a-vis its level in the corresponding month of the previous year (Chart IV.21b). 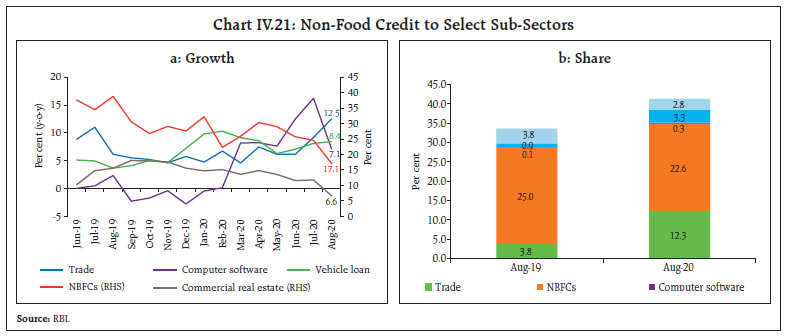 The asset quality of SCBs improved during 2020-21 (up to June), with the overall non-performing assets (NPA) ratio declining to 8.0 per cent in June 2020 from 9.4 per cent a year ago (Chart IV.22a). The NPA ratio in respect of agriculture and services increased over the same period (Chart IV.22b). Boosted by TLTROs, non-SLR investments of banks (comprising investments in CPs, bonds, debentures and shares of public and private corporates) increased by 1.8 per cent in H1:2020-21 as against a decline of 3.9 per cent in H1:2019-20 (Chart IV.23a). Adjusted non-food credit growth decelerated from 8.4 per cent in Q2:2019-20 to 5.1 per cent in Q2:2020-21 (Chart IV.23b). Banks augmented their SLR portfolios in the wake of deceleration in credit offtake and higher government borrowings. Consequently, excess SLR maintained by all scheduled commercial banks increased to 11.1 per cent of net demand and time liabilities (NDTL) in Q2:2020-21 (up to August 28) from 7.1 per cent a year ago (Chart IV.24). IV.2 Monetary Policy Transmission The transmission of policy repo rate changes to deposit and lending rates of banks improved since the April 2020 MPR. The weighted average lending rate (WALR) on fresh rupee loans declined by 91 bps since March 2020 in response to the reduction of 115 bps in the policy repo rate and comfortable liquidity conditions (Table IV.3). | Table IV.3: Transmission from the Repo Rate to Banks’ Deposit and Lending Rates | | (Basis points) | | Period | Repo Rate | Term Deposit Rates | Lending Rates | | Median Term Deposit Rate | WADTDR | 1 - Year Median MCLR | WALR - Outstanding Rupee Loans | WALR - Fresh Rupee Loans | | February - September 2019 (Pre-external benchmark) | -110 | -9 | -7 | -30 | 2 | -40 | | October 2019 - September 2020* (Post-external benchmark) | -140 | -157 | -98 | -114 | -64 | -122 | | March 2020 - September 2020* | -115 | -125 | -59 | -80 | -46 | -91 | | February 2019 - September 2020* | -250 | -190 | -105 | -138 | -62 | -162 | *: Latest data on WALRs and WADTDR pertain to August 2020.
WALR: Weighted Average Lending Rate. WADTDR: Weighted Average Domestic Term Deposit Rate;
MCLR: Marginal Cost of Funds-based Lending Rate.
Source: RBI. | The pass-through to WALR on fresh rupee loans was higher than the softening of yield on 5-year corporate bonds (79 bps) and yield on 10-year G-Secs during March – August 2020 (Chart IV.25). The WALR on outstanding rupee loans declined by 46 bps during this period, but this transmission is an improvement over the earlier period. Of the 105 bps reduction in the weighted average domestic term deposit rate (WADTDR) on outstanding rupee deposits during the ongoing easing cycle (i.e., since February 2019), a little over half of the decline, i.e. 59 bps occurred since March 2020. The median term deposit rate, which reflects the prevailing card rates, has registered a sizable decline of 125 bps since March 2020, reflecting the combined impact of surplus liquidity, the introduction of external benchmark-based pricing of loans and weak credit demand conditions (Chart IV.26). 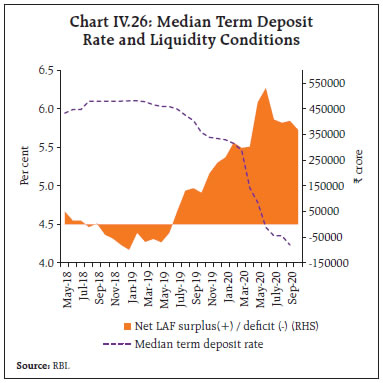 Apart from the reduction in term deposit rates, many banks also lowered their saving deposit rates during the current easing cycle. The saving deposit rates of five major banks, which ranged 3.50-4.00 per cent at the beginning of the easing cycle in early February 2019 and 3.25-3.50 per cent immediately prior to the introduction of the external benchmark, were placed at 2.70-3.00 per cent in September 2020. The flexible adjustment of saving deposit rates bodes well for monetary transmission to lending rates in comparison to the rigidity characterising saving deposit rates in earlier years. The decline in both the lending and deposit rates is more pronounced for foreign banks (Chart IV.27). The deposit base of foreign banks is primarily made up of low cost and lower duration wholesale deposits, which adjust quickly to policy rate changes. On the other hand, the public sector banks depend more on retail term deposits and face competition from alternative saving instruments like small savings, which constrains them from lowering rates in sync with the policy rate. While the private sector banks exhibited greater transmission in terms of WALR on fresh rupee loans and WADTDR compared to public sector banks, the decline in WALR on outstanding rupee loans is more for public sector banks. The 1-year median marginal cost of funds-based lending rate (MCLR) charged by public sector banks and private sector banks declined further during H1:2020-21 (Chart IV.28). Spreads of WALRs on outstanding rupee loans and fresh rupee loans over 1-year median MCLR were uneven across sectors (Chart IV.29). In personal loans, the spread was among the lowest in respect of housing loans, reflecting lower defaults and the availability of collateral. Personal loans - other than housing and vehicle loans - are mostly unsecured and involve higher credit risk; hence, the spread charged was the highest for other personal loans. The lower WALRs on rupee export credit reflect the interest rate subvention provided by the government.
There has been a significant improvement in transmission to all new loans sanctioned since October 2019 when the new floating rate loans to retail and MSME sectors were mandatorily linked to the external benchmark (Chart IV.30). The quantum of decline in WALRs on personal and MSME loans was more than that for aggregate fresh rupee loans to all sectors (120 bps). The introduction of external benchmark linked loans has incentivised banks to adjust their term as well as saving deposit rates in line with the benchmark rates to protect their net interest margins (NIMs). The reduction in term deposit rates applies only to fresh term deposits, while it is across the board in the case of saving deposits.9 The latter brings about an instantaneous reduction in the banks’ cost of funds, and in turn, in the MCLR and the lending rates on fresh rupee loans (provided the spread over the MCLR remains relatively stable). Thus, the impact of introduction of external benchmark-based pricing of loans on monetary transmission has encompassed even sectors that are not linked to external benchmark loan pricing. 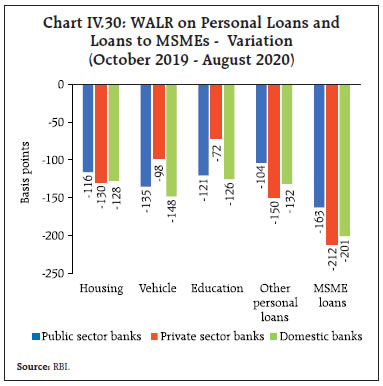 In respect of fresh rupee loans linked to the policy repo rate, the median spread charged by domestic banks was the highest in the case of other personal loans, followed by that for the MSME sector, whereas housing loans have the lowest spread. Among the bank groups, the median spread charged by public sector banks for different categories of loans was lower than those of private sector banks (Table IV.4). Administered interest rates on small savings are linked to market yields on G-secs with a lag and are fixed on a quarterly basis at a spread of 0-100 bps over and above G-sec yields of comparable maturities. | Table IV.4: Loans linked to External Benchmark – Median Spread over Policy Repo Rate (August 2020) | | (Percentage points) | | | Personal Loans | MSME Loans | | Housing | Vehicle | Education | Other Personal Loans | | Public Sector Banks (12) | 3.4 | 4.7 | 4.5 | 6.6 | 5.7 | | Private Sector Banks (20) | 5.8 | 7.0 | 7.2 | 6.8 | 7.2 | | Domestic Banks (32) | 4.4 | 5.1 | 5.2 | 6.6 | 6.4 | | Source: RBI. | After lowering these rates sharply during Q1:2020- 21, small saving interest rates were left unchanged for Q2:2020-21 and Q3:2020-21 notwithstanding the decline in G-sec yields during the reference period, resulting in a wedge of 40-120 bps in Q2 and 83-203 bps in Q3 in respect of various small savings instruments relative to the formula-based rates, with implications for monetary transmission (Table IV.5). IV.3 Liquidity Conditions and the Operating Procedure of Monetary Policy The RBI Act 1934 requires the RBI to place the operating procedure relating to the implementation of monetary policy and changes thereto from time to time, if any, in the public domain. During H1:2020-21, liquidity management operations by the RBI were conducted as per the revised liquidity management framework introduced on February 14, 2020 and guided by the need to expand liquidity in the system sizeably to ensure that financial markets and institutions function normally in the face of COVID-related dislocations, consistent with the monetary policy stance (see Chapter III of Annual Report 2019-20 for details).10 | Table IV.5: Interest Rates on Small Savings Instruments - Q3:2020-21 | | Small Savings Scheme | Maturity (years) | Spread (Percentage point) $ | Average G-sec Yield (%) of Corresponding Maturity (June - August 2020) | Formula based Rate of Interest (%) (applicable for Q3:2020-21) | Government Announced Rate of Interest (%) in Q3:2020-21 | Difference (basis points) | | (1) | (2) | (3) | (4) | (5) = (3) + (4) | (6) | (7) = (6) - (5) | | Savings Deposit | - | - | - | - | 4.00 | - | | Public Provident Fund | 15 | 0.25 | 6.02 | 6.27 | 7.10 | 83 | | Term Deposits | | | | | | | | 1 Year | 1 | 0 | 3.47 | 3.47 | 5.50 | 203 | | 2 Year | 2 | 0 | 3.92 | 3.92 | 5.50 | 158 | | 3 Year | 3 | 0 | 4.38 | 4.38 | 5.50 | 112 | | 5 Year | 5 | 0.25 | 5.29 | 5.54 | 6.70 | 116 | | Recurring Deposit Account | 5 | 0 | 4.38 | 4.38 | 5.80 | 142 | | Monthly Income Scheme | 5 | 0.25 | 5.27 | 5.52 | 6.60 | 108 | | Kisan Vikas Patra | 124 Months | 0 | 6.02 | 6.02 | 6.90 | 88 | | NSC VIII issue | 5 | 0.25 | 5.40 | 5.65 | 6.80 | 115 | | Senior Citizens Saving Scheme | 5 | 1.00 | 5.29 | 6.29 | 7.40 | 111 | | Sukanya Samriddhi Account Scheme | 21 | 0.75 | 6.02 | 6.77 | 7.60 | 83 | $: Spreads for fixing small saving rates as per Government of India Press Release of February 2016.
Note: Compounding frequency varies across instruments.
Sources: Government of India; and RBI staff estimates. | In view of the COVID-19 pandemic and its adverse impact on real economic activity, the Reserve Bank reduced the policy repo rate by 40 bps on May 22, 2020 on top of a 75 bps reduction on March 27. In order to make it relatively unattractive for banks to passively park funds with the Reserve Bank and to encourage their deployment for on-lending to productive sectors of the economy, the policy interest rate corridor was widened to 90 bps through a reduction of 25 bps in the reverse repo rate on April 17, 2020. Liquidity augmenting measures initiated since February 2020 were further reinforced during H1:2020-21, including those targeted at specific sectors and entities to alleviate liquidity and funding stress (Box IV.2). Box IV.2: Measures Augmenting Liquidity and Fostering Orderly Market Conditions (i) Auctions of long term repo operations (LTRO) during February-March 2020 for one-year and three-year tenors to facilitate monetary transmission and augment credit flows to productive sectors. (ii) Scheduled commercial banks were allowed exemption on incremental credit disbursed by them between January 31-July 31, 2020 on retail loans for automobiles, residential housing and loans to MSMEs from the maintenance of cash reserve ratio (CRR), with a view to revitalise the flow of bank credit to productive sectors having multiplier effects on growth. (iii) Two 6-month US dollar/INR sell/buy swap auctions were conducted on March 16 and March 23, 2020 cumulatively providing dollar liquidity amounting to US$ 2.7 billion. (iv) Fine-tuning variable rate repo auctions were conducted during March 2020 to provide flexibility to the banking system in its liquidity management towards the year end. As a special case, standalone primary dealers (SPDs) were allowed to participate in these auctions along with other eligible participants. (v) To facilitate year-end liquidity management of SPDs, liquidity available to them under the Standing Liquidity Facility (SLF) was temporarily enhanced from ₹2,800 crore to ₹10,000 crore on March 24, 2020. The facility was available till April 17, 2020. (vi) The CRR requirement of banks was reduced by 100 bps – from 4.0 per cent of net demand and time liabilities (NDTL) to 3.0 per cent of NDTL on March 27, 2020 – effective fortnight beginning March 28, 2020, for a period of one year ending March 26, 2021, augmenting primary liquidity in the banking system by about ₹1.37 lakh crore. (vii) Taking cognisance of hardships faced by banks in terms of social distancing of staff and consequent strains on reporting requirements, the requirement of minimum maintenance of daily CRR balance was reduced from 90 per cent to 80 per cent effective from the fortnight beginning March 28, 2020. This dispensation was available up to September 25, 2020. (viii) Banks’ limit for borrowing overnight under the marginal standing facility (MSF) by dipping into their statutory liquidity ratio (SLR) was raised to 3 per cent of NDTL from 2 per cent – effective up to March 31, 2021 – allowing them to avail additional liquidity under the LAF window at the reduced MSF rate. (ix) Targeted long-term repo operations (TLTROs) of up to three years tenor at a floating rate linked to the policy repo rate for deployment in investment grade corporate bonds, commercial paper, and non-convertible debentures over and above the outstanding level of investments in these bonds as on March 27, 2020. (x) Targeted long-term repo operations (TLTRO) 2.0 auctions in tranches of appropriate sizes, with at least 50 per cent of the total amount availed going to small and mid-sized non-banking financial companies (NBFCs) and micro finance institutions (MFIs). (xi) Special refinance facilities for a total amount of ₹75,000 crore at the policy repo rate to the National Bank for Agriculture and Rural Development (NABARD), the Small Industries Development Bank of India (SIDBI), the National Housing Bank (NHB) and the Export-Import Bank of India (EXIM Bank) to meet sectoral credit needs. (xii) Special liquidity facility for mutual funds (SLF-MF) to alleviate intensified liquidity pressures from redemption burdens faced by MFs. (xiii) As part of the Atmanirbhar Bharat package announced by GoI in May, a scheme was introduced through a Special Purpose Vehicle (SPV) to improve the liquidity position of NBFCs including MFIs and housing finance companies (HFCs) registered with the Reserve Bank for avoiding any potential systemic risks to the financial sector. (xiv) Term repo operations at floating rates (i.e., at the prevailing repo rate) in September to assuage liquidity pressures on account of advance tax outflows. Banks that had availed of funds under LTROs (at 5.15 per cent) were allowed to reverse these transactions before maturity and avail fresh funds at 4 per cent (current repo rate). (xv) From September 1, 2020, banks were allowed to hold fresh acquisitions of SLR securities under held to maturity (HTM) category up to an overall limit of 22 per cent (increased from 19.5 per cent) of NDTL up to March 31, 2021. (xvi) Purchases of government securities under OMOs of ₹1.91 lakh crore since February 6 and up to September 30, 2020. (xvii) In order to distribute liquidity more evenly across the yield curve and improve transmission, six ‘operation twist’ auctions were conducted in H1:2020-21 (on April 27, July 2, August 27, September 3, 10 and 17) for ₹10,000 crore each.11 | Overall, total liquidity support announced by the Reserve Bank since February 6 (up to September 30, 2020) amounted to ₹11.1 lakh crore (5.5 per cent of GDP) (Table IV.6). Table IV.6: Monetary and Liquidity Measures since February 6
(up to September 30, 2020) | | (₹ crore) | | Measures | Announcement | | LTRO | 2,00,000 | | Variable rate repo | 1,75,000 | | SLF for PDs | 7,200 | | CRR cut | 1,37,000 | | MSF (dip by 1% in SLR) | 1,37,000 | | TLTRO | 1,00,000 | | TLTRO (2.0) | 50,000 | | Net OMO purchases | 50,000 | | Special liquidity facility for mutual funds | 50,000 | | Refinance to NABARD,SIDBI,NHB and EXIM bank | 75,000 | | Special liquidity scheme for NBFCs | 30,000 | | 56-day term repo | 1,00,000 | | Total | 11,11,200 | | As proportion of GDP* (Per cent) | 5.5 | *: Nominal GDP 2019-20.
Source: RBI. | Drivers and Management of Liquidity During H1:2020-21, the key drivers of systemic liquidity were currency in circulation (CiC), net forex operations by the Reserve Bank and Government of India (GoI) cash balances. The large expansion in CiC was the major source of leakage, particularly during Q1. Liquidity was augmented by a large drawdown of excess CRR balances by commercial banks consequent to the one percentage point reduction of CRR. While the steady build-up of GoI cash balances in Q2 moderated the level of surplus, the Reserve Bank’s forex purchase operations augmented systemic liquidity throughout H1 (Chart IV.31a). In terms of liquidity management, durable liquidity was injected through TLTROs and OMO purchases (mainly in Q1), while transient liquidity movements were managed through LAF operations (Chart IV.31b). CiC growth (y-o-y) of ₹2.36 lakh crore (9.6 per cent) during H1:2020-21 significantly outpaced the expansion of ₹49,378 crore (2.3 per cent) in H1:2019-20 (Chart IV.32). The large scale of CiC expansion indicates heightened precautionary demand for cash in a pandemic-stricken environment. 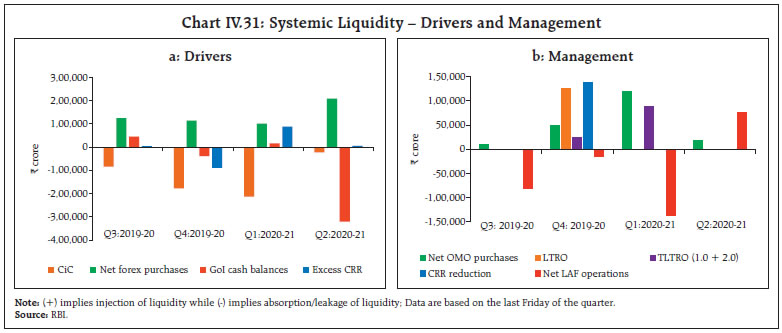
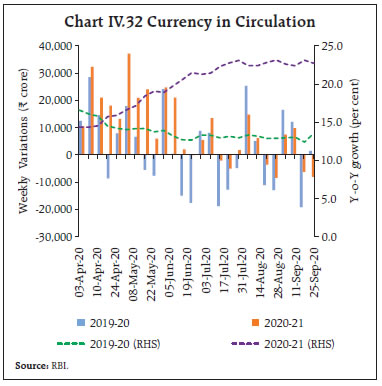 Fuelled by the infusion of ₹87,891 crore through four TLTRO auctions in April, systemic liquidity remained in abundance with average daily net absorptions under the LAF progressively increasing from ₹3.02 lakh crore in March to ₹4.75 lakh crore in April and further to ₹5.31 lakh crore in May 2020, notwithstanding large liquidity withdrawal from the banking system due to CiC expansion (Chart IV.33). Sustained government spending through higher recourse to WMA/OD (average of ₹1.01 lakh crore and ₹1.14 lakh crore in April and May, respectively) also added to the liquidity surplus. With the onset of the monsoon season, government spending decelerated and GoI cash balances turned into surplus in June (average of ₹34,838 crore); consequently, average daily net absorptions under the LAF moderated to ₹4.08 lakh crore. Overall, net average absorption of surplus liquidity at ₹4.71 lakh crore in Q1:2020-21 was the highest since January-March 2017 – the quarter immediately following demonetisation. 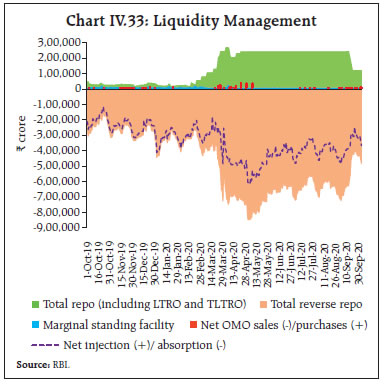 Surplus liquidity conditions persisted in Q2, although with some moderation relative to Q1. Large liquidity injection through the Reserve Bank’s net forex purchase operations in July was offset by moderate CiC expansion and gradual build-up of GoI cash balances as government spending remained subdued. Daily net absorptions under the LAF averaged ₹3.95 lakh crore in July as average GoI cash surplus increased to ₹95,938 crore. Thereafter, daily net absorptions increased to ₹4.03 lakh crore in August but moderated to ₹3.68 lakh crore in September due to higher GoI cash surplus (average of ₹1.68 lakh crore in August and ₹2.80 lakh crore in September). The RBI also injected liquidity through OMO purchases, particularly during Q1:2020-21. Total injection of durable liquidity (including forex purchases, OMOs and TLTRO) in H1:2020-21 amounted to ₹5.38 lakh crore as compared to ₹5.86 lakh crore in H2:2019-20 (Chart IV.34). Summing up, systemic liquidity surplus increased during H1:2020-21 reflecting the conventional and unconventional measures by the Reserve Bank to ensure conducive financial conditions and stability in financial markets and institutions. The extent of the surplus is gauged from the large amounts absorbed under the reverse repo facility, which peaked at more than ₹8.5 lakh crore on May 5, 2020 (Chart IV.35).
IV.4 Conclusion Domestic financial markets have gradually regained normalcy in the wake of sizable conventional and unconventional measures by the Reserve Bank. Turnover in various market segments is increasing and spreads have narrowed appreciably. The return of capital inflows is an indicator of growing investor confidence in the Indian economy. The pace of monetary transmission has also quickened, but credit growth remains feeble, clouding the outlook. Going forward, liquidity conditions would continue to be calibrated, consistent with the stance of monetary policy while ensuring normalcy in the functioning of financial markets and institutions and conducive financial conditions. Efficient monetary policy transmission, particularly to the credit market, would continue to assume priority in the hierarchy of policy objectives. _______________________________________________________________
V. External Environment The global economy is still reeling under the impact of the unprecedented shock caused by COVID-19. Even as high frequency indicators suggest that the economic activity may have begun to bottom out in Q3, the near-term outlook remains hostage to the virus and the attendant uncertainty regarding its vaccine. Inflation has remained largely subdued and below central banks’ target for advanced economies (AEs) as also for some emerging market economies (EMEs). Monetary policy remained highly accommodative with key policy rates reduced to their lowest level in most countries. Global financial markets remained buoyant, supported by signals that the highly accommodative monetary policy would continue for long. The pandemic has plunged the global economy into its deepest contraction in history in Q2:2020. World merchandise trade volume contracted by 14.3 per cent (q-o-q) in Q2. Just as various economies were engaging in unlocking activity, and a general sense emerging of the global economy stabilising and getting poised for a recovery in Q3, fresh waves of infections have surged, threatening these positive impulses. Meanwhile, commodity prices have firmed up, pushing up inflation. Although headline and core inflation remain subdued and below target in several economies, food price pressures are firming up. Global spillovers have accentuated, mainly through financial channels. Although financial markets have recovered from the panic sell-offs in Q1:2020 and capital flows to EMEs have resumed on the return of risk sentiment, asset prices are volatile, out of alignment with underlying fundamentals, and the outlook is uncertain. Monetary policy guidance from systemic central banks has led to weakening of the US dollar with corresponding appreciation in other currencies, especially EME currencies, with implications for export performance and growth. In addition, disruptions in global value chains (GVCs) have amplified supply shocks inflicted by the pandemic. Some near-term indicators have improved. Global purchasing managers’ index (PMI) indicates that on a month-on-month basis, the output and new orders as also business sentiments have revived since July and new export orders returned to growth in September. The recovery, however, is nascent and hinges on the duration of the pandemic and discovery of the vaccine. Underlying the stabilisation of financial markets, the easing of financial conditions and the hesitant recovery is the unprecedented policy response of monetary and fiscal authorities. These actions have led to a renewal of risk appetite and search for yields, slowing the precautionary flight to cash. Notwithstanding this defence, the outlook is highly uncertain, policy space is largely used up and the virulence of the pandemic is yet to abate for recovery to gain traction. V.1 Global Economic Conditions In the US, GDP growth contracted by a record 31.4 per cent [q-o-q, seasonally adjusted annualised rate (SAAR)] in Q2:2020, marking the worst plunge since the present GDP series began in 1947. Coming on the heels of a 5.0 per cent contraction in Q1:2020, the US economy was pushed into a technical recession (Table V.1). Most US states imposed complete shutdowns in April and for most part of May with only gradual and uneven reopening and relaxation in preventive measures towards the end of the quarter. While the unemployment rate has declined markedly from an all-time high in April, it remains much above the pre-COVID level. Industrial output continued to contract through August, though the momentum appears to be picking up as reflected in robust growth in retail sales since end of Q2. The manufacturing PMI moved back into expansion zone from June. The recent resurgence of COVID-19 cases has increased downside risks as many states hold off or reverse unlocking. | Table V.1: Real GDP Growth | | (Per cent) | | Country | Q2-2019 | Q3-2019 | Q4-2019 | Q1-2020 | Q2-2020 | 2020 (P) | 2021 (P) | | Quarter-over-quarter (q-o-q) seasonally adjusted, annualised rate | | Canada | 3.4 | 1.1 | 0.6 | -8.2 | -38.7 | -8.4 | 4.9 | | Euro area | 0.5 | 1.3 | 0.2 | -14.1 | -39.4 | -10.2 | 6.0 | | Japan | 1.6 | 0.2 | -7.0 | -2.3 | -28.1 | -5.8 | 2.4 | | South Korea | 4.1 | 1.5 | 5.4 | -5.0 | -12.0 | -2.1 | 3.0 | | UK | -0.1 | 1.3 | 0.6 | -9.7 | -58.7 | -10.2 | 6.3 | | US | 1.5 | 2.6 | 2.4 | -5.0 | -31.4 | -8.0 | 4.5 | | Year-on-year (y-o-y) | | Advanced Economies | | Canada | 2.0 | 1.6 | 1.5 | -0.9 | -13.0 | -8.4 | 4.9 | | Euro area | 1.2 | 1.4 | 1.0 | -3.2 | -14.7 | -10.2 | 6.0 | | Japan | 0.9 | 1.7 | -0.7 | -1.8 | -9.9 | -5.8 | 2.4 | | South Korea | 2.1 | 2.0 | 2.3 | 1.4 | -2.7 | -2.1 | 3.0 | | UK | 1.3 | 1.0 | 1.0 | -2.1 | -21.5 | -10.2 | 6.3 | | US | 2.0 | 2.1 | 2.3 | 0.3 | -9.0 | -8.0 | 4.5 | | Emerging Market Economies | | Brazil | 1.1 | 1.2 | 1.7 | -0.3 | -11.4 | -9.1 | 3.6 | | China | 6.2 | 6.0 | 6.0 | -6.8 | 3.2 | 1.0 | 8.2 | | India | 5.2 | 4.4 | 4.1 | 3.1 | -23.9 | -4.5 | 6.0 | | Indonesia | 5.1 | 5.0 | 5.0 | 3.0 | -5.3 | -0.3 | 6.1 | | Philippines | 5.5 | 6.0 | 6.7 | -0.7 | -16.5 | -3.6 | 6.8 | | Russia | 1.1 | 1.5 | 2.1 | 1.6 | -8.0 | -6.6 | 4.1 | | South Africa | 0.9 | 0.1 | -0.5 | 0.1 | -17.1 | -8.0 | 3.5 | | Thailand | 2.4 | 2.6 | 1.5 | -2.0 | -12.2 | -7.7 | 5.0 | | Memo: | 2019 (E) | 2020 (P) | 2021 (P) | | World Output | 2.9 | -4.9 | 5.4 | | World Trade Volume | 0.9 | -11.9 | 8.0 | E: Estimate P: Projection q-o-q: quarter-over-quarter y-o-y: year-on-year
Note: India's data correspond to fiscal year (April-March).
Sources: Bloomberg; and International Monetary Fund. | Economic activity in the Euro area plunged at a record pace in Q2 as frozen business and household activity caused by stringent lockdowns and social distancing measures inflicted an unprecedented blow to all constituent economies. GDP of the Euro area contracted by 39.4 per cent (q-o-q, SAAR) in Q2 – the sharpest since the series began in 1995 – following a contraction of 14.1 per cent in Q1. Industrial production and retail sales collapsed, while employment situation and consumer sentiments worsened in April-May as most member countries adopted extensive and prolonged lockdown measures to fight the health crisis. With retail sales improving in June and the composite PMI moving back into the expansion zone in July, the Euro economy exhibited signs of recovery in the early part of Q3. However, the momentum has slowed down as increase in fresh wave of infections prompted some countries in the region to reinstate restrictions. The Japanese economy contracted by 28.1 per cent (q-o-q, SAAR) per cent in Q2, marking the third straight quarter of contraction and the steepest on record, as private consumption and industrial production slumped, while public spending and business fixed investment declined sharply following the nation-wide state of emergency. Furthermore, plummeting exports on disrupted supply chains and weak external demand led to further deterioration in economic conditions. While gradual reopening, both domestically and abroad, has eased demand and supply conditions and helped stabilise manufacturing activity, available high frequency indicators remained in contraction zone through August. The UK economy fell into a technical recession in Q2 as prolonged confinement measures weighed heavily on economic activity. While the economy rebounded in June as gradual withdrawal of restrictions released pent-up demand, it was not strong enough to offset the magnitude of economic slack that the country experienced during the period of complete shutdown. The recovery continued into Q3 as both manufacturing and services PMI strengthened since July on robust output and new orders, reflecting improved consumer and business spending. The unemployment rate, however, remains high and investment intentions have remained weak. In September, some lockdown measures were re-imposed as a second wave of infections hit the UK. The Chinese economy bounced back in Q2 with GDP growing at 3.2 per cent (on y-o-y basis) as against a record contraction of 6.8 per cent in Q1. The turnaround was spearheaded by rising investment in infrastructure, supported by government spending, and increase in exports of medical products and electronics. The uptrend continued into Q3 as exports improved further since July amidst a modest improvement in external demand, and industrial production remained stable despite heavy floods experienced in some parts of the country. Manufacturing activity as measured by the manufacturing PMI recorded expansion in each month since May, supported by rising output and new orders. On the other hand, retail sales remain weak on depressed private consumption under social distancing measures. While the Chinese economy is expected to maintain the pace of its recovery, the prolonged global downturn, re-escalating tensions with the US and persistent risk of a second wave of COVID-19 infections remain major headwinds, going forward. Among other BRICS countries, economic activity plunged markedly in Q2. Brazil, India and Russia are among the top five COVID-19 infected countries in the world. Key macroeconomic indicators among BRICS nations suggest that macroeconomic performance in 2020 could worsen further (Table V.2). | Table V.2: Select Macroeconomic Indicators for BRICS | | | Country | 2013 | 2019 | 2020(P) | | Country | 2013 | 2019 | 2020(P) | | Real GDP growth rate (per cent) | Brazil | 3.0 | 1.1 | -9.1 | General Govt. gross debt (as per cent of GDP) | Brazil# | 60.2 | 89.5 | 102.3 | | Russia | 1.8 | 1.3 | -6.6 | Russia | 13.1 | 13.9 | 18.5 | | India | 6.4 | 4.2 | -4.5 | India | 67.4 | 72.2 | 84.0 | | China | 7.8 | 6.1 | 1.0 | China | 37.0 | 52.0 | 64.1 | | South Africa | 2.5 | 0.2 | -8.0 | South Africa | 44.1 | 62.2 | 79.9 | | Inflation rate (per cent) | Brazil | 6.2 | 3.7 | 3.6 | CAB as per cent of GDP | Brazil | -3.2 | -2.7 | -1.8 | | Russia | 6.8 | 4.5 | 3.1 | Russia | 1.5 | 3.8 | 0.7 | | India | 9.4 | 4.5 | 3.3 | India | -1.7 | -1.1 | -0.6 | | China | 2.6 | 2.9 | 3.0 | China | 1.5 | 1.0 | 0.5 | | South Africa | 5.8 | 4.1 | 2.4 | South Africa | -5.8 | -3.0 | 0.2 | | General Govt. net lending/borrowing (as per cent of GDP) | Brazil | -3.0 | -6.0 | -9.3 | Forex reserves* (in US$ billion) | Brazil | 358.8 | 356.9 | 356.5 | | Russia | -1.2 | 1.9 | -4.8 | Russia | 510.1 | 554.4 | 594.5 | | India | -7.0 | -7.4 | -7.4 | India | 294.8 | 461.8 | 545.5 | | China | -0.8 | -6.4 | -11.2 | China | - | 3388.7 | 3464.2 | | South Africa | -4.3 | -6.3 | -13.3 | South Africa | 49.6 | 55.1 | 55.7 | P: Projection
*: Data on forex reserves for 2020 pertains to the forex reserves holding as of August 2020 for all countries except for China whose data was avaialble till July 2020.
#: Gross debt refers to the non-financial public sector, excluding Eletrobras and Petrobras, and includes sovereign debt held by the central bank.
Notes: India's data correspond to fiscal year (April-March). Data for India are IMF's projections.
Sources: WEO, IMF; and IRFCL, IMF. | The Russian economy shrank in Q2, birched by the pandemic induced lockdowns and sharp fall in oil prices. All sectors, barring agriculture, were severely impacted amidst stringent measures adopted to stem the pandemic. Industrial production and retail sales contracted through August on muted business and consumer confidence, while the unemployment rate has risen. The Brazilian economy entered into a technical recession in Q2, following sharp declines in household consumption, industrial and services sector activity. The growth outlook remains clouded as external demand is expected to remain weak, while domestic spending and industrial activity are likely to stay subdued with social distancing measures in place. The South African economy experienced a severe disruption in Q2, the steepest on record, as industrial production and retail sales plummeted to record low levels in April and remained in contraction through the entire quarter. South-East Asian countries also registered sharp contraction in Q2, in tandem with other major EMEs and AEs as economic activity came to near standstill following widespread lockdowns. The global composite PMI moved back to the expansion zone in July and improved further in August and September after remaining in contraction for five months and a record low level in April. The revival in output and new orders as also improved business optimism, led the recovery (Chart V.1a). Among OECD economies, composite leading indicators (CLIs) suggest firming up of the growth momentum across major AEs and EMEs since June, recovering from lows in April. Notwithstanding the recovery, the levels still remain below the long-term trend and much lower than the pre-COVID levels (Chart V.1b). 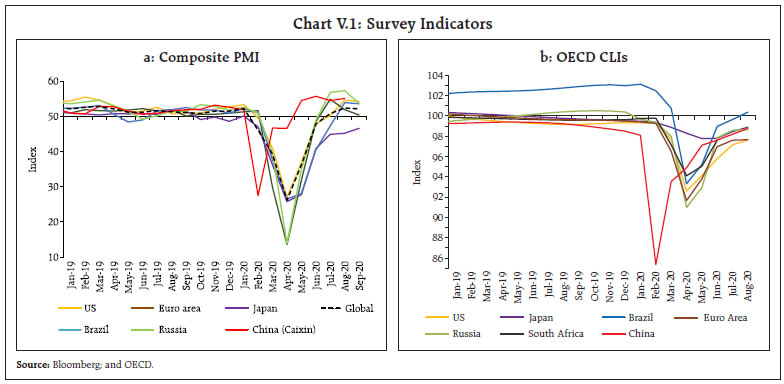 Global trade which was sluggish prior to the outbreak of COVID-19, moved into deep contraction in Q2:2020, with AEs contributing more to the decline than EME peers (Chart V.2a). The WTO’s Goods Trade Barometer posted a steep decline – its constituent indices pertaining to automotive products and air freight contracted, although components such as export orders witnessed incipient signs of recovery, and contraction eased in electronic components and raw materials. 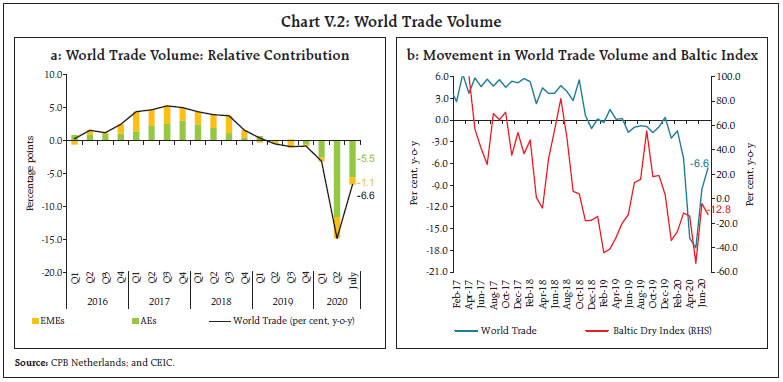 Forward looking indicators also suggest a tentative nascent recovery in world trade. The Baltic Dry Index, that had declined sharply during H2:2019 and Q1:2020, recovered sharply in June but has since softened moderately (Chart V.2b). However, uncertainty over a possible recovery remains a cause of concern due to rise in fresh virus cases in some parts of Europe, along with the rapid spread in major EMEs. The pandemic has also exposed the integrated global economy to significant supply chain disruptions reconfiguring the global value chains (Box V.1). Box V.1: Global Value Chains: Regaining Foothold After the 1990s, international trade proliferated on the back of the rise of global value chains (GVCs) which contributed to increase in productivity and came to be viewed as a fast track to industrialisation for the emerging market economies (Baldwin, 2011; Ignatenko et al., 2019). After the global financial crisis, however, GVCs slowed down with the confluence of protectionist trade policies. More recently, COVID-19 has accentuated the contraction in global trade volumes with major supply disruptions – around 80 countries have imposed export restrictions and prohibitions on medical supplies and pharmaceuticals (WTO, 2020). A survey of 23 industry value chains conducted by Mckinsey Global Institute (2020) revealed that the semiconductor industry, followed by communication equipment, medical devices, pharmaceuticals, aerospace, automobile, machinery and chemical industry would be the most affected by trade-related disruptions (Chart V.1.1a). The apparel industry followed by aerospace, furniture and petroleum products, transport, automobile and textile would be exposed to higher risks during the pandemic (Chart V.1.1b). The survey estimates that potential restructuring in global value chains could shift 16 to 26 per cent (US$ 2.9 trillion to US$ 4.6 trillion) of global goods exports to new countries in the next five years. It identifies three sectors, viz., pharmaceuticals, petroleum and apparel where the shift in supply chain networks might happen (McKinsey Global Institute, 2020). The extent to which a country is integrated into these supply chains can be measured by the GVC participation index, which is a sum of backward and forward linkages. With the pandemic expected to diversify the supply chains from the current manufacturing hub, beneficiaries could be countries such as Vietnam, Mexico and India. The determinants of GVC participation such as economic fundamentals, factor endowments, geography, market size and institutional environment can be examined in an empirical framework (Fernandes et al., 2020) specified as follows: 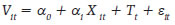
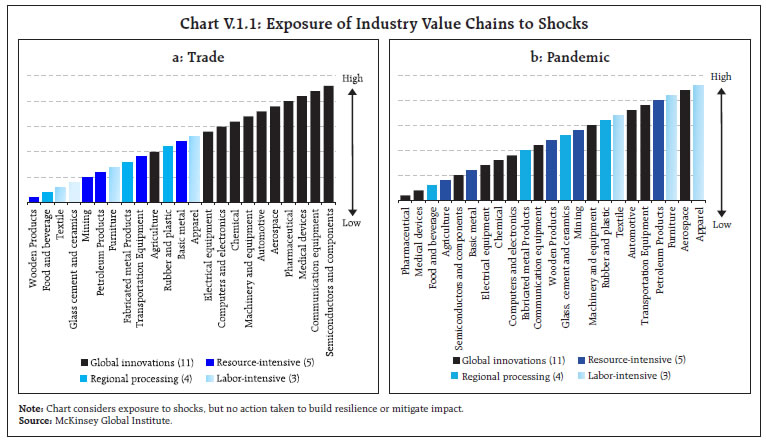 where the dependent variable (V) is either backward or forward participation expressed in logarithmic terms and subscripts i and t represent country and time period, respectively. X represents a vector of trade policy related explanatory variables viz., net foreign direct investment (FDI) inflows; weighted average tariff rates; resource endowments, viz., ratio of capital to GDP, ratio of land to GDP and rents from resources; domestic industrial capacity measured in terms of manufacturing sector’s value-added; logistic performance index; political stability and distance from GVC hub e.g., the US, Germany and China. Variable Tt controls for time fixed effects. The model is estimated on 144 countries for the period 1990- 2018 using UNCTAD (Eora database). The decomposition of backward participation reveals that better logistic performance, higher capital endowment, stable political environment and higher FDI are central to strengthening backward linkages in the supply chain. These results assume significance in the context of several initiatives to strengthen logistic infrastructure through national trade facilitation plan which aims to transform the trade ecosystem by reducing the time and cost of doing business. Consequently, relaxation in local procurement norms for single-brand retail trade has generated interest among global tech and retail giants such as Apple and Ikea. Manufacturing units in India may provide a unique opportunity to expand the country’s foothold in GVCs. Lower tariff rates and better connectivity with the GVC hub can also contribute to stronger backward linkages. However, the estimates also show that countries with a larger domestic industrial capacity exhibit lower backward participation as they may rely less on imported inputs and use more domestic inputs for exports (Chart V.1.2a). Countries with better performance in logistics, lower distance from the GVC hub and greater land and natural resource endowment exhibit significantly stronger forward participation than peers (Chart V.1.2b). As in the case of backward linkages, a country’s capital affects forward participation positively, though the effect is not statistically significant. Countries seeking to expand foothold in GVCs need to lower trade barriers, demonstrate higher reliance on regional or free trade agreements, provide cutting edge logistics infrastructure, increase industrial capacity and strengthen political stability. References: Baldwin, R. (2011), “Trade and Industrialisation after Globalisation’s 2nd Unbundling: How Building and Joining a Supply Chain are Different and Why It Matters”, NBER Working Paper 17716. Fernandes, A., H. L. Kee and D. Winkler (2020), “Determinants of Global Value Chain Participation: Cross- Country Evidence”, World Bank. Ignatenko, A., F. Raei and B. Mircheva (2019), “Global Value Chains: What are the Benefits and Why Do Countries Participate?”, IMF Working Papers, WP/19/18. Mckinsey Global Institute (2020), Risk, Resilience and Rebalancing in Global Value Chains. World Trade Organization (2020), Export Prohibitions and Restrictions. | V.2 Commodity Prices and Inflation Global commodity prices fell sharply in March-April, with oil prices plunging to record lows as lockdowns across countries depressed demand. From May, however, prices recovered as demand prospects improved following the gradual withdrawal of lockdown restrictions. The Bloomberg commodity price index increased by 14.5 per cent between April and September. The food price index of the Food and Agriculture Organization (FAO) increased by 1.0 per cent between April and August. Global food prices eased since February before witnessing some uptick in June on the back of rising vegetable oil, dairy products and sugar prices. Excess stockpiles amidst weakening external demand, diminishing restaurant sales and reduced demand from food manufacturers resulting from COVID-19 restrictions, pulled down prices for most food products between February and May. However, since June, food prices have edged up as global import demand improved, while export supplies tightened due to weather shocks and production slowdown across major producing countries (Chart V.3a). 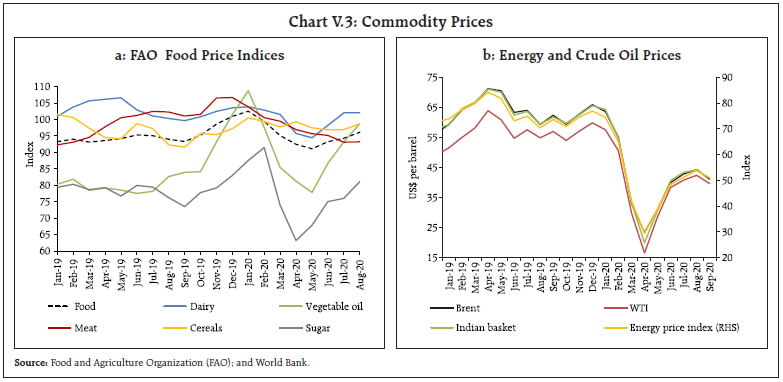 Crude oil prices plunged in March-April, with West Texas Intermediate (WTI) prices falling below zero to US$ (-)37.63 per barrel on April 20, 2020, as the unprecedented shock due to COVID-19 amidst the escalating Saudi-Russia price war over production cuts, flooded the oil market with excess supply. Crude oil prices have increased since then, recouping April losses, as optimism on demand following gradual withdrawal of lockdown in some countries and continued production cut by major energy producers buoyed sentiments. Major oil producers, both inside and outside the Organization of the Petroleum Exporting Countries (OPEC) planned to partially restore production from August following the cuts agreed to in the OPEC plus agreement of April, and this kept oil price range bound in July. Oil price firmed up for the larger part of August on news of falling inventories and recovery in fuel demand. However, the rally lost steam in September as fears of a second wave of COVID-19 infections, lack of visibility of the expected demand recovery and ramping up of production by some smaller OPEC members changed expectations again (Chart V.3b). Base metal prices, measured by the Bloomberg’s base metal spot index, increased by 27.5 per cent between April and September 2020 as against a decline of 19.3 per cent in Q1 and regained all the losses incurred after the outbreak of COVID-19. Most industrial metal prices have exhibited bullish movements since April-May, underpinned by China’s restocking due to its early recovery and the massive stimulus packages by global central banks. Gold prices remained elevated, increasing by almost 24.3 per cent on a year-to-date (YTD) basis (till September 30, 2020) as heightened uncertainties and highly accommodative policies of central banks continue to boost the safe haven appeal of the yellow metal, pushing prices above the US$ 2000 mark in early August. However, the bullion witnessed sell-offs in mid-August on Russia’s announcement of potential vaccine and profit booking by investors and have remained broadly range bound for larger part of September before falling by 3.3 per cent in last week on strong US dollar and flight to cash (Chart V.4). CPI inflation remained largely benign in major AEs, but exhibited modest upticks in some EMEs since June. Barring India, inflation remained at sub-target levels in most of the AEs and EMEs, reflecting subdued demand amid lockdowns (Table V.3). 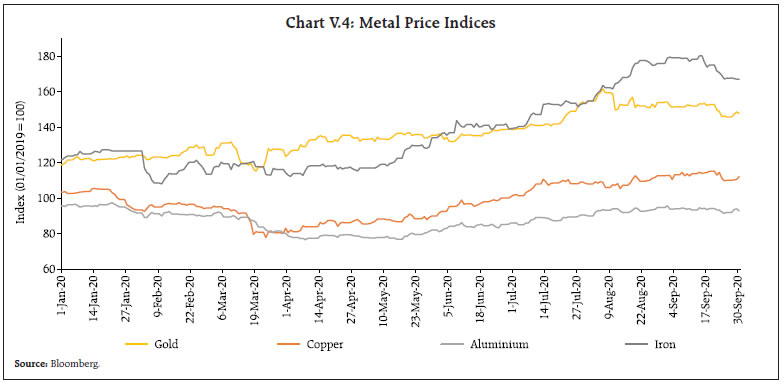 | Table V.3: Inflation Performance | | (Per cent) | | Country | Target | Q2-2019 | Q3-2019 | Q4-2019 | Q1-2020 | Q2-2020 | | Advanced Economies | | Canada | 2.0 | 2.1 | 1.9 | 2.1 | 1.8 | 0.0 | | Euro area | 2.0 | 1.4 | 0.9 | 1.0 | 1.1 | 0.2 | | Japan | 2.0 | 0.8 | 0.3 | 0.5 | 0.5 | 0.1 | | South Korea | 2.0 | 0.7 | 0.1 | 0.3 | 1.2 | -0.1 | | UK | 2.0 | 2.0 | 1.8 | 1.4 | 1.7 | 0.6 | | US | 2.0 | 1.5 | 1.5 | 1.5 | 1.7 | 0.6 | | Emerging Market Economies | | Brazil | 4.0 ± 1.5 | 4.3 | 3.2 | 3.4 | 3.8 | 2.1 | | Russia | 4.0 | 5.0 | 4.3 | 3.4 | 2.4 | 3.1 | | India | 4.0 ± 2.0 | 3.1 | 3.5 | 5.8 | 6.7 | 6.2 | | South Africa | 3.0-6.0 | 4.5 | 4.1 | 3.8 | 4.4 | 2.4 | | Indonesia | 3.0 ± 1.0 | 3.1 | 3.4 | 2.9 | 2.9 | 2.3 | | Philippines | 3.0 ± 1.0 | 3.0 | 1.7 | 1.5 | 2.7 | 2.3 | | Thailand | 1.0-3.0 | 1.1 | 0.6 | 0.4 | 0.4 | -2.7 | Notes: (1) The ECB aims at inflation rates of below, but close to, 2% over the medium term. The Federal Reserve in August 2020 adopted a new policy strategy of ‘average inflation targeting’ under which it would allow the inflation rate to go above the target of 2 per cent rate for brief periods to make up for the shortfall from the targets in earlier periods. Central Bank of Canada aims to keep inflation at the 2 per cent mid-point of an inflation control target range of 1-3 per cent.
(2) Brazil’s, Indonesia’s and Thailand’s inflation target for 2019 were 4.25 ± 1.5 per cent, 3.5 ± 1 per cent and 2.5 ± 1.5 per cent, respectively.
(3) Quarterly inflation numbers are monthly averages.
(4) India’s inflation is based on calendar year basis. Data for Q2:2020 refer to June only as NSO did not provide inflation rates for April and May.
Sources: Central Bank Websites; and Thomson Reuters. | In the US, inflation measured by the personal consumer expenditures (PCE) price index eased during February-June on the back of subdued aggregate demand and lower consumer energy prices. Although it has edged up since June, the pick up has been modest and drawing strength from the recovery in spending for consumer goods and services due to resumption of activities. Notwithstanding the increase, the PCE price index based inflation remained well below the Fed’s 2 per cent target. In the Euro area too, actual inflation remained much below the target as prices have edged down since March and inflation rate slipped below zero since August on falling prices of energy products and non-energy industrial goods. In Japan, CPI inflation remained subdued, despite a slight uptick in July, on weak core consumer prices and inflation expectations. In the UK, rising prices of recreation and culture activities led to an increase in CPI inflation in June-July; however, inflation edged down in August on easing meal prices led by the ‘Eat Out to Help Out’ scheme by the Government, falling air fares and clothing prices (Chart V.5a). CPI inflation across major EMEs eased during March-May on weak demand and depressed global crude oil prices, but has recorded modest increases since June. Nonetheless, it remained below pre-COVID-19 levels and even below central bank targets for some economies. In China, consumer price inflation edged up in June-July on higher food prices resulting from an increase in pork prices and supply disruptions caused by floods. However, it fell in August as supply disruptions eased, restoring demand-supply balance. In Brazil, CPI inflation has recorded modest gains since June on the back of rising prices for transportation, increasing housing prices and cost of health and personal care, but remains below the central bank’s target. CPI inflation in South Africa started picking up in June and moved back into the central bank’s target range of 3-6 per cent since July, primarily driven by high prices of food and beverages. CPI inflation in Russia, unlike its peers, has been increasing since March, with only a modest drop in May. Increasing food, non-food and services prices amidst supply disruptions and the gradual release in pent-up demand as also weak ruble, supported the uptrend. However, inflation remains below the central bank’s target of 4 per cent through September (Chart V.5b). 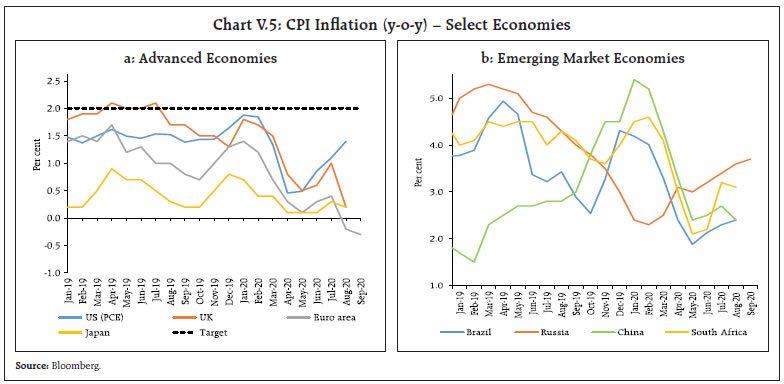 V.3 Monetary Policy Stance With the onset of the pandemic, fiscal authorities around the world have unveiled stimulus packages to overcome the downturn. Estimates as of mid-June 2020 by the IMF show more aggressive support by the AEs (Table V.4). Central banks have also provided unprecedented monetary accommodation. The key policy rates are at their lowest level in most countries. One important difference is that while the AE central banks used up the limited policy space available to them in March, the EMEs continued to cut rates through Q2 and Q3 of 2020. | Table V.4: Fiscal Support in Response to COVID-19 | | (Amount in US$ billion; Per cent as proportion of GDP) | | Country | Amount | Per cent | | Advanced Economies | - | 19.8 | | Canada | 137 | 8.9 | | European Union | 484 | 4.1 | | Japan | 1720 | 35.4 | | UK | 578 | 23.0 | | US | 2953 | 14.8 | | Emerging Market Economies | - | 5.1 | | Brazil | 157 | 11.9 | | China | 705 | 4.6 | | India | 180 | 6.1 | | Indonesia | 40 | 3.6 | | Russia | 40 | 2.9 | | South Africa | 26 | 9.6 | | Thailand | 61 | 11.8 | | Source: WEO Update, June 2020, IMF. | In August 2020, following a comprehensive and a public review of its monetary policy strategy, tools and communication practices, the Federal Reserve announced its new monetary policy strategy under which it seeks to achieve inflation that averages 2 per cent over time. As per this ‘flexible average inflation targeting’ paradigm, the Fed would allow the inflation rate to be moderately above the 2 per cent rate for brief periods to make up for the shortfall from the target in earlier periods. Furthermore, according primacy to maximum employment, the Fed would henceforth respond to ‘shortfalls’ of the employment from its maximum level rather than its ‘deviations’. As regards the actual conduct of monetary policy, the US Fed has maintained a pause on the target range of the policy rate in all Federal Open Market Committee (FOMC) meetings since the emergency rate cut in mid-March. In April 2020, the Fed announced the Main Street Lending Programme, a package of support for households and businesses, worth US$ 2.3 trillion. Since June, the Fed has indicated that it would continue asset purchases at the current pace over the coming months to sustain smooth market functioning. In its September meeting, the first after the adoption of the new monetary policy framework, the Fed stated that it would keep the target range for the federal funds rate at 0-0.25 per cent till labour conditions become consistent with the FOMC’s assessment of maximum employment and inflation has risen to 2 per cent and moderately exceeds it for some time. In Q3, the Fed increased the duration and made favourable changes to the scope as also pricing of several facilities announced in March/ April in response to COVID-19. Some facilities1 that were to expire in September have been extended up to December 2020, while the temporary US dollar liquidity swap lines and the temporary repurchase agreement facility for foreign and international monetary authorities (FIMA repo facility) have been extended up to March 2021. The European Central Bank (ECB) has not changed key rates in response to the pandemic so far. In its April 2020 meeting, the ECB eased conditions for accessing targeted longer-term refinancing operations (TLTRO III) and introduced a new series of non-targeted pandemic emergency longer-term refinancing operations (PELTROs) to support liquidity conditions in the euro area financial system. In its June meeting, the ECB expanded the envelope for the pandemic emergency purchase programme (PEPP) by €600 billion (about US$ 680 billion)2 to a total of €1,350 billion (about US$ 1,531 billion), while also extending the time horizon for net purchases under the programme to June 2021. There were no new announcements in the two meetings in Q3. The Bank of Japan (BoJ) has also not changed key rates in response to the pandemic. In April, the BoJ announced significant enhancement of monetary easing including removing the limit of 80 trillion yen (about US$ 746 billion) on additional annual holdings of government bonds. The limits on additional purchases of commercial papers and corporate bonds were enhanced. The BoJ also strengthened the Special Funds-Supplying Operations to facilitate financing in response to COVID-19. In May, it introduced a new measure under these operations for fund provisioning against interest-free and unsecured loans. The maximum amount of financing under the Special Funds Supplying Operations is about 100 trillion yen (about US$ 933 billion). The Bank of England (BoE) has maintained a pause on the Bank Rate, which is at its all-time low of 0.1 per cent since March 2020. In its June meeting, however, the BoE increased the target stock of purchase of UK government bonds by an additional £100 billion (about US$ 124 billion), taking the stock of total asset purchases to £745 billion (about US$ 926 billion) for 2020. There were no new announcements in its meetings held in Q3. The Bank of Canada (BoC) has maintained a pause on the policy rate at 0.25 per cent since March. In April, the BoC announced new measures for provincial bond and corporate bond purchases, a temporary increase in weekly purchases of Treasury bills and enhancement of funding under term repo facility to two years. In June, with improvement in short-term funding conditions, the BoC reduced the frequency of term repo operations and its bankers’ acceptance purchase facility. The Reserve Bank of Australia (RBA) maintained the targets for the cash rate and the yield on 3-year Australian Government bonds at 25 basis points each in its monthly meetings held during Q2 and Q3 of 2020. In September, the RBA announced an increase in the size of its term funding facility and extended it up to June 2021. The Reserve Bank of New Zealand (RBNZ) maintained its policy rate at its historic low of 0.25 per cent in each of its meetings since April. The RBNZ, however, increased the limit on its large scale asset purchase programme from NZ$ 30 billion (about US$ 17 billion) to NZ$ 33 billion (about US$ 20 billion) in April, to NZ$ 60 billion (about US$ 36 billion) in May and further to NZ$ 100 billion (about US$ 66 billion) in August.  The central banks of South Korea and Norway were the only two AE central banks to effect a rate cut beyond Q1:2020. Both reduced their policy rate by 25 bps each in May to 0.5 per cent and 0 per cent, respectively (Chart V.6a). The Swedish Riksbank maintained its policy rate at 0 per cent, but in its June meeting it increased the amount of asset purchases from SEK 300 billion (about US$ 30 billion) to SEK 500 billion (about US$ 54 billion) and extended the time period of the purchases up to June 2021, while also announcing purchase of corporate bonds from September onwards. EMEs, on the other hand, continued to cut rates well into Q3. The People’s Bank of China (PBoC) effected a 20 bps cut in the one-year Loan Prime Rate (LPR) to 3.85 per cent in April and has maintained a pause since. Prior to the policy decision in April, the PBoC had reduced the interest rate on excess reserves to a record low of 0.35 per cent, while also reducing the reserve requirement ratio for smaller banks by one per cent. In May, the PBoC lowered the reserve requirement rate for all large financial institutions by another 150 basis points to 11 per cent. Other BRICS central banks remained in accommodative mode. The central bank of Brazil reduced the Selic rate by 75 bps each in May and June, following it up with a 25 bps cut in August as inflation remained below the target. The central bank of Brazil took a pause in its September meeting, the first after nine consecutive rate cuts since August 2019. The Bank of Russia cut its policy rate by 50 bps, 100 bps and 25 bps in April, June and July, respectively before pausing in September. The South African Reserve Bank cut its policy rate by 100 bps, 50 bps and 25 bps in April, May and July, respectively, as overall risks to inflation outlook remained balanced and took a pause in September (Chart V.6b). The central bank of Turkey cut its policy rate by 100 bps in April and 50 bps in May and maintained a pause thereafter. In August, the central bank increased the Turkish Lira and forex reserve requirement ratios for banks fulfilling real credit growth conditions. In September, however, the central bank increased its policy rate by 200 bps to restore the disinflation process and support price stability. The central bank of Mexico cut its policy rate by 50 bps in each month of Q2:2020 and effected 50 bps cut in August and another 25 bps cut in September. Bank Indonesia cut its policy rate by 25 bps each in June and July and has maintained a pause since August. Amongst other major EME central banks, the Bank of Thailand and Bangko Sentral ng Pilipinas cut their rates in Q2 while Bank Negara Malaysia and the Central Bank of Sri Lanka reduced rates in both Q2 and Q3. V.4 Global Financial Markets Global financial markets went into a tailspin in March that continued up to March 23, 2020 when the US Federal Reserve announced extensive measures to support the economy, including removing the upper bound on its asset purchases. The announcements engendered a recovery in financial markets across the world. Aided by equally extensive and in some cases, co-ordinated monetary policy action by central banks, financing conditions have improved. Among AEs, the US equity market has continued to recover from the slide in March, with intermittent corrections. In July, equity indices moved higher on prospects of successful development of a vaccine and better than expected corporate performance. Towards the end of July, there was some correction due to resurgence of infections and increasing tensions with China, but the exceptional performance of the prime technology companies helped in overriding the pessimism. In August, the S&P 500 index closed at all-time highs on seven occasions. It peaked further in early September followed by correction, with shares of technology companies registering a large decrease. In the other major AEs, even as stock indices have been rising gradually, they are yet to recover year-to-date losses. In the Euro area, despite news on the finalisation of the Next Generation EU fund3, the stock market remained flat with differential pace of opening of multiple economies and localised resurgence of infections. The uptrend in the stock market in the UK was even more gradual, with the country registering the worst economic contraction among major AEs. The stalemate over Brexit negotiations has dampened sentiment on the outlook. Japanese stocks also slowly recovered from the slide in the earlier part of the year in Q2, and thereafter the index has almost stalled. In the second half of September, stock markets in the Euro area and UK corrected further with rising possibility of a second wave of infections and need for lockdown.  Stock markets in EMEs have seen rapid recovery, starting from Q2 (Chart V.7). Risk-on sentiments following massive monetary accommodation by central banks led to resumption of capital flows to EMEs, which have strengthened further in Q3. In September, however, stock markets in EMEs have also corrected on global cues. The flight to cash phase in bond yields ended on March 23, 2020. Thereafter, yields softened in AEs and remained range-bound in Q2, in part due to the unprecedented policy accommodation and continuing safe haven demand. There has been some hardening of yields in Q3 in the AEs, particularly in August, mainly on account of mixed news on the economic front (Chart V.8a). With renewed virus concerns, safe haven demand for US Treasuries has resurged. Yields in EMEs, on the other hand, have witnessed considerable softening since Q2:2020 after the rout in the earlier part of the year. This has been on the back of large monetary loosening, including bond purchase programmes undertaken by a few EME central banks. China has, on the contrary, seen a rise in yields after the pause following the 20 bps cut in policy rate in April. In currency markets, the US dollar has weakened considerably since March 23, 2020. Expectations of the policy rates staying low for a considerable time horizon, largest number of COVID-19 infections and fatalities in the world, grim employment news and tensions with China have imparted weakness to the US dollar (Chart V.8b). The euro has strengthened considerably against the dollar. With resumption of capital flows, most emerging market currencies have strengthened since Q2:2020. However, the US dollar strengthened in September on safe haven demand as waning vaccine optimism amidst rising infections in Europe and the UK and uncertainty regarding US stimulus package triggered risk-off sentiments. The MSCI Emerging Market Currency Index increased by 1.6 per cent in Q2:2020 and by a further 2.7 per cent in Q3:2020. V.5 Conclusion In sum, the global economy is still reeling under the impact of the unprecedented COVID-19 shock. Even as high frequency indicators suggest that the economic activity may be beginning to bottom out in Q3, the near-term outlook remains hostage to the virus and attendant uncertainty around the discovery of the vaccine. The slight uptick in inflation of some EMEs in recent months notwithstanding, risks to the recovery remain on the downside due to the sizeable aggregate demand compression effect and continued disruption of supply. As major central banks have pledged to keep rates at the current historic low levels and governments are implementing large fiscal support programmes, the improvement in financing conditions that is still unfolding should impart upside to the recovery when it takes hold. _______________________________________________________________
ABBREVIATIONS | ADB | Asian Development Bank | | AEs | Advanced Economies | | AR | Autoregressive | | ARCH | Autoregressive Conditional Heteroskedasticity | | BE | Budget Estimates | | BEI | Business Expectations Index | | BG | Breusch-Godfrey | | BIS | Bank for International Settlements | | BoC | Bank of Canada | | BoE | Bank of England | | BoJ | Bank of Japan | | bps | Basis Points | | BRICS | Brazil, Russia, India, China and South Africa | | BSE | Bombay Stock Exchange | | CAB | Current Account Balance | | CACP | Commission for Agricultural Costs and Prices | | CAG | Comptroller and Auditor General of India | | CCIL | Clearing Corporation of India Limited | | CD | Certificate of Deposit | | CDS | Credit Default Swap | | CI | Confidence Interval | | CiC | Currency in Circulation | | CII | Confederation of Indian Industry | | CIs | Coincident Indices | | CLI | Composite Leading Indicator | | COVID-19 | Coronavirus Disease 2019 | | CP | Commercial Paper | | CPI | Consumer Price Index | | CPI-AL | Consumer Price Index for Agricultural Labourers | | CPI-C | Consumer Price Index - Combined | | CPI-IW | Consumer Price Index for Industrial Workers | | CPI-RL | Consumer Price Index for Rural Labourers | | CRR | Cash Reserve Ratio | | CSF | Consolidated Sinking Fund | | CU | Capacity Utilisation | | CU (SA) | Capacity Utilisation (Seasonally Adjusted) | | DA | Dearness Allowance | | DAP | Di-Ammonium Phosphate | | DFM | Dynamic Factor Model | | DGCA | Directorate General of Civil Aviation | | DGCI&S | Directorate General of Commercial Intelligence and Statistics | | ECB | European Central Bank | | ECBs | External Commercial Borrowings | | EMEs | Emerging Market Economies | | EU | European Union | | EXIM | Export-Import Bank of India | | FAO | Food and Agriculture Organization | | FBIL | Financial Benchmarks India Pvt Ltd | | FDI | Foreign Direct Investment | | FICCI | Federation of Indian Chambers of Commerce and Industry | | FIMA | Foreign and International Monetary Authorities | | FIMMDA | Fixed Income Money Market and Derivatives Association of India | | FIs | Financial Institutions | | FMOLS | Fully Modified Ordinary Least Squares | | FOMC | Federal Open Market Committee | | FPI | Foreign Portfolio Investment | | FR | Full Reservoir Level | | FRE | First Revised Estimates | | F-TRAC | FIMMDA Trade Reporting and Confirmation System | | GDP | Gross Domestic Product | | GFCE | Government Final Consumption Expenditure | | GFCF | Gross Fixed Capital Formation | | GFD | Gross Fiscal Deficit | | GNDI | Gross National Disposable Income | | GoI | Government of India | | GSDP | Gross State Domestic Product | | G-Secs | Government Securities | | GST | Goods and Services Tax | | GVA | Gross Value Added | | GVC | Global Value Chain | | H1 | First Half of the Year (April-September) | | H2 | Second Half of the Year (October-March) | | HFCs | Housing Finance Companies | | HTM | Held to Maturity | | IEA | Index of Economic Activity | | IIP | Index of Industrial Production | | IMF | International Monetary Fund | | Ind-AS | Indian Accounting Standard | | INR | Indian Rupee | | IO | Input-output | | IOCL | Indian Oil Corporation Limited | | IRFCL | International Reserves and Foreign Currency Liquidity | | ISM | Institute for Supply Management | | IT | Information Technology | | LAF | Liquidity Adjustment Facility | | LM | Lagrange multiplier | | LPA | Long Period Average | | LPG | Liquefied Petroleum Gas | | LPR | Loan Prime Rate | | LTRO | Long Term Repo Operation | | MCLR | Marginal Cost of Funds Based Lending Rate | | MFI | Micro Finance Institution | | MF | Mutual Funds | | MGNREGA | Mahatma Gandhi National Rural Employment Guarantee Act | | MMRP | Modified Mixed Reference Period | | MOAFW | Ministry of Agriculture and Farmers Welfare | | m-o-m | Month-on-Month | | MoRTH | Ministry of Road Transport and Highways | | MPC | Monetary Policy Committee | | MPR | Monetary Policy Report | | MSCI | Morgan Stanley Capital International | | MSF | Marginal Standing Facility | | MSME | Micro, Small and Medium Enterprise | | MSP | Minimum Support Price | | NABARD | National Bank for Agriculture and Rural Development | | NBER | National Bureau of Economic Research | | NBFCs | Non-Banking Financial Companies | | NCAER | National Council of Applied Economic Research | | NDS | Negotiated Dealing System | | NDS-OM | Negotiated Dealing System-Order Matching | | NDTL | Net Demand and Time Liabilities | | NEER | Nominal Effective Exchange Rate | | NHB | National Housing Bank | | NIM | Net Interest Margin | | NIP | National Infrastructure Pipeline | | NPA | Non-Performing Asset | | NSC | National Savings Certificate | | NSDL | National Securities Depository Limited | | NSO | National Statistical Office | | NSSO | National Sample Survey Office | | OD | Overdraft | | OECD | Organization for Economic Cooperation and Development | | OMCs | Oil Marketing Companies | | OMO | Open Market Operation | | OPEC | Organization of the Petroleum Exporting Countries | | OTC | Over-the-Counter | | PADO | Public Administration, Defence and Other services | | PBoC | People’s Bank of China | | PCE | Personal Consumption Expenditure | | PDS | Public Distribution System | | PE | Provisional Estimates | | PELTRO | Pandemic Emergency Longer-Term Refinancing Operation | | PEPP | Pandemic Emergency Purchase Programme | | PFCE | Private Final Consumption Expenditure | | PM | Prime Minister | | PMI | Purchasing Managers’ Index | | POL | Petroleum, Oil and Lubricants | | PPAC | Petroleum Planning & Analysis Cell | | PSU | Public Sector Undertaking | | Q1 | First Quarter | | Q2 | Second Quarter | | Q3 | Third Quarter | | Q4 | Fourth Quarter | | q-o-q | Quarter-on-Quarter | | QPM | Quarterly Projection Model | | RBA | Reserve Bank of Australia | | RBI | Reserve Bank of India | | RBNZ | Reserve Bank of New Zealand | | RD | Revenue Deficit | | RE | Revised Estimates | | REER | Real Effective Exchange Rate | | RHS | Right Hand Side | | SAAR | Seasonally Adjusted Annualised Rate | | SAE | Second Advanced Estimates | | SCB | Scheduled Commercial Bank | | SDL | State Development Loan | | SEBI | Securities and Exchange Board of India | | SEK | Swedish Krona | | SIAM | Society of Indian Automobile Manufacturers | | SIDBI | Small Industries Development Bank of India | | SLF | Special Liquidity Facility | | SLR | Statutory Liquidity Ratio | | SPD | Standalone Primary Dealer | | SPV | Special Purpose Vehicle | | T-Bill | Treasury Bill | | TLTRO | Targeted Long-Term Repo Operation | | TSP | Triple Superphosphate | | UK | United Kingdom | | UNCTAD | United Nations Conference on Trade and Development | | US | United States | | US$ | US Dollar | | VAR | Vector Autoregression | | VAT | Value Added Tax | | WAC | Weighted Average Coupon | | WACR | Weighted Average Call Money Rate | | WADR | Weighted Average Discount Rate | | WADTDR | Weighted Average Domestic Term Deposit Rate | | WALR | Weighted Average Lending Rate | | WEO | World Economic Outlook | | WHO | World Health Organization | | WMA | Ways and Means Advance | | WPI | Wholesale Price Index | | WTI | West Texas Intermediate | | WTO | World Trade Organization | | y-o-y | Year-on-Year | | YTD | Year to Date | |